Connected Logistics Market Report Scope & Oveview:
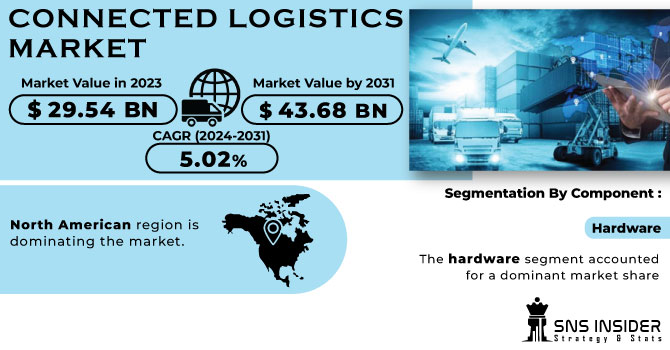
The Connected Logistics Market size was USD 29.54 billion in 2023 and is expected to Reach USD 43.68 billion by 2031 and grow at a CAGR of 5.02 % over the forecast period of 2024-2031.
Connecting logistics has transformed the logistical process into a more customer centric activity through sharing data, information and facts with supply chain partners. In order to increase productivity of logistics operations, connected logistics uses a network that links together communications networks, cloud platforms and the Internet of Things.
Get More Information on Connected Logistics Market - Request Sample Report
In addition, it may be described as a collection of interdependent devices that are deployed by logistics providers in order to provide more visibility into the way orders process, finance transactions, transportation and other logistical processes have been implemented, e.g. warehousing, transport or ancillary logistics services. Some of the factors contributing to market growth include advances in technology and increasing consumer appetite for shopping on the internet. Demand for such solutions is driven by the growing availability of integrated logistics systems that are highly interoperable, secure and accessible.
There are a number of challenges facing connected logistics, such as competition on the market, rising customer demand and lack of standardisation in this sector. In view of the need for improved integration, greater operational efficiency, Realtime reports, higher visibility and communication, however, the logistics sector has increasingly adopted modern technologies. As new vehicles equip themselves with fleet telematics, a technology based on mobile internet of Things connectivity enabling vehicle and carrier management, the potential for connected logistics is indisputable. Access the information from a number of sensors on your car.
MARKET DYNAMICS
KEY DRIVERS:
-
Emergence of IoT and Sensor Technologies
The Internet of Things (IoT) plays an important role in connected logistics by allowing devices and assets to communicate with each other and share data. Sensors can monitor parameters such as temperature sensor, humidity and shock, ensuring the quality and condition of goods during transit, which is especially important for industries such as pharmaceuticals and perishable goods.
-
Optimisation of routes, vehicle use and resource allocation can be achieved through integrated logistics solutions, leading to cost efficiency.
RESTRAIN:
-
The connected logistics ecosystem involves multiple stakeholders, technologies, and communication protocols
The lack of standardized approaches can create interoperability challenges and make it harder to integrate various components seamlessly.
OPPORTUNITY:
-
Emerging Technologies Integration
Incorporating emerging technologies like blockchain for secure data sharing and 5G for faster communication can unlock new possibilities in connected logistics.
-
Last mile logistics can be redefined by innovations in autonomous vehicles, drones and intelligent locker rooms.
CHALLENGES:
-
There is a high level of security and privacy concern associated with the increased connectivity and sharing of data in connected logistics systems
Protecting sensitive data, preventing unauthorized access, and ensuring compliance with data protection regulations are ongoing challenges.
IMPACT OF RUSSIAN UKRAINE WAR
The Russia-Ukrainian war has had a significant impact on the connected logistics market. The war disrupted supply chains, increased transportation costs, and created shortages of goods. War has disrupted supply chains in many ways. First, it closed ports in Ukraine and Russia, making it difficult to ship goods to and from those countries. Second, it leads to tighter border security measures, slowing the movement of goods. Third, it creates uncertainty about the future of the war, making companies reluctant to commit to long-term contracts. According to a report by the World Economic Forum, the Russia-Ukraine war could add $1.5 trillion to global supply chain costs by 2022. The report also estimates that the war could cause 30% delay of shipments to and from Russia.
A study by the Kiel Institute for World Economics found that war could increase the price of wheat by 40 % and corn by 20 %. The study also estimated that war could reduce world grain exports by 20 million tons.
The impact of the Russian-Ukrainian war on the connected logistics market is expected to be felt for many years. The war has highlighted the vulnerability of global supply chains and companies need to adopt more flexible and agile logistics strategies. War also increases transportation costs. Closing airspace over Ukraine, which requires rerouting of flights, increases fuel costs. Transportation demand increases as companies try to find alternative routes to get goods to their destinations. Rising fuel costs, a major component of transportation costs.
IMPACT OF ONGOING RECESSION
An economic downturn will likely lead to lower demand for goods and services, which in turn will lead to lower shipping volumes. This will reduce the revenue of logistics companies and make it more difficult for them to invest in new technology. Additionally, an economic downturn will likely lead to higher unemployment rates, which will make it harder for logistics companies to find skilled workers. This can lead to delays in shipments and increase costs for businesses.
A study by the McKinsey Global Institute found that a recession could reduce global trade by as much as 30%. This will lead to lower shipping volumes and revenue for logistics companies. Also, World Bank report shows that a recession can increase unemployment by up to 5%. This will make it harder for logistics companies to find skilled workers and can lead to delayed deliveries.
A study by the Boston Consulting Group found that an economic downturn can increase transportation costs by up to 20%. This will increase the financial burden on logistics companies and may complicate investments in new technology. The impact of the downturn on the connected logistics market is expected to be felt over several years. The economic downturn is expected to slow down the market growth and make it more difficult to innovate for logistics companies.
KEY MARKET SEGMENTS
By Component
-
Software
-
Services
-
Hardware
In terms of components, the market segments are hardware, solutions and services. The hardware segment accounted for a dominant market share, and is expected to grow at the fastest compound annual growth rate over the forecast period. The market is classified according to hardware as RFID tags, sensors, communication equipment, tracking devices and others. Sensor groups are estimated to occupy a significant market share in view of the growing demand for asset tracking.
The services market is projected to grow at a faster compound annual growth rate during the forecast period. In particular, the growth of demand for managed services linked to logistics is leading to a continuous expansion of the market. Key players are involved in providing services such as consultation, integration and implementation, support and maintenance or management of the service. The consulting services shall provide assistance to transport service providers in the field of special and specialised solutions.
By Transportation Mode
-
Roadways
-
Airways
-
Waterways
The road segment is expected to be the dominant sector, based on transportation mode. During the forecast period, this segment is expected to grow at faster CAGR. It is due, in particular to last mile deliveries, to increasing demand for truck transport of retail goods over lengthy distances. Furthermore, this way of transport can carry a considerable amount of cargo and is widely considered to be the preferred option for logistics. The growth of this segment is also being driven by an increase in government support for the transport sector throughout the world.
The rail segment is projected to increase strongly over the forecast period. This way of transport has inherent advantages for reducing frictional drag, making it possible to carry larger loads onto trucks and cars. In addition, growth of this segment is projected to be influenced by the growing government initiatives promoting rail freight transport.
By Vertical
-
Automotive
-
Healthcare
-
Retail & E-commerce
-
Energy
-
Aerospace & Defense
-
Others
The market is divided on the basis of vertical into retail and e commerce, automobiles, aerospace & defense, healthcare, energy semiconductors, electronics & electricals, and others. The retail and e commerce segments will dominate the market. In order to cope with growing business needs, the retail sector relies on connected logistics solutions. By using connected logistics solutions which are adapted to the interests of retail and e commerce, reliability is improved.
The automotive segment is expected to account for a significant share of the market over the forecast period. Real time infographics based on the vehicle location, cargo status and driver behaviour can be found in related logistics solutions for the car industry. Solutions that meet the specific needs of the vehicle industry are provided by major market players.
REGIONAL ANALYSIS
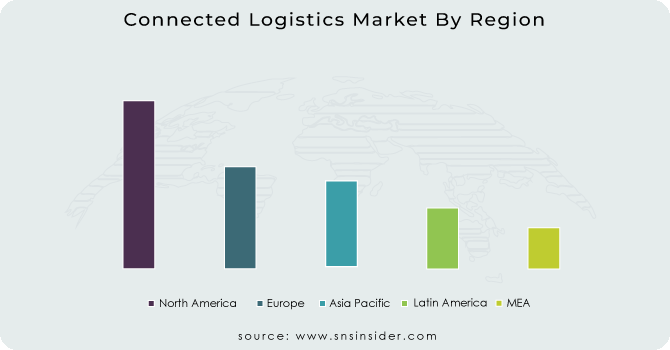
North American region is dominating the market. The dominance is due to the presence of highly developed infrastructure for rail and road connections. Moreover, the region's potential as a major revenue generator in the world market can be achieved by the presence of key industry players. Modern infrastructure will enable more rapid deployment of modern technologies. In view of the development of new technology, increased working capital and rapidly growing e commerce sector, it is projected that the United States will maintain its dominance over the forecast period.
During the forecast period, Asia Pacific is expected to increase at the highest compound annual growth rate. In particular, the Asia Pacific region is predicted to be at the centre of all investment growth logistics as compared with other regions in terms of economic growth. Moreover, regional growth over the forecast period is projected to be supported by further technological progress on transport as well as more investment into megacities. The target market is growing at a rapid pace due to the development of online shopping and manufacturing in the region. The main markets in this area are China and India.
Get Customized Report as per your Business Requirement - Request For Customized Report
REGIONAL COVERAGE:
North America
-
US
-
Canada
-
Mexico
Europe
-
Eastern Europe
-
Poland
-
Romania
-
Hungary
-
Turkey
-
Rest of Eastern Europe
-
-
Western Europe
-
Germany
-
France
-
UK
-
Italy
-
Spain
-
Netherlands
-
Switzerland
-
Austria
-
Rest of Western Europe
-
Asia Pacific
-
China
-
India
-
Japan
-
South Korea
-
Vietnam
-
Singapore
-
Australia
-
Rest of Asia Pacific
Middle East & Africa
-
Middle East
-
UAE
-
Egypt
-
Saudi Arabia
-
Qatar
-
Rest of Middle East
-
-
Africa
-
Nigeria
-
South Africa
-
Rest of Africa
-
Latin America
-
Brazil
-
Argentina
-
Colombia
-
Rest of Latin America
Key Players
Some major key players in the Connected Logistics market are NEC Corporation, Cisco System Inc, Intel Corporation, Amazon Web Services, HCL Technology Limited, Infosys Limited, Honeywell International Inc, SAP SE, IBM Corporation, Siemens and other players.
Intel Corporation-Company Financial Analysis
RECENT DEVELOPMENT
-
The launch of the International Ship Services Portal has been reported by iThink Logistics, an India based SaaS shipping platform. The new company, iThink Logistics International, would allow booming SMEs and D2C brands to reach global markets via strategic partnerships with I Think Logistics International in order to expand and grow their online sales.
-
Infosys, India's leading IT services company, announced a collaboration with Walmart Commerce Technologies to help retailers take advantage of technology solutions that facilitate customer and employee experiences.
| Report Attributes | Details |
| Market Size in 2023 | US$ 29.54 Bn |
| Market Size by 2031 | US$ 43.68 Bn |
| CAGR | CAGR of 5.02 % From 2024 to 2031 |
| Base Year | 2023 |
| Forecast Period | 2024-2031 |
| Historical Data | 2020-2022 |
| Report Scope & Coverage | Market Size, Segments Analysis, Competitive Landscape, Regional Analysis, DROC & SWOT Analysis, Forecast Outlook |
| Key Segments | • by Component (Software, Services, Hardware) • by Transportation Mode (Roadways, Railways, Airways, Waterways) • by Vertical (Automotive, Healthcare, Retail & E-commerce, Energy, Aerospace & Defence, Others) |
| Regional Analysis/Coverage | North America (US, Canada, Mexico), Europe (Eastern Europe [Poland, Romania, Hungary, Turkey, Rest of Eastern Europe] Western Europe] Germany, France, UK, Italy, Spain, Netherlands, Switzerland, Austria, Rest of Western Europe]). Asia Pacific (China, India, Japan, South Korea, Vietnam, Singapore, Australia, Rest of Asia Pacific), Middle East & Africa (Middle East [UAE, Egypt, Saudi Arabia, Qatar, Rest of Middle East], Africa [Nigeria, South Africa, Rest of Africa], Latin America (Brazil, Argentina, Colombia Rest of Latin America) |
| Company Profiles | NEC Corporation, Cisco System Inc, Intel Corporation, Amazon Web Services, HCL Technology Limited, Infosys Limited, Honeywell International Inc, SAP SE, IBM Corporation, Siemens |
| Key Drivers | • Emergence of IoT and Sensor Technologies • Optimisation of routes, vehicle use and resource allocation can be achieved through integrated logistics solutions, leading to cost efficiency. |
| Market Restraints | • The connected logistics ecosystem involves multiple stakeholders, technologies, and communication protocols |
Get in Touch
