Digital Blood Pressure Monitors Market Report Scope & Overview:
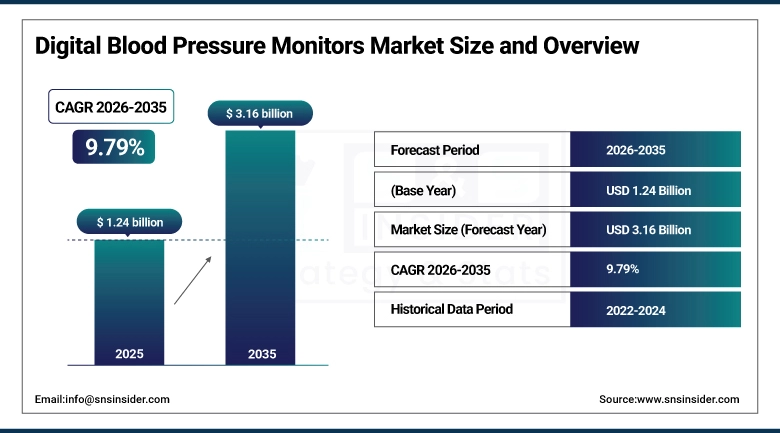
The Digital Blood Pressure Monitors Market size was valued at USD 1.24 billion in 2025 and is expected to reach USD 3.16 billion by 2035, growing at a CAGR of 9.79% over the forecast period of 2026–2035.
The global digital blood pressure monitors market is expanding at a robust growth rate, owing to the rising incidence of hypertension, cardiovascular, and other lifestyle-related disorders that require continuous and non-invasive blood pressure monitoring. The rising trend of using home blood pressure monitoring devices, including Bluetooth-enabled and smartphone-integrated oscillometric devices, and the rising clinical acceptability of using blood pressure monitoring devices for out-of-office blood pressure monitoring are further adding to the growth of the global digital blood pressure monitors market. The replacement of conventional mercury sphygmomanometers by scientifically validated and WHO-approved digital and electronic blood pressure monitoring devices, coupled with the ban on the use of mercury-based sphygmomanometers, is another growth driver for the global digital blood pressure monitors market. The rising trend of using telehealth services, wearable technology, and direct-to-consumer health devices is changing the paradigm for hypertension management, thereby adding to the importance of using digital blood pressure monitoring devices.
For instance, the WHO reported in 2023 that approximately 1.28 billion adults aged 30–79 years worldwide have hypertension, yet nearly 46% remain undiagnosed, a critical gap that is directly fueling demand for accessible, accurate, and connected digital blood pressure monitoring solutions globally.
Digital Blood Pressure Monitors Market Size and Forecast:
-
Market Size in 2025: USD 1.24 billion
-
Market Size by 2035: USD 3.16 billion
-
CAGR: 9.79% from 2026 to 2035
-
Base Year: 2025
-
Forecast Period: 2026–2035
-
Historical Data: 2022–2024
To Get more information on Digital Blood Pressure Monitors Market - Request Free Sample Report
Digital Blood Pressure Monitors Market Trends
-
Surging global hypertension burden, with over 1.28 billion affected adults worldwide, is propelling demand for validated digital BP monitors across clinical and home-use settings.
-
Integration of Bluetooth, Wi-Fi, and NFC connectivity in upper-arm and wrist-type monitors enables real-time data synchronization with EHR systems and mobile health applications.
-
Growing adoption of oscillometric measurement technology validated by the American Heart Association (AHA) and European Society of Hypertension (ESH) for clinical-grade accuracy in home monitoring devices.
-
Expansion of telehealth and remote patient monitoring (RPM) programs accelerating physician-prescribed home BP monitoring as a standard of hypertension care management.
-
Miniaturization of sensor technology and advances in cuffless wearable blood pressure monitoring creating new frontiers in continuous cardiovascular surveillance.
-
Increasing preference among elderly populations and chronic disease patients for user-friendly, large-display, one-touch digital BP devices with irregular heartbeat (IHB) detection.
-
Regulatory harmonization across the U.S. (FDA 510(k)), EU (MDR), and Asia Pacific markets driving quality standardization and validating digital blood pressure monitor accuracy claims.
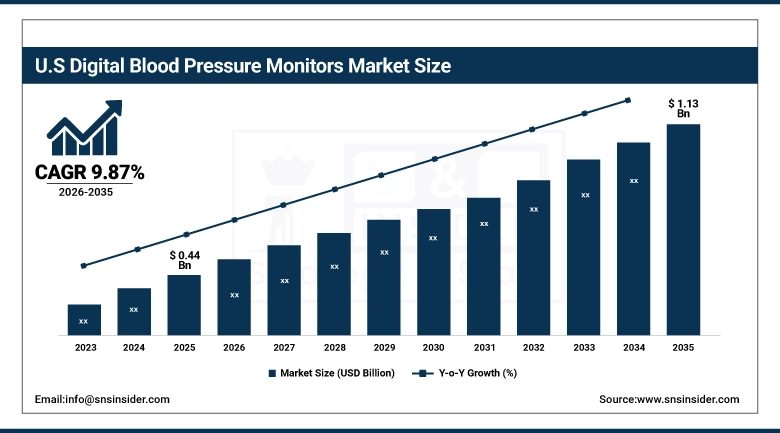
The U.S. Digital Blood Pressure Monitors Market was valued at USD 0.44 billion in 2025 and is expected to reach USD 1.13 billion by 2035, growing at a CAGR of 9.87% from 2026–2035. United States has the largest share of the global digital blood pressure monitors market, as the country has the most number of population having hypertension with 119 million adults in the country affected by the condition (CDC, 2023). Furthermore, good health insurance reimbursement systems exist for equipment that are integrated into remote monitoring platform and also population has good awareness on preventive cardiovascular health. Government-sponsored initiatives include the Million Hearts initiative, expanded Medicare remote monitoring billing codes (CPT 99453, 99454), and retail store availability. Share of the US in the global digital sphygmomanometers market is due to the high penetration of validated upper-arm automatic equipment across hospitals, ambulatory and homecare settings and continuous innovations in the equipment by the country and global players.
Digital Blood Pressure Monitors Market Growth Drivers:
-
Escalating Global Hypertension Prevalence and Chronic Disease Burden is Driving the Digital Blood Pressure Monitors Market Growth
The increasing global burden of hypertension and cardiovascular diseases is the first structural factor for the growth of the digital blood pressure monitors market. This is because hypertension is a major cause of 10.8 million deaths worldwide annually (Global Burden of Disease, 2023), and cardiovascular diseases, being the world’s largest cause of deaths, are further increasing the need for continuous blood pressure management. This is a significant factor for the continuous and increasing use of digital blood pressure monitors in all settings, from the ICU to the home environment. Furthermore, the world is aging, and it is projected that the population aged 65+ will be 1.6 billion in 2050.
For instance, in 2024, the American Heart Association emphasized that self-measured blood pressure monitoring (SMBP) programs reduce systolic BP by an average of 7 mmHg, generating significant clinical interest and adoption of home digital blood pressure monitors as a first-line hypertension management tool.
Digital Blood Pressure Monitors Market Restraints:
-
Device Accuracy Concerns and Lack of Clinical Validation for Wrist-Type Monitors are Hampering Market Growth
In spite of robust overall market growth, accuracy variability, especially for wrist-type digital blood pressure monitoring devices, and the lack of overall clinical validation for a wider range of consumer-grade devices are significant restraint factors. Positioning errors, movements, and wrist angles for wrist-type devices can result in clinically significant BP measurement deviations, thereby impacting physician confidence in patient-reported home BP measurements. Additionally, reimbursement challenges faced by lower-income nations and price sensitivity for elderly patients in emerging nations pose challenges for premium connected digital BP devices, thereby creating friction for these high-growth geographies.
Digital Blood Pressure Monitors Market Opportunities:
-
Cuffless and Wearable Blood Pressure Monitoring Technology Presents Transformative Growth Opportunities
Cuffless and continuous wearable BP monitoring technology is another exciting growth opportunity for digital blood pressure monitors. It is based on photoplethysmography (PPG), pulse transit time (PTT), and machine learning algorithms. With smartwatches and wearables from various tech and medtech giants integrating BP estimation technology into their products, this market is witnessing a huge growth opportunity in terms of market size. Various regulatory approvals for cuffless BP monitors and an increase in clinical trials will help this market grow in preventive care, sports medicine, and chronic care segments in the future, i.e., until 2035.
For instance, in March 2024, Samsung received regulatory approval in South Korea for blood pressure monitoring on Galaxy Watch devices using PPG-based technology, signaling an accelerating trend of wearable BP monitoring integration that is set to redefine the digital blood pressure monitors competitive landscape globally.
Digital Blood Pressure Monitors Market Segment Analysis
-
By product type, the arm-type segment held the largest market share of approximately 67.84% in 2025, while the wrist-type segment is expected to register the highest CAGR of 10.62% during the forecast period.
-
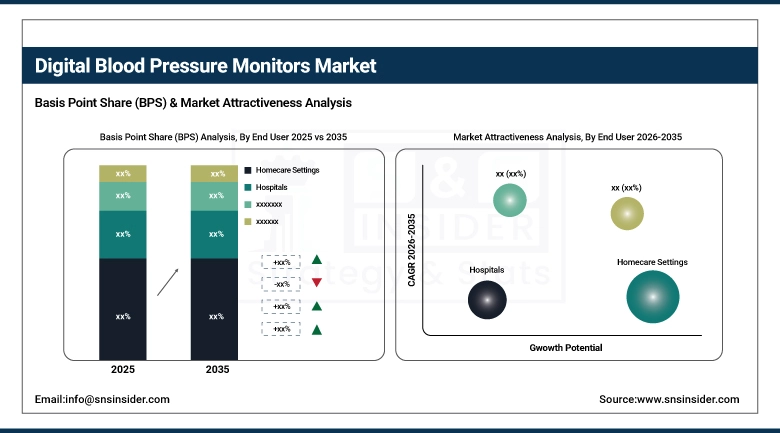
By end user, the homecare settings segment dominated with approximately 42.31% market share in 2025 and is projected to sustain the fastest CAGR of 10.18% through 2035.
By End User, Homecare Settings Lead and Register Fastest Growth
The homecare settings segment held the maximum end-user share of around 42.31% in 2025, which reflects the paradigm shift towards a more patient-centric blood pressure management strategy outside of clinic settings. Increasing physician recommendation for SMBP, a higher elderly population preferring at-home monitoring of chronic conditions, and increasing accessibility of affordable and clinically validated home BP monitoring devices through e-commerce, pharmacy, and retail channels are major factors driving this segment's share and growth. In addition as homecare settings are also anticipated to capture the highest CAGR of 10.18% during the forecast period, as reduced cost due to telehealth adoption, rising RPM program and more evidence that HBPM is more sensitive in predicting cardiovascular outcomes than clinic BP monitoring. Hospitals similarly hold a large slice of about 33.47% of the market share in 2025 owing to high patient turnover rate, device purchases, and rise in the number of hypertension screening programs undertaken by hospitals.
By Product Type, Arm Type Leads the Market, While Wrist Type Registers Fastest Growth
The arm type digital blood pressure monitors segment retained its largest revenue share of approximately 67.84% in 2025, owing to its superior clinical validation, recommendation by physicians, and established position as the gold-standard approach for accurate BP monitoring, as recommended by prominent cardiology and hypertension associations. The upper arm oscillometric monitors continue to enjoy their position as the preferred choice in terms of accurate results, less likelihood of motion artifact, and variety of cuff sizes for different patient populations, making this type of BP monitoring equipment a favorite in various healthcare settings and homes. On the other hand, the wrist type digital blood pressure monitors segment is expected to achieve the highest CAGR of approximately 10.62% from 2026-2035, owing to its popularity as a consumer product of choice, especially among tech-savvy younger generations of consumers seeking preventive measures for cardiovascular diseases and its integration with smartwatch technology. Improving accuracy in its validation and the expanding retail market for digital health products are key drivers for this segment's high growth rate.
Digital Blood Pressure Monitors Market Regional Highlights:
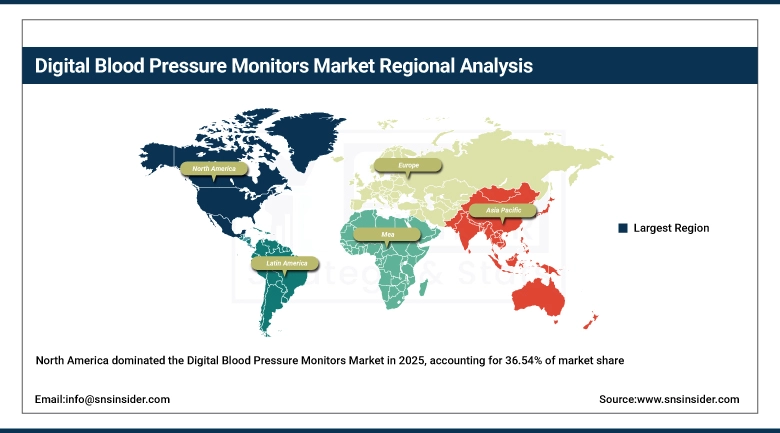
North America Digital Blood Pressure Monitors Market Insights:
In 2025, North America dominated the revenue share with roughly 36.54%, owing to the high prevalence of hypertension, well-established regulatory infrastructure, advanced adoption of healthcare IT, and high consumer awareness pertaining to cardiovascular risk management. The dominant share of the region is held by the U.S., driven by established telehealth infrastructures, Medicare and Medicaid RPM reimbursement codes, and consumer-grade digital BP devices with extensive retail distribution. Market growth is also being driven by increasing primary care hypertension guidelines in Canada and government programs focusing on chronic disease self-management by the patient. North America remains at the forefront of the BP management market up to 2035, driven by continued investments into connected health platforms and newer AI-integrated BP management applications.
Get Customized Report as per Your Business Requirement - Enquiry Now
Asia Pacific Digital Blood Pressure Monitors Market Insights:
Digital blood pressure monitors market by regional segment Asia Pacific is the fastest growing regional segment witnessing 11.42% CAGR in the forecast period 2026–2035. It hosts the global largest number of absolute hypertension burden, where China and India alone represent greater than have billion of hypertensives. Increasing budgetary allocation towards healthcare, swift urbanization, expanding middle-class population, and increasing penetration of home health monitoring appliances are key growth drivers. Yet, sustained institutional and consumer demand for digital BP monitoring solutions are primarily driven by ongoing government-led hypertension control programs in China, the integration of remote health monitoring within India’s Ayushman Bharat Digital Mission, as well as Japan’s aging super-society. Market acceleration is further supported by low product price points, regional manufacturers localising product development, and continuous dominance of omnichannel retailing in Southeast Asia.
Europe Digital Blood Pressure Monitors Market Insights:
Europe accounts for the second-largest regional market, supported by the high cardiovascular disease burden, public healthcare reimbursement for home BP monitoring devices, and strong regulatory frameworks with regulations according to the EU Medical Device Regulation (MDR 2017/745). HBPM is supported by national hypertension guidelines in Germany, the UK, France, and Italy, and demand is regularly generated at the clinical level. The sustained market momentum also owes to necessary cross-border digital health initiatives, device validation protocols for ESH-endorsed devices, and expanding e-health infrastructures in Western and Eastern Europe, added the Study Director. In addition, there is increasing adoption of telemonitoring-based BP management interventions in primary care and cardiology practices.
Latin America (LATAM) and Middle East & Africa (MEA) Digital Blood Pressure Monitors Market Insights:
Rising prevalence of cardiovascular diseases in conjunction with record-high investments in healthcare digitization and broadband & smartphone connectivity are driving the LATAM and MEA digital blood pressure monitors market. Emerging growth markets including Brazil, Mexico, Saudi Arabia and the UAEare also seeing wide adoption, encouraged by government support for chronic disease management, burgeoning retail pharmacy chains and a growing middle-class demand for preventive health devices. Availability of low-cost products, consumer health education programs in multiple languages, and improving healthcare infrastructure are gradually making the market more accessible and increasing patient uptake in both regions.
Digital Blood Pressure Monitors Market Competitive Landscape:
Omron Healthcare Co., Ltd. (est. A&D Company, Limited manufactures and sells digital blood pressure monitors worldwide with the largest consumer and clinical device portfolio validated by major international hypertension societies. By combining OMRON connect health management platform and clinically validated upper-arm and wrist-type monitors, Omron provides integrated remote monitoring solutions to patients and healthcare professionals across the globe.
-
In January 2025, Omron Healthcare launched the HEM-7600T Series, an advanced upper-arm BP monitor with Bluetooth 5.0 connectivity, atrial fibrillation (AFib) detection, and seamless integration with Apple Health and Google Fit, targeting both clinical and premium home-use segments globally.
Philips Healthcare (est. 1891) is a leading healthcare technology company with innovative patient care monitoring and connected health ecosystems for digital blood pressure monitoring in everyday clinical practice. Philips highlights accurate oscillometric measurement, compatible with telehealth and integrated into clinical workflows in the hospital, ambulatory and home care settings.
-
In June 2024, Philips expanded its IntelliVue portfolio with AI-enhanced continuous BP monitoring solutions for hospital ward settings, improving early hemodynamic deterioration detection and clinical outcome management across North American and European health systems.
A&D Medical Inc. (est.2019) is one of the world specialist for clinically validated digital Blood Pressure monitors for upper-arm and wrist for both clinical and home-use target markets with multi-user memory, professional averaging process, Bluetooth connection for integrated e-Health experience.
-
In September 2024, A&D Medical introduced the UA-1200BLE series featuring enhanced 5-position cuff detection technology and expanded RPM platform compatibility, strengthening adoption among telehealth providers and primary care practices managing hypertensive patient populations.
Digital Blood Pressure Monitors Market Key Players:
-
Omron Healthcare Co., Ltd.
-
Philips Healthcare
-
A&D Medical
-
Microlife Corporation
-
Beurer GmbH
-
Withings
-
Panasonic Corporation
-
Rossmax International Ltd.
-
Welch Allyn (Baxter International)
-
Bosch + Sohn GmbH (boso)
-
iHealth Labs Inc.
-
Qardio Inc.
-
SunTech Medical
-
Spacelabs Healthcare
-
Citizen Systems Japan Co., Ltd.
-
American Diagnostic Corporation (ADC)
-
Drive DeVilbiss Healthcare
-
Kaz Inc. (Braun / Helen of Troy)
-
Greater Goods (Brentwood Consumer Products)
-
Hartmann Group (PAUL HARTMANN AG)
| Report Attributes | Details |
|---|---|
| Market Size in 2025 | USD 1.24 Billion |
| Market Size by 2035 | USD 3.16 Billion |
| CAGR | CAGR of 9.79% From 2026 to 2035 |
| Base Year | 2025 |
| Forecast Period | 2026-2035 |
| Historical Data | 2022-2024 |
| Report Scope & Coverage | Market Size, Segments Analysis, Competitive Landscape, Regional Analysis, DROC & SWOT Analysis, Forecast Outlook |
| Key Segments | • By Product Type (Arm Type, Wrist Type) • By End User (Hospitals, Ambulatory Surgical Centers & Clinics, Homecare Settings, and Others) |
| Regional Analysis/Coverage | North America (US, Canada, Mexico), Europe (Eastern Europe [Poland, Romania, Hungary, Turkey, Rest of Eastern Europe] Western Europe] Germany, France, UK, Italy, Spain, Netherlands, Switzerland, Austria, Rest of Western Europe]), Asia Pacific (China, India, Japan, South Korea, Vietnam, Singapore, Australia, Rest of Asia Pacific), Middle East & Africa (Middle East [UAE, Egypt, Saudi Arabia, Qatar, Rest of Middle East], Africa [Nigeria, South Africa, Rest of Africa], Latin America (Brazil, Argentina, Colombia, Rest of Latin America) |
| Company Profiles | Omron Healthcare Co., Ltd., Philips Healthcare, A&D Medical, Microlife Corporation, Beurer GmbH, Withings, Panasonic Corporation, Rossmax International Ltd., Welch Allyn (Baxter International), Bosch + Sohn GmbH (boso), iHealth Labs Inc., Qardio Inc., SunTech Medical, Spacelabs Healthcare, Citizen Systems Japan Co., Ltd., American Diagnostic Corporation (ADC), Drive DeVilbiss Healthcare, Kaz Inc. (Braun / Helen of Troy), Greater Goods (Brentwood Consumer Products), Hartmann Group (PAUL HARTMANN AG). |
Frequently Asked Questions
The arm-type segment dominates the Digital Blood Pressure Monitors Market with a 67.84% share in 2025, due to higher clinical accuracy.
North America leads the Digital Blood Pressure Monitors Market, holding 36.54% market share in 2025.
The Digital Blood Pressure Monitors Market was valued at USD 1.24 billion in 2025 and is projected to reach USD 3.16 billion by 2035.
The Digital Blood Pressure Monitors Market is expected to grow at a CAGR of 9.79% during 2026–2035.
The wrist-type segment is the fastest-growing in the Digital Blood Pressure Monitors Market, with a CAGR of 10.62% through 2035.
Get in Touch
