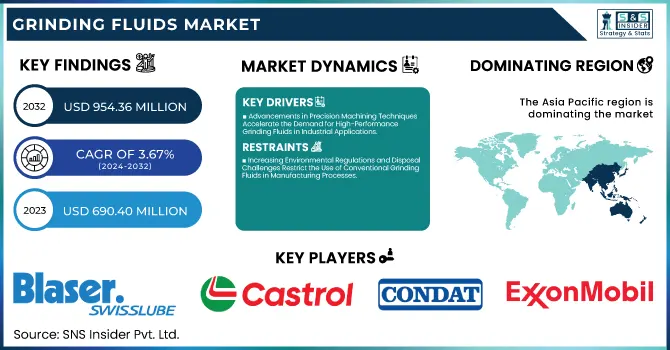
The Grinding Fluids Market Size was valued at USD 690.40 Million in 2023 and is expected to reach USD 954.36 Million by 2032, growing at a CAGR of 3.67% over the forecast period of 2024-2032.
To Get more information on Grinding Fluids Market - Request Free Sample Report
The Grinding Fluids Market is evolving as industries embrace innovation and sustainability. Investment trends reveal a surge in R&D, mergers, and expansions to enhance product performance. A deep raw material analysis in our report uncovers sourcing challenges and price fluctuations affecting manufacturers. As environmental concerns rise, recyclability and waste management of used grinding fluids are shaping regulations and industry practices. The market’s growth is also tied to GDP and industrial expansion, as rising manufacturing activities drive demand. Meanwhile, sustainability and bio-based alternatives are gaining traction, with eco-friendly formulations reshaping competition. Our report provides exclusive insights into these key trends, mapping the future of grinding fluids in an increasingly dynamic industrial landscape.
Drivers
Advancements in Precision Machining Techniques Accelerate the Demand for High-Performance Grinding Fluids in Industrial Applications
The increasing adoption of precision machining techniques across industries such as automotive, aerospace, medical devices, and electronics is driving demand for high-performance Grinding Fluids Market solutions. Modern manufacturing relies on advanced grinding processes that require fluids with superior lubrication, cooling, and anti-wear properties. With the rise of computer numerical control (CNC) machines and automation, manufacturers seek grinding fluids that ensure optimal performance and enhance tool life. Additionally, the growing use of materials like superalloys, composites, and ceramics presents new challenges that demand specialized fluid formulations. High-speed and creep-feed grinding operations require efficient heat dissipation to prevent thermal damage and maintain workpiece integrity. Companies are investing in research and development to create synthetic and semi-synthetic grinding fluids that reduce mist formation, extend service life, and minimize bacterial contamination. Furthermore, sustainability concerns have led to the development of low-VOC and biodegradable grinding fluids. Industries are also adopting smart fluid management systems that monitor contamination levels in real-time, improving operational efficiency. These advancements make high-performance grinding fluids indispensable for modern manufacturing.
Restraints
Increasing Environmental Regulations and Disposal Challenges Restrict the Use of Conventional Grinding Fluids in Manufacturing Processes
Stringent environmental regulations on the disposal and recyclability of grinding fluids limit the use of conventional petroleum-based formulations in manufacturing. Used grinding fluids often contain contaminants such as heavy metals, bacteria, and toxic chemicals, requiring costly treatment before disposal. Regulatory agencies worldwide have enforced strict guidelines on fluid waste management, pushing industries to adopt environmentally friendly alternatives. However, transitioning to biodegradable or water-based grinding fluids presents challenges, as some formulations lack the same lubrication and cooling properties as traditional fluids. Industries must also invest in advanced filtration, recycling, and monitoring systems to comply with evolving regulations, increasing operational expenses. The complexity of fluid disposal and treatment adds another layer of regulatory compliance, making it challenging for manufacturers to balance cost and sustainability. Companies that fail to adapt to these regulatory changes may face penalties, limiting their ability to operate in environmentally strict regions. These factors restrain the market’s growth, requiring continuous innovation in sustainable grinding fluid formulations and waste management solutions.
Opportunities
Growing Investments in Smart Manufacturing and Industry 4.0 Technologies Enhance the Demand for Intelligent Grinding Fluid Management Systems
The increasing adoption of Industry 4.0 and smart manufacturing technologies presents significant opportunities for the Grinding Fluids Market. Digitalization and automation have transformed industrial processes, leading to the development of intelligent fluid management systems that optimize grinding fluid performance. IoT-enabled sensors, AI-driven analytics, and real-time monitoring technologies are being integrated into grinding fluid systems to track concentration levels, contamination, and viscosity. These advancements help manufacturers improve efficiency, extend fluid life, and reduce overall consumption. Additionally, automated fluid dispensing systems ensure precise fluid usage, preventing excess waste and lowering costs. With industries prioritizing sustainability and operational efficiency, the demand for smart grinding fluid solutions is expected to grow. Companies investing in digitalized fluid management technologies can gain a competitive edge by offering enhanced performance, cost savings, and sustainability benefits. The integration of Industry 4.0 in grinding processes will drive innovations in fluid formulations, paving the way for a new era of efficiency-driven and environmentally friendly grinding fluid solutions.
Challenge
Development of Cost-Effective Bio-Based Grinding Fluids Without Compromising Performance Remains a Significant Industry Challenge
Developing bio-based grinding fluids that offer the same performance as traditional petroleum-based formulations remains a critical challenge for the industry. Many bio-based fluids suffer from lower oxidation stability, reduced lubrication properties, and shorter lifespans, making them less effective in high-speed and heavy-duty grinding applications. Additionally, the high cost of plant-derived raw materials and production processes makes bio-based grinding fluids more expensive than conventional options. To bridge this gap, researchers are exploring advanced additives and synthetic alternatives to enhance the efficiency of bio-based formulations. However, large-scale commercialization remains difficult due to cost constraints and inconsistent raw material availability. Addressing this challenge requires collaboration between manufacturers, researchers, and policymakers to develop economically viable and high-performance bio-based grinding fluid solutions.
By Type
Synthetic grinding fluids dominated the Grinding Fluids Market in 2023 with a market share of 40.7%. The dominance of synthetic fluids is attributed to their superior performance in high-speed and precision grinding applications across industries such as automotive, aerospace, and electronics. Unlike semi-synthetic and water-soluble alternatives, synthetic grinding fluids offer enhanced lubrication, cooling, and rust protection, leading to increased tool life and surface finish quality. The rising adoption of eco-friendly and low-volatile organic compound (VOC) formulations, driven by regulatory bodies like the U.S. Environmental Protection Agency (EPA) and European Chemicals Agency (ECHA), has further accelerated their demand. Additionally, companies such as ExxonMobil, Quaker Houghton, and Castrol have been actively developing advanced synthetic formulations with extended service life and reduced environmental impact. In 2023, the International Manufacturing Technology Show (IMTS) highlighted the growing preference for synthetic fluids in CNC machining and metal grinding applications, emphasizing their role in improving efficiency and sustainability. The continued shift toward automation and precision manufacturing further cements synthetic fluids as the preferred choice in the industry.
By Application
Disk drivers dominated the Grinding Fluids Market in 2023 with a market share of 35.6%. The increasing production of hard disk drives (HDDs) and solid-state drives (SSDs) for consumer electronics, data centers, and industrial applications has fueled the demand for grinding fluids in this segment. The precision grinding of disk platters and drive components requires highly stable fluids that provide exceptional cooling, prevent surface defects, and reduce machining downtime. With the surge in global data storage needs, leading technology firms like Western Digital, Seagate, and Toshiba have ramped up manufacturing, directly impacting the demand for high-performance grinding fluids. Government-backed digitalization initiatives, such as China’s “Made in China 2025” and the U.S. CHIPS and Science Act, have further stimulated investment in semiconductor and storage device manufacturing, reinforcing the dominance of the disk driver segment. Additionally, industry reports from SEMI (Semiconductor Equipment and Materials International) indicate a rising demand for ultra-precise grinding fluids in the silicon wafer and HDD manufacturing process, further supporting this segment’s leadership in the market.
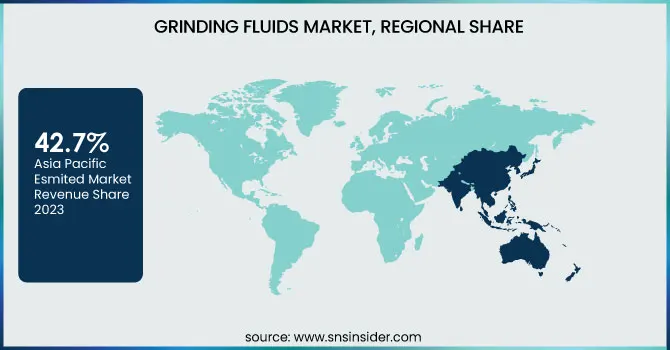
Asia Pacific dominated the Grinding Fluids Market in 2023 with a market share of 42.7%. The region’s leadership is driven by the strong presence of manufacturing hubs in China, India, Japan, and South Korea, where metalworking and automotive industries heavily rely on grinding fluids for precision machining. China, as the world’s largest automotive producer, accounted for over 26 million vehicle productions in 2023 (China Association of Automobile Manufacturers - CAAM), significantly driving demand for grinding fluids. Furthermore, China’s booming electronics sector, particularly in semiconductor manufacturing, has propelled the usage of high-performance synthetic grinding fluids for silicon wafer processing. Japan, home to leading machine tool manufacturers like Mazak and Okuma, has contributed significantly to the market with its advanced manufacturing capabilities. Meanwhile, India's rise as a global manufacturing hub has led to substantial investments in infrastructure, boosting the production of heavy machinery and precision engineering components. Additionally, South Korea’s dominance in semiconductor manufacturing, with companies like Samsung and SK Hynix investing in cutting-edge chip fabrication plants, has fueled demand for specialized grinding fluids used in wafer polishing and fabrication processes. The expansion of industrial activities, along with increased government support for domestic manufacturing, continues to reinforce Asia Pacific’s dominance in the market.
Europe emerged as the fastest-growing region in the Grinding Fluids Market with a significant CAGR during the forecast period. The growth is fueled by stringent environmental regulations promoting the adoption of bio-based and low-VOC grinding fluids, along with a rising focus on precision engineering in the aerospace, automotive, and medical device industries. Germany, the region’s leading market, accounted for over a major share of Europe's total metalworking fluid consumption in 2023 (VDMA - German Engineering Federation), owing to its dominance in automotive and industrial machinery production. The presence of major automakers like Volkswagen, BMW, and Daimler has spurred demand for advanced grinding fluids to enhance machining efficiency. France and Italy, both strongholds of aerospace and high-precision manufacturing, have also seen increased demand for high-performance grinding fluids. Additionally, the European Union's push toward sustainable manufacturing practices is accelerating the adoption of water-soluble and bio-based fluids, further driving market growth in the region.
Get Customized Report as per Your Business Requirement - Enquiry Now
Key Players
Benz Oil, Inc. (AMSOIL INC.) – (Benz Met-Grind, Benz Tech-Grind)
Blaser Swisslube AG – (Blasogrind, B-Cool)
Castrol Ltd. (BP P.L.C.) – (Castrol Syntilo, Castrol Hysol)
CGF, Inc. (Cutting & Grinding Fluids, Inc.) – (CGF Aqua-Grind, CGF Super-Grind)
Cimcool Industrial Products LLC – (Cimperial, Cimtech)
Condat Group – (Mecagreen, Condagreen)
EnviroServe Chemicals, Inc. – (ES-Grind, EnviroCut)
ETNA Products, Inc. – (ETNA Grindway, ETNA Cutcool)
ExxonMobil Corporation – (Mobilgrind, Mobilcut)
FUCHS Petrolub SE – (Ecocool, Ecocut)
Houghton International Inc. (Quaker Houghton) – (Hocut, Houghto-Grind)
Idemitsu Kosan Co., Ltd. – (Daphne Alphacool, Daphne Cut)
Indian Oil Corporation Ltd. (Servo Lubricants) – (Servo Kool, Servo Cut)
Lincoln Chemical Corporation – (LinCool, LinTech Grind)
Master Fluid Solutions – (Trim Microsol, Trim E206)
oelheld GmbH – (SintoGrind, DiaGrind)
Quaker Houghton – (Quakercool, QuakerCut)
TotalEnergies SE – (Valona, Lactuca)
Yushiro Chemical Industry Co., Ltd. – (Yushiroken, Yushirocut)
Recent Developments
May 2024: FUCHS launched ECOCOOL GLOBAL 1000, a cutting and grinding fluid for aerospace, improving tool life by 150% and cutting speeds by 16%. It also introduced FLUIDS LIVE for real-time lubricant monitoring.
Report Attributes | Details |
---|---|
Market Size in 2023 | USD 690.40 Million |
Market Size by 2032 | USD 954.36 Million |
CAGR | CAGR of 3.67% From 2024 to 2032 |
Base Year | 2023 |
Forecast Period | 2024-2032 |
Historical Data | 2020-2022 |
Report Scope & Coverage | Market Size, Segments Analysis, Competitive Landscape, Regional Analysis, DROC & SWOT Analysis, Forecast Outlook |
Key Segments | •By Type (Semi-synthetic, Synthetic, Water-soluble, Others) •By Application (Disk Drivers, Lubricate Machine Tools, Metal Substrates, Silicon Wafer, Others) |
Regional Analysis/Coverage | North America (US, Canada, Mexico), Europe (Eastern Europe [Poland, Romania, Hungary, Turkey, Rest of Eastern Europe] Western Europe] Germany, France, UK, Italy, Spain, Netherlands, Switzerland, Austria, Rest of Western Europe]), Asia Pacific (China, India, Japan, South Korea, Vietnam, Singapore, Australia, Rest of Asia Pacific), Middle East & Africa (Middle East [UAE, Egypt, Saudi Arabia, Qatar, Rest of Middle East], Africa [Nigeria, South Africa, Rest of Africa], Latin America (Brazil, Argentina, Colombia, Rest of Latin America) |
Company Profiles | ExxonMobil Corporation, TotalEnergies SE, FUCHS Petrolub SE, Castrol Ltd. (BP P.L.C.), oelheld GmbH, ETNA Products, Inc., Benz Oil, Inc. (AMSOIL INC.), Lincoln Chemical Corporation, EnviroServe Chemicals, Inc., CGF, Inc. (Cutting & Grinding Fluids, Inc.) and other key players |
Ans: The Grinding Fluids Market was valued at USD 690.40 Million in 2023.
Ans: The Grinding Fluids Market is expected to reach USD 954.36 Million by 2032 at a CAGR of 3.67%.
Ans: Industry 4.0 is boosting the Grinding Fluids Market through smart fluid management systems and IoT-enabled monitoring technologies.
Ans: Synthetic grinding fluids hold the largest market share due to their superior lubrication and cooling properties.
Ans: Asia Pacific led the Grinding Fluids Market with 42.7% market share in 2023, driven by China, India, Japan, and South Korea.
Table of Contents:
1. Introduction
1.1 Market Definition
1.2 Scope (Inclusion and Exclusions)
1.3 Research Assumptions
2. Executive Summary
2.1 Market Overview
2.2 Regional Synopsis
2.3 Competitive Summary
3. Research Methodology
3.1 Top-Down Approach
3.2 Bottom-up Approach
3.3. Data Validation
3.4 Primary Interviews
4. Market Dynamics Impact Analysis
4.1 Market Driving Factors Analysis
4.1.2 Drivers
4.1.2 Restraints
4.1.3 Opportunities
4.1.4 Challenges
4.2 PESTLE Analysis
4.3 Porter’s Five Forces Model
5. Statistical Insights and Trends Reporting
5.1 Investment Trends in the Grinding Fluids
5.2 Raw Material Analysis
5.3 Recyclability and Waste Management of Used Grinding Fluids
5.4 GDP and Industrial Growth Correlation with the Grinding Fluids Market
5.5 Sustainability & Bio-Based Alternatives
6. Competitive Landscape
6.1 List of Major Companies, By Region
6.2 Market Share Analysis, By Region
6.3 Product Benchmarking
6.3.1 Product specifications and features
6.3.2 Pricing
6.4 Strategic Initiatives
6.4.1 Marketing and promotional activities
6.4.2 Distribution and supply chain strategies
6.4.3 Expansion plans and new product launches
6.4.4 Strategic partnerships and collaborations
6.5 Technological Advancements
6.6 Market Positioning and Branding
7. Grinding Fluids Market Segmentation, by Type
7.1 Chapter Overview
7.2 Semi-synthetic
7.2.1 Semi-synthetic Market Trends Analysis (2020-2032)
7.2.2 Semi-synthetic Market Size Estimates and Forecasts to 2032 (USD Billion)
7.3 Synthetic
7.3.1 Synthetic Market Trends Analysis (2020-2032)
7.3.2 Synthetic Market Size Estimates and Forecasts to 2032 (USD Billion)
7.4 Water-soluble
7.4.1 Water-soluble Market Trends Analysis (2020-2032)
7.4.2 Water-soluble Market Size Estimates and Forecasts to 2032 (USD Billion)
7.4 Others
7.4.1 Others Market Trends Analysis (2020-2032)
7.4.2 Others Market Size Estimates and Forecasts to 2032 (USD Billion)
8. Grinding Fluids Market Segmentation, by Application
8.1 Chapter Overview
8.2 Disk Drivers
8.2.1 Disk Drivers Market Trends Analysis (2020-2032)
8.2.2 Disk Drivers Market Size Estimates and Forecasts to 2032 (USD Billion)
8.3 Lubricate Machine Tools
8.3.1 Lubricate Machine Tools Market Trends Analysis (2020-2032)
8.3.2 Lubricate Machine Tools Market Size Estimates and Forecasts to 2032 (USD Billion)
8.4 Metal Substrates
8.4.1 Metal Substrates Market Trends Analysis (2020-2032)
8.4.2 Metal Substrates Market Size Estimates and Forecasts to 2032 (USD Billion)
8.5 Silicon Wafer
8.5.1 Silicon Wafer Market Trends Analysis (2020-2032)
8.5.2 Silicon Wafer Market Size Estimates and Forecasts to 2032 (USD Billion)
8.6 Others
8.6.1 Others Market Trends Analysis (2020-2032)
8.6.2 Others Market Size Estimates and Forecasts to 2032 (USD Billion)
9. Regional Analysis
9.1 Chapter Overview
9.2 North America
9.2.1 Trends Analysis
9.2.2 North America Grinding Fluids Market Estimates and Forecasts, by Country (2020-2032) (USD Billion)
9.2.3 North America Grinding Fluids Market Estimates and Forecasts, by Type (2020-2032) (USD Billion)
9.2.4 North America Grinding Fluids Market Estimates and Forecasts, by Application (2020-2032) (USD Billion)
9.2.5 USA
9.2.5.1 USA Grinding Fluids Market Estimates and Forecasts, by Type (2020-2032) (USD Billion)
9.2.5.2 USA Grinding Fluids Market Estimates and Forecasts, by Application (2020-2032) (USD Billion)
9.2.6 Canada
9.2.6.1 Canada Grinding Fluids Market Estimates and Forecasts, by Type (2020-2032) (USD Billion)
9.2.6.2 Canada Grinding Fluids Market Estimates and Forecasts, by Application (2020-2032) (USD Billion)
9.2.7 Mexico
9.2.7.1 Mexico Grinding Fluids Market Estimates and Forecasts, by Type (2020-2032) (USD Billion)
9.2.7.2 Mexico Grinding Fluids Market Estimates and Forecasts, by Application (2020-2032) (USD Billion)
9.3 Europe
9.3.1 Eastern Europe
9.3.1.1 Trends Analysis
9.3.1.2 Eastern Europe Grinding Fluids Market Estimates and Forecasts, by Country (2020-2032) (USD Billion)
9.3.1.3 Eastern Europe Grinding Fluids Market Estimates and Forecasts, by Type (2020-2032) (USD Billion)
9.3.1.4 Eastern Europe Grinding Fluids Market Estimates and Forecasts, by Application (2020-2032) (USD Billion)
9.3.1.5 Poland
9.3.1.5.1 Poland Grinding Fluids Market Estimates and Forecasts, by Type (2020-2032) (USD Billion)
9.3.1.5.2 Poland Grinding Fluids Market Estimates and Forecasts, by Application (2020-2032) (USD Billion)
9.3.1.6 Romania
9.3.1.6.1 Romania Grinding Fluids Market Estimates and Forecasts, by Type (2020-2032) (USD Billion)
9.3.1.6.2 Romania Grinding Fluids Market Estimates and Forecasts, by Application (2020-2032) (USD Billion)
9.3.1.7 Hungary
9.3.1.7.1 Hungary Grinding Fluids Market Estimates and Forecasts, by Type (2020-2032) (USD Billion)
9.3.1.7.2 Hungary Grinding Fluids Market Estimates and Forecasts, by Application (2020-2032) (USD Billion)
9.3.1.8 Turkey
9.3.1.8.1 Turkey Grinding Fluids Market Estimates and Forecasts, by Type (2020-2032) (USD Billion)
9.3.1.8.2 Turkey Grinding Fluids Market Estimates and Forecasts, by Application (2020-2032) (USD Billion)
9.3.1.9 Rest of Eastern Europe
9.3.1.9.1 Rest of Eastern Europe Grinding Fluids Market Estimates and Forecasts, by Type (2020-2032) (USD Billion)
9.3.1.9.2 Rest of Eastern Europe Grinding Fluids Market Estimates and Forecasts, by Application (2020-2032) (USD Billion)
9.3.2 Western Europe
9.3.2.1 Trends Analysis
9.3.2.2 Western Europe Grinding Fluids Market Estimates and Forecasts, by Country (2020-2032) (USD Billion)
9.3.2.3 Western Europe Grinding Fluids Market Estimates and Forecasts, by Type (2020-2032) (USD Billion)
9.3.2.4 Western Europe Grinding Fluids Market Estimates and Forecasts, by Application (2020-2032) (USD Billion)
9.3.2.5 Germany
9.3.2.5.1 Germany Grinding Fluids Market Estimates and Forecasts, by Type (2020-2032) (USD Billion)
9.3.2.5.2 Germany Grinding Fluids Market Estimates and Forecasts, by Application (2020-2032) (USD Billion)
9.3.2.6 France
9.3.2.6.1 France Grinding Fluids Market Estimates and Forecasts, by Type (2020-2032) (USD Billion)
9.3.2.6.2 France Grinding Fluids Market Estimates and Forecasts, by Application (2020-2032) (USD Billion)
9.3.2.7 UK
9.3.2.7.1 UK Grinding Fluids Market Estimates and Forecasts, by Type (2020-2032) (USD Billion)
9.3.2.7.2 UK Grinding Fluids Market Estimates and Forecasts, by Application (2020-2032) (USD Billion)
9.3.2.8 Italy
9.3.2.8.1 Italy Grinding Fluids Market Estimates and Forecasts, by Type (2020-2032) (USD Billion)
9.3.2.8.2 Italy Grinding Fluids Market Estimates and Forecasts, by Application (2020-2032) (USD Billion)
9.3.2.9 Spain
9.3.2.9.1 Spain Grinding Fluids Market Estimates and Forecasts, by Type (2020-2032) (USD Billion)
9.3.2.9.2 Spain Grinding Fluids Market Estimates and Forecasts, by Application (2020-2032) (USD Billion)
9.3.2.10 Netherlands
9.3.2.10.1 Netherlands Grinding Fluids Market Estimates and Forecasts, by Type (2020-2032) (USD Billion)
9.3.2.10.2 Netherlands Grinding Fluids Market Estimates and Forecasts, by Application (2020-2032) (USD Billion)
9.3.2.11 Switzerland
9.3.2.11.1 Switzerland Grinding Fluids Market Estimates and Forecasts, by Type (2020-2032) (USD Billion)
9.3.2.11.2 Switzerland Grinding Fluids Market Estimates and Forecasts, by Application (2020-2032) (USD Billion)
9.3.2.12 Austria
9.3.2.12.1 Austria Grinding Fluids Market Estimates and Forecasts, by Type (2020-2032) (USD Billion)
9.3.2.12.2 Austria Grinding Fluids Market Estimates and Forecasts, by Application (2020-2032) (USD Billion)
9.3.2.13 Rest of Western Europe
9.3.2.13.1 Rest of Western Europe Grinding Fluids Market Estimates and Forecasts, by Type (2020-2032) (USD Billion)
9.3.2.13.2 Rest of Western Europe Grinding Fluids Market Estimates and Forecasts, by Application (2020-2032) (USD Billion)
9.4 Asia Pacific
9.4.1 Trends Analysis
9.4.2 Asia Pacific Grinding Fluids Market Estimates and Forecasts, by Country (2020-2032) (USD Billion)
9.4.3 Asia Pacific Grinding Fluids Market Estimates and Forecasts, by Type (2020-2032) (USD Billion)
9.4.4 Asia Pacific Grinding Fluids Market Estimates and Forecasts, by Application (2020-2032) (USD Billion)
9.4.5 China
9.4.5.1 China Grinding Fluids Market Estimates and Forecasts, by Type (2020-2032) (USD Billion)
9.4.5.2 China Grinding Fluids Market Estimates and Forecasts, by Application (2020-2032) (USD Billion)
9.4.6 India
9.4.5.1 India Grinding Fluids Market Estimates and Forecasts, by Type (2020-2032) (USD Billion)
9.4.5.2 India Grinding Fluids Market Estimates and Forecasts, by Application (2020-2032) (USD Billion)
9.4.5 Japan
9.4.5.1 Japan Grinding Fluids Market Estimates and Forecasts, by Type (2020-2032) (USD Billion)
9.4.5.2 Japan Grinding Fluids Market Estimates and Forecasts, by Application (2020-2032) (USD Billion)
9.4.6 South Korea
9.4.6.1 South Korea Grinding Fluids Market Estimates and Forecasts, by Type (2020-2032) (USD Billion)
9.4.6.2 South Korea Grinding Fluids Market Estimates and Forecasts, by Application (2020-2032) (USD Billion)
9.4.7 Vietnam
9.4.7.1 Vietnam Grinding Fluids Market Estimates and Forecasts, by Type (2020-2032) (USD Billion)
9.2.7.2 Vietnam Grinding Fluids Market Estimates and Forecasts, by Application (2020-2032) (USD Billion)
9.4.8 Singapore
9.4.8.1 Singapore Grinding Fluids Market Estimates and Forecasts, by Type (2020-2032) (USD Billion)
9.4.8.2 Singapore Grinding Fluids Market Estimates and Forecasts, by Application (2020-2032) (USD Billion)
9.4.9 Australia
9.4.9.1 Australia Grinding Fluids Market Estimates and Forecasts, by Type (2020-2032) (USD Billion)
9.4.9.2 Australia Grinding Fluids Market Estimates and Forecasts, by Application (2020-2032) (USD Billion)
9.4.10 Rest of Asia Pacific
9.4.10.1 Rest of Asia Pacific Grinding Fluids Market Estimates and Forecasts, by Type (2020-2032) (USD Billion)
9.4.10.2 Rest of Asia Pacific Grinding Fluids Market Estimates and Forecasts, by Application (2020-2032) (USD Billion)
9.5 Middle East and Africa
9.5.1 Middle East
9.5.1.1 Trends Analysis
9.5.1.2 Middle East Grinding Fluids Market Estimates and Forecasts, by Country (2020-2032) (USD Billion)
9.5.1.3 Middle East Grinding Fluids Market Estimates and Forecasts, by Type (2020-2032) (USD Billion)
9.5.1.4 Middle East Grinding Fluids Market Estimates and Forecasts, by Application (2020-2032) (USD Billion)
9.5.1.5 UAE
9.5.1.5.1 UAE Grinding Fluids Market Estimates and Forecasts, by Type (2020-2032) (USD Billion)
9.5.1.5.2 UAE Grinding Fluids Market Estimates and Forecasts, by Application (2020-2032) (USD Billion)
9.5.1.6 Egypt
9.5.1.6.1 Egypt Grinding Fluids Market Estimates and Forecasts, by Type (2020-2032) (USD Billion)
9.5.1.6.2 Egypt Grinding Fluids Market Estimates and Forecasts, by Application (2020-2032) (USD Billion)
9.5.1.7 Saudi Arabia
9.5.1.7.1 Saudi Arabia Grinding Fluids Market Estimates and Forecasts, by Type (2020-2032) (USD Billion)
9.5.1.7.2 Saudi Arabia Grinding Fluids Market Estimates and Forecasts, by Application (2020-2032) (USD Billion)
9.5.1.8 Qatar
9.5.1.8.1 Qatar Grinding Fluids Market Estimates and Forecasts, by Type (2020-2032) (USD Billion)
9.5.1.8.2 Qatar Grinding Fluids Market Estimates and Forecasts, by Application (2020-2032) (USD Billion)
9.5.1.9 Rest of Middle East
9.5.1.9.1 Rest of Middle East Grinding Fluids Market Estimates and Forecasts, by Type (2020-2032) (USD Billion)
9.5.1.9.2 Rest of Middle East Grinding Fluids Market Estimates and Forecasts, by Application (2020-2032) (USD Billion)
9.5.2 Africa
9.5.2.1 Trends Analysis
9.5.2.2 Africa Grinding Fluids Market Estimates and Forecasts, by Country (2020-2032) (USD Billion)
9.5.2.3 Africa Grinding Fluids Market Estimates and Forecasts, by Type (2020-2032) (USD Billion)
9.5.2.4 Africa Grinding Fluids Market Estimates and Forecasts, by Application (2020-2032) (USD Billion)
9.5.2.5 South Africa
9.5.2.5.1 South Africa Grinding Fluids Market Estimates and Forecasts, by Type (2020-2032) (USD Billion)
9.5.2.5.2 South Africa Grinding Fluids Market Estimates and Forecasts, by Application (2020-2032) (USD Billion)
9.5.2.6 Nigeria
9.5.2.6.1 Nigeria Grinding Fluids Market Estimates and Forecasts, by Type (2020-2032) (USD Billion)
9.5.2.6.2 Nigeria Grinding Fluids Market Estimates and Forecasts, by Application (2020-2032) (USD Billion)
9.5.2.7 Rest of Africa
9.5.2.7.1 Rest of Africa Grinding Fluids Market Estimates and Forecasts, by Type (2020-2032) (USD Billion)
9.5.2.7.2 Rest of Africa Grinding Fluids Market Estimates and Forecasts, by Application (2020-2032) (USD Billion)
9.6 Latin America
9.6.1 Trends Analysis
9.6.2 Latin America Grinding Fluids Market Estimates and Forecasts, by Country (2020-2032) (USD Billion)
9.6.3 Latin America Grinding Fluids Market Estimates and Forecasts, by Type (2020-2032) (USD Billion)
9.6.4 Latin America Grinding Fluids Market Estimates and Forecasts, by Application (2020-2032) (USD Billion)
9.6.5 Brazil
9.6.5.1 Brazil Grinding Fluids Market Estimates and Forecasts, by Type (2020-2032) (USD Billion)
9.6.5.2 Brazil Grinding Fluids Market Estimates and Forecasts, by Application (2020-2032) (USD Billion)
9.6.6 Argentina
9.6.6.1 Argentina Grinding Fluids Market Estimates and Forecasts, by Type (2020-2032) (USD Billion)
9.6.6.2 Argentina Grinding Fluids Market Estimates and Forecasts, by Application (2020-2032) (USD Billion)
9.6.7 Colombia
9.6.7.1 Colombia Grinding Fluids Market Estimates and Forecasts, by Type (2020-2032) (USD Billion)
9.6.7.2 Colombia Grinding Fluids Market Estimates and Forecasts, by Application (2020-2032) (USD Billion)
9.6.8 Rest of Latin America
9.6.8.1 Rest of Latin America Grinding Fluids Market Estimates and Forecasts, by Type (2020-2032) (USD Billion)
9.6.8.2 Rest of Latin America Grinding Fluids Market Estimates and Forecasts, by Application (2020-2032) (USD Billion)
10. Company Profiles
10.1 ExxonMobil Corporation
10.1.1 Company Overview
10.1.2 Financial
10.1.3 Products/ Services Offered
10.1.4 SWOT Analysis
10.2 TotalEnergies SE
10.2.1 Company Overview
10.2.2 Financial
10.2.3 Products/ Services Offered
10.2.4 SWOT Analysis
10.3 FUCHS Petrolub SE
10.3.1 Company Overview
10.3.2 Financial
10.3.3 Products/ Services Offered
10.3.4 SWOT Analysis
10.4 Castrol Ltd. (BP P.L.C.)
10.4.1 Company Overview
10.4.2 Financial
10.4.3 Products/ Services Offered
10.4.4 SWOT Analysis
10.5 oelheld GmbH
10.5.1 Company Overview
10.5.2 Financial
10.5.3 Products/ Services Offered
10.5.4 SWOT Analysis
10.6 ETNA Products, Inc.
10.6.1 Company Overview
10.6.2 Financial
10.6.3 Products/ Services Offered
10.6.4 SWOT Analysis
10.7 Benz Oil, Inc. (AMSOIL INC.)
10.7.1 Company Overview
10.7.2 Financial
10.7.3 Products/ Services Offered
10.7.4 SWOT Analysis
10.8 Lincoln Chemical Corporation
10.8.1 Company Overview
10.8.2 Financial
10.8.3 Products/ Services Offered
10.8.4 SWOT Analysis
10.9 EnviroServe Chemicals, Inc.
10.9.1 Company Overview
10.9.2 Financial
10.9.3 Products/ Services Offered
10.9.4 SWOT Analysis
10.10 CGF, Inc. (Cutting & Grinding Fluids, Inc.)
10.10.1 Company Overview
10.10.2 Financial
10.10.3 Products/ Services Offered
10.10.4 SWOT Analysis
11. Use Cases and Best Practices
12. Conclusion
An accurate research report requires proper strategizing as well as implementation. There are multiple factors involved in the completion of good and accurate research report and selecting the best methodology to compete the research is the toughest part. Since the research reports we provide play a crucial role in any company’s decision-making process, therefore we at SNS Insider always believe that we should choose the best method which gives us results closer to reality. This allows us to reach at a stage wherein we can provide our clients best and accurate investment to output ratio.
Each report that we prepare takes a timeframe of 350-400 business hours for production. Starting from the selection of titles through a couple of in-depth brain storming session to the final QC process before uploading our titles on our website we dedicate around 350 working hours. The titles are selected based on their current market cap and the foreseen CAGR and growth.
The 5 steps process:
Step 1: Secondary Research:
Secondary Research or Desk Research is as the name suggests is a research process wherein, we collect data through the readily available information. In this process we use various paid and unpaid databases which our team has access to and gather data through the same. This includes examining of listed companies’ annual reports, Journals, SEC filling etc. Apart from this our team has access to various associations across the globe across different industries. Lastly, we have exchange relationships with various university as well as individual libraries.
Step 2: Primary Research
When we talk about primary research, it is a type of study in which the researchers collect relevant data samples directly, rather than relying on previously collected data. This type of research is focused on gaining content specific facts that can be sued to solve specific problems. Since the collected data is fresh and first hand therefore it makes the study more accurate and genuine.
We at SNS Insider have divided Primary Research into 2 parts.
Part 1 wherein we interview the KOLs of major players as well as the upcoming ones across various geographic regions. This allows us to have their view over the market scenario and acts as an important tool to come closer to the accurate market numbers. As many as 45 paid and unpaid primary interviews are taken from both the demand and supply side of the industry to make sure we land at an accurate judgement and analysis of the market.
This step involves the triangulation of data wherein our team analyses the interview transcripts, online survey responses and observation of on filed participants. The below mentioned chart should give a better understanding of the part 1 of the primary interview.
Part 2: In this part of primary research the data collected via secondary research and the part 1 of the primary research is validated with the interviews from individual consultants and subject matter experts.
Consultants are those set of people who have at least 12 years of experience and expertise within the industry whereas Subject Matter Experts are those with at least 15 years of experience behind their back within the same space. The data with the help of two main processes i.e., FGDs (Focused Group Discussions) and IDs (Individual Discussions). This gives us a 3rd party nonbiased primary view of the market scenario making it a more dependable one while collation of the data pointers.
Step 3: Data Bank Validation
Once all the information is collected via primary and secondary sources, we run that information for data validation. At our intelligence centre our research heads track a lot of information related to the market which includes the quarterly reports, the daily stock prices, and other relevant information. Our data bank server gets updated every fortnight and that is how the information which we collected using our primary and secondary information is revalidated in real time.
Step 4: QA/QC Process
After all the data collection and validation our team does a final level of quality check and quality assurance to get rid of any unwanted or undesired mistakes. This might include but not limited to getting rid of the any typos, duplication of numbers or missing of any important information. The people involved in this process include technical content writers, research heads and graphics people. Once this process is completed the title gets uploader on our platform for our clients to read it.
Step 5: Final QC/QA Process:
This is the last process and comes when the client has ordered the study. In this process a final QA/QC is done before the study is emailed to the client. Since we believe in giving our clients a good experience of our research studies, therefore, to make sure that we do not lack at our end in any way humanly possible we do a final round of quality check and then dispatch the study to the client.
Key Segments:
By Type
Semi-synthetic
Synthetic
Water-soluble
Others
By Application
Disk Drivers
Lubricate Machine Tools
Metal Substrates
Silicon Wafer
Others
Request for Segment Customization as per your Business Requirement: Segment Customization Request
Regional Coverage:
North America
US
Canada
Mexico
Europe
Eastern Europe
Poland
Romania
Hungary
Turkey
Rest of Eastern Europe
Western Europe
Germany
France
UK
Italy
Spain
Netherlands
Switzerland
Austria
Rest of Western Europe
Asia Pacific
China
India
Japan
South Korea
Vietnam
Singapore
Australia
Rest of Asia Pacific
Middle East & Africa
Middle East
UAE
Egypt
Saudi Arabia
Qatar
Rest of Middle East
Africa
Nigeria
South Africa
Rest of Africa
Latin America
Brazil
Argentina
Colombia
Rest of Latin America
Request for Country Level Research Report: Country Level Customization Request
Available Customization
With the given market data, SNS Insider offers customization as per the company’s specific needs. The following customization options are available for the report:
Detailed Volume Analysis
Criss-Cross segment analysis (e.g. Product X Application)
Competitive Product Benchmarking
Geographic Analysis
Additional countries in any of the regions
Customized Data Representation
Detailed analysis and profiling of additional market players
The Green Fertilizer Market Size was valued at USD 2.15 billion in 2023, and is expected to reach USD 3.53 billion by 2032, and grow at a CAGR of 5.65% over the forecast period 2024-2032.
Wood Pellets Market size was USD 10.6 billion in 2023 and is expected to reach USD 20.5 billion by 2032, growing at a CAGR of 7.5% from 2024 to 2032.
Flat Steel Market was USD 548.17 billion in 2023 and is expected to reach USD 903.23 billion by 2032, growing at a CAGR of 5.71% from 2024 to 2032.
The Antimicrobial Textile Market size was USD 12.28 billion in 2023. It is expected to reach USD 21.27 Bn by 2032 and grow at a CAGR of 6.3% by 2024-2032.
The Core Material Market Size was valued at USD 1.80 Billion in 2023 and is expected to reach USD 4.66 Billion by 2032, growing at a CAGR of 11.15% over the forecast period of 2024-2032.
The Paints and Coatings Market size was USD 186.74 billion in 2023 & is expected to reach USD 254.51 Bn by 2032 & grow at a CAGR of 3.50% by 2024-2032.
Hi! Click one of our member below to chat on Phone