Iron Ore Market Report Scope & Overview:
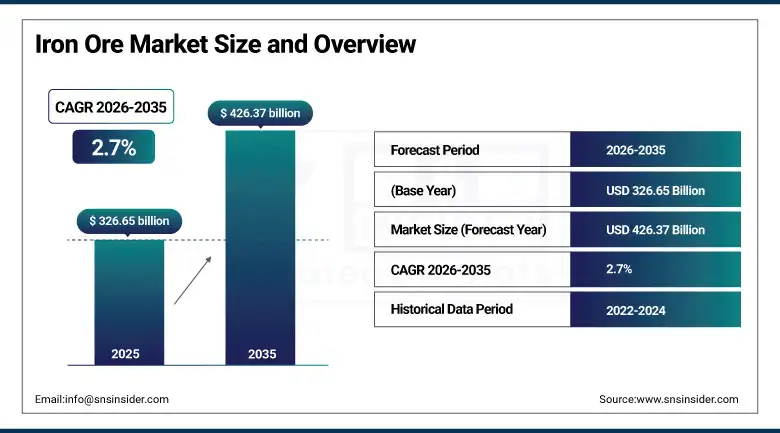
Iron Ore Market was valued at USD 326.65 billion in 2025 and is expected to reach USD 426.37 billion by 2035, growing at a CAGR of 2.7% from 2026–2035.
The iron ore commodity market is the fundamental source material underpinning the worldwide production of steel, as iron ore continues to be the basic input material in excess of 98% of all steel made worldwide using either the blast furnace process or direct reduction process, whereby iron ores are smelted to create molten iron and steel used to construct buildings, build automobiles, ships, machinery, and civil engineering infrastructure. Iron ore is sourced from mines in deposits of hematite and magnetite ore in countries such as Australia, Brazil, China, and India, among others, and processed into various grades of iron ore including fines, pellets, and concentrates, which are then sold on global commodity markets at prices dependent upon the dynamics of steel production demand in China and iron ore supply in Australia and Brazil, combined with the logistical cost of ocean freight transport and the premium pricing of higher grade iron ore. The market is supported by two structural demand pillars: the continued urbanisation and industrialisation of emerging economies requiring steel-intensive construction, infrastructure, and manufacturing investment that sustains baseline iron ore demand growth; and the growing requirement for high-grade iron ore in the direct reduced iron and electric arc furnace steelmaking routes that produce lower-carbon steel through hydrogen or natural gas reduction, which require higher-grade iron ore feed materials than conventional blast furnace operations.
January 2025 saw iron ore prices reach a four-week high as reduced Australian and Brazilian shipments combined with a weaker U.S. dollar and strong Chinese demand signals created one of the most commercially consequential short-term iron ore market events of the period, while BHP reported notable production increases and technology-driven efficiency improvements at its Pilbara operations in the same month, confirming that the market's two largest producing companies continue investing in supply capacity and cost reduction to maintain competitive positions through the forecast period.
Market Size and Forecast
-
Market Size in 2026E: USD 335.47 Billion
-
Market Size by 2035: USD 426.37 Billion
-
Growth Rate (2026–2035): 2.7% CAGR
-
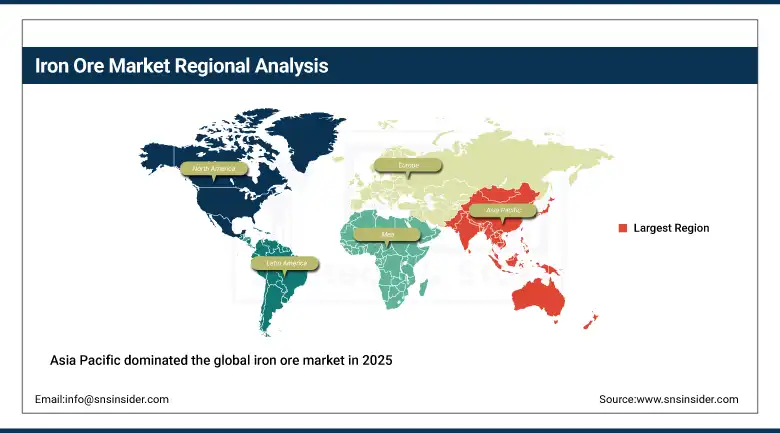
Fastest Growing Market: Asia Pacific
-
Largest Market: Asia Pacific
To Get more information On Iron Ore Market - Request Free Sample Report
Iron Ore Market Trends
-
Growing demand for high-grade iron ore products with greater than 65% iron content for direct reduction and electric arc furnace steelmaking routes that produce lower-carbon steel, commanding significant price premiums over standard blast furnace grade materials and reshaping the global quality mix of iron ore traded on international commodity markets.
-
Accelerating digitalisation and automation of iron ore mining operations, with major producers deploying autonomous haul trucks, remote drilling systems, AI-powered ore grade prediction, and digital mine control platforms that improve operational safety, reduce labour costs, and increase production efficiency across large-scale open-pit mining operations.
-
Rising focus on the carbon footprint of iron ore processing, where producers are investing in renewable energy for mine operations, ore beneficiation energy efficiency improvements, and exploration of low-emission transport options for iron ore export to decarbonise the supply chain at a time when steel customer industries face their own decarbonisation obligations.
-
Expanding iron ore pellet production capacity to serve the growing direct reduced iron market, where premium pellet products provide the high-grade, low-impurity iron oxide feed that hydrogen-based direct reduction requires for the green steel production pathways being developed by major steel producers in Europe, the Middle East, and North America.
-
Expanding exploration and mining activities of inexpensive yet high-grade deposits in the growing areas to compensate for falling grades in the developed areas. Thus helping maintain supply sustainability along with expanding steel industry globally due to growing demands.
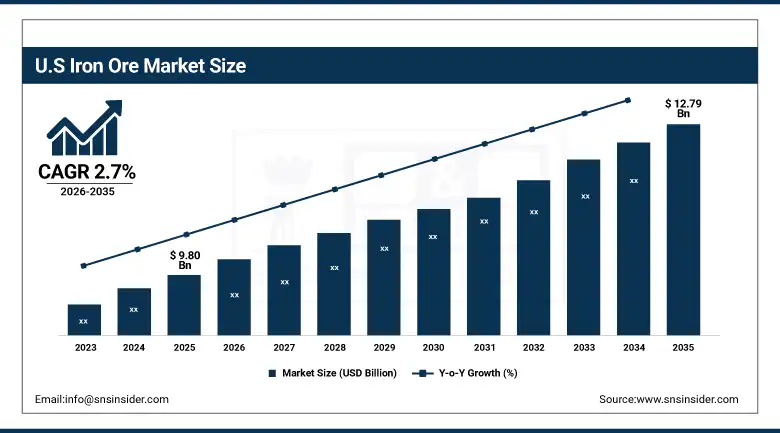
The U.S. Iron Ore Market Size Outlook
The U.S. Iron Ore Market was valued at approximately USD 9.80 billion in 2025 and is expected to reach approximately USD 12.79 billion by 2035, growing at a CAGR of 2.7% during 2026–2035.
The United States maintains a modest but strategically significant domestic iron ore production capacity concentrated in the Lake Superior iron ore district of Minnesota and Michigan, where Cleveland-Cliffs Inc. operates the primary domestic iron ore mining and pellet production operations supplying the integrated blast furnace and electric arc furnace steel mills of the Great Lakes industrial region. U.S. domestic iron ore production provides a measure of supply chain security for the domestic steel industry that reduces dependence on imported iron ore, while Cleveland-Cliffs' vertical integration from mining through steelmaking creates a commercially distinctive business model in the North American iron ore landscape. The Inflation Reduction Act's domestic steel content requirements for infrastructure projects and the CHIPS Act's semiconductor facility construction creating steel demand represent U.S. policy initiatives sustaining domestic iron ore and steel market demand through the forecast period.
January 2025's Ukrainian seaport handling of 18.5 million tonnes of iron ore through crucial Black Sea shipping routes demonstrated the continued significance of Eastern European iron ore logistics even amid regional geopolitical pressures, while the global iron ore market's price recovery driven by Chinese demand signals confirmed that the world's largest steel producer remains the dominant short-term price setter in international iron ore markets.
Iron Ore Market Segment Analysis
-
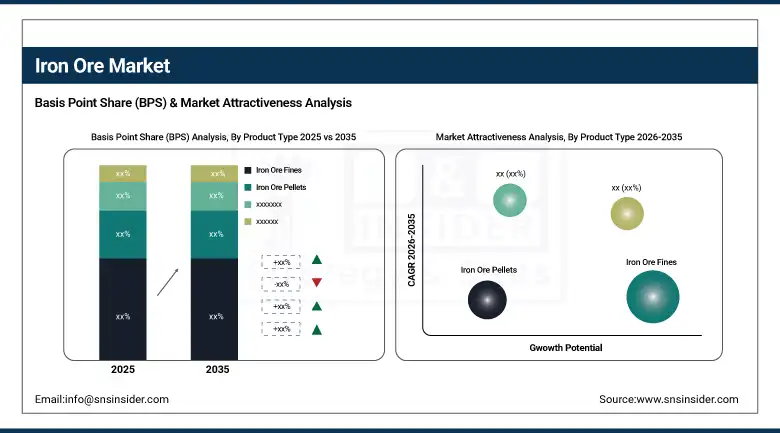
By Product Type, iron ore fines dominated as the largest product type; iron ore pellets are the fastest-growing product type.
-
In terms of grade, high grade iron ore dominated; medium grade remains the largest volume category.
-
By Application, steel production dominated; direct reduced iron is the fastest-growing application.
-
By End-User, construction dominated; automotive and transportation is a growing end-user.
By Product Type, iron ore fines dominate, pellets are expected to grow fastest
Iron ore fines retained the dominant product type position in the iron ore market in 2025, reflecting their status as the primary output form of iron ore mining operations where run-of-mine ore is crushed and screened to produce fine-grained mineral fractions below 6.3 millimetres that are sintered in agglomeration plants before charging into blast furnaces for iron production. Fines dominate global iron ore trade volumes because the majority of the world's iron ore reserves exist in deposit types where fine-grained ore liberation is technically and economically unavoidable, and the sintering process has been optimised over decades to efficiently convert fine iron ore into the strong, permeable sinter burden that blast furnace operations require. Australia's Pilbara iron ore operations and Brazil's Carajas iron ore system both predominantly produce fine-grained products that constitute the bulk of global seaborne iron ore trade.
Iron ore pellets are the fastest-growing product type through 2035, driven by the extraordinary commercial importance of high-grade, consistent pellet products for the direct reduction ironmaking installations that are the foundation of the global steel industry's decarbonisation pathway. Direct reduced iron production using hydrogen or natural gas requires premium iron ore pellets with greater than 67% iron content, very low silica, alumina, and phosphorus impurities, and controlled physical size and strength characteristics that blast furnace-grade fines and lump products cannot provide. The rapidly growing pipeline of hydrogen-based direct reduction steelmaking projects in Europe, the Middle East, and North America is creating structural demand growth for high-grade pellets that is expected to sustain the product segment's fastest-growth trajectory through the forecast period.
By Application, steel production dominates, direct reduced iron is expected to grow fastest
Steel production retained the dominant application position with approximately 98% of iron ore market volumes and revenues, reflecting the absolute commercial and physical necessity of iron ore as the primary input material for the integrated steelmaking processes that produce over 1.8 billion tonnes of crude steel annually for the construction, automotive, manufacturing, packaging, and energy infrastructure industries that define modern industrial economies. The blast furnace-basic oxygen furnace steelmaking route, where iron ore is reduced to pig iron through coke combustion in the blast furnace before conversion to steel in the basic oxygen furnace, consumed the majority of global iron ore production and will continue to dominate iron ore demand through the forecast period despite progressive market share loss to direct reduction-electric arc furnace steelmaking as decarbonisation proceeds.
Direct reduced iron is the fastest-growing application through 2035, driven by the global steel industry's commitment to decarbonising its production processes through hydrogen and natural gas-based direct reduction that avoids the carbon-intensive coke combustion chemistry of conventional blast furnace ironmaking. Direct reduced iron sponge produced by solid-state reduction of high-grade iron ore pellets with reducing gas provides the metallic iron input for electric arc furnace steelmaking that can operate with zero fossil fuel combustion when powered by renewable electricity, constituting the primary commercial pathway for green steel production at industrial scale.
Regional Analysis
|
Region |
Major Country |
Share within Region, 2025 (%) |
|---|---|---|
|
Asia Pacific |
China |
68% |
|
North America |
United States |
72% |
|
Europe |
Germany |
29% |
|
Middle East & Africa |
South Africa |
27% |
|
Latin America |
Brazil |
58% |
North America Iron Ore Market Insights
North America is a modest iron ore producing region led by the United States through Cleveland-Cliffs' Minnesota and Michigan operations, supplemented by Canada's iron ore production in Quebec and Labrador through the Iron Ore Company of Canada and various junior producers. The U.S. domestic iron ore market benefits from the strategic importance of maintaining domestic supply chain capability for the Great Lakes integrated steel mills, supported by federal infrastructure and manufacturing investment programmes creating sustained domestic steel demand.
Get Customized Report as per Your Business Requirement - Enquiry Now
Europe Iron Ore Market Insights
Europe is a significant iron ore consuming region led by Germany, France, and Sweden's steel industries, with domestically produced iron ore from LKAB in Sweden representing the primary European iron ore supply source and Russia historically providing additional supply to Eastern European markets. European iron ore consumption is being reshaped by the transition toward hydrogen-based direct reduction steelmaking by ArcelorMittal, SSAB, and thyssenkrupp that requires premium high-grade iron ore pellets, creating a quality upgrade across European iron ore procurement specifications.
Asia Pacific Iron Ore Market Insights
Asia Pacific dominated the global iron ore market in 2025 and is simultaneously the fastest-growing region, driven by China's status as the world's largest steel producer consuming approximately 60% of global iron ore imports and Australia's position as the world's largest iron ore exporting nation through the Pilbara operations of BHP, Rio Tinto, and Fortescue. China's steel production at approximately 1 billion tonnes annually and India's rapidly growing steel industry consuming growing volumes of both domestically produced and imported iron ore collectively make Asia Pacific the uncontested centre of global iron ore demand. Japan and South Korea's steel industries remain significant iron ore importers contributing to Asia Pacific's market dominance.
Latin America and MEA Iron Ore Market Insights
Latin America is a major iron ore producing region led by Brazil through Vale's enormous Carajas iron ore system and Simandou development investment in Guinea representing the most significant new iron ore supply development globally. MEA iron ore production includes significant South African production through Kumba Iron Ore and growing African iron ore project development as West African deposits in Guinea, Sierra Leone, and Liberia attract major mining company investment.
Market Dynamics
Growth Drivers: Steel demand from emerging market construction and infrastructure investment drives iron ore consumption baseline growth
The primary structural growth driver for the iron ore market is the continuing industrialisation and urbanisation of emerging economies across South Asia, Southeast Asia, Africa, and Latin America that creates sustained steel demand through building construction, road and rail infrastructure, power generation, and manufacturing facility investment that directly drives iron ore consumption proportional to steel production volumes. India's National Infrastructure Pipeline, Southeast Asian manufacturing investment attraction, and Sub-Saharan African infrastructure development collectively represent the most significant sources of steel demand growth that sustain the iron ore market's consistent 2.7% CAGR through the forecast period.
BHP's January 2025 report of notable production increases and technology-driven efficiency improvements at its Pilbara operations, combined with the Australian government's continued investment in iron ore export infrastructure and environmental performance improvement, confirm that the world's leading iron ore producing region is simultaneously expanding supply capacity and improving sustainability credentials to maintain competitive supply to Asian and global steel markets through the 2026 to 2035 forecast period.
Restraints: Chinese steel sector structural challenges, green steel transition reducing blast furnace demand, and commodity price volatility
A significant restraint on the iron ore market is the structural challenges facing China's steel sector, where overcapacity, declining domestic construction investment as the property sector moderates, and government-mandated production cuts for environmental compliance create periods of reduced iron ore demand that depress international iron ore prices and revenue for producing companies. The progressive transition of global steelmaking toward electric arc furnace and hydrogen-based direct reduction routes that require less iron ore per tonne of steel or require different quality grades than conventional blast furnace operations is a long-term structural challenge for conventional iron ore producers specialised in blast furnace grade fines supply.
Opportunities: High-grade pellet demand for green steel, iron ore beneficiation investment, and african supply development
The green steel transition creating structural demand growth for high-grade, low-impurity iron ore pellets for hydrogen-based direct reduction represents the most commercially significant near-term opportunity for iron ore producers capable of upgrading mine output quality to meet direct reduction grade specifications. Iron ore beneficiation investment, where producers upgrade medium and lower-grade deposits through magnetic separation, flotation, and advanced processing to produce high-grade concentrates meeting pellet feed specifications, enables expansion of the addressable iron ore market for deposits that would not meet quality thresholds without processing. African iron ore supply development, particularly Guinea's Simandou project representing the world's largest untapped high-grade iron ore deposit, represents a transformative new supply source that could reshape global iron ore trade flows.
Recent Developments:
-
2026: Vale S.A. has expanded its high-grade iron ore output strategy in 2026, increasing beneficiation capacity to support low-carbon steel demand and strengthen supply to direct reduction-based steelmakers.
-
2026: BHP Group Ltd. has accelerated automation rollout across Pilbara operations, deploying AI-driven ore grade control systems and autonomous haulage expansion to improve efficiency and reduce operational emissions.
-
2026: Rio Tinto plc has advanced its Simandou project integration strategy in 2026, focusing on high-grade iron ore exports aimed at decarbonised steel production markets in Europe and Asia.
Iron Ore key players are:
-
Vale SA
-
BHP Group Ltd.
-
Rio Tinto plc
-
Fortescue Metals Group Ltd.
-
Anglo American plc
-
ArcelorMittal SA
-
Cleveland-Cliffs Inc.
-
Kumba Iron Ore Ltd. (Anglo American)
-
Ansteel Group Corporation Ltd.
-
HBIS Group Co. Ltd.
-
Metalloinvest Management LLC
-
LKAB (Luossavaara-Kiirunavaara AB)
-
Iron Ore Company of Canada
-
Evraz plc
-
Severstal PJSC
-
Ferrexpo plc
-
NMDC Ltd.
-
Champion Iron Ltd.
-
Labrador Iron Ore Royalty Corporation
-
Mount Gibson Iron Ltd.
Iron Ore Market Report Scope:
| Report Attributes | Details |
|---|---|
| Market Size in 2025 | USD 326.65 Billion |
| Market Size by 2035 | USD 426.37 Billion |
| CAGR | CAGR of 2.7% From 2026 to 2035 |
| Base Year | 2025 |
| Forecast Period | 2026-2035 |
| Historical Data | 2022-2024 |
| Report Scope & Coverage | Market Size, Segments Analysis, Competitive Landscape, Regional Analysis, DROC & SWOT Analysis, Forecast Outlook |
| Key Segments | • By Product Type (Iron Ore Fines, Iron Ore Pellets, Iron Ore Lump, Others) • By Grade (High Grade, Medium Grade, Low Grade) • By Application (Steel Production, Pig Iron Production, Direct Reduced Iron, Others) • By End-User (Construction, Automotive and Transportation, Shipbuilding, Machinery and Equipment, Others) |
| Regional Analysis/Coverage | North America (US, Canada), Europe (Germany, UK, France, Italy, Spain, Russia, Poland, Rest of Europe), Asia Pacific (China, India, Japan, South Korea, Australia, ASEAN Countries, Rest of Asia Pacific), Middle East & Africa (UAE, Saudi Arabia, Qatar, South Africa, Rest of Middle East & Africa), Latin America (Brazil, Argentina, Mexico, Colombia, Rest of Latin America). |
| Company Profiles | Vale SA, BHP Group Ltd., Rio Tinto plc, Fortescue Metals Group Ltd., Anglo American plc, ArcelorMittal SA, Cleveland-Cliffs Inc., Kumba Iron Ore Ltd., Ansteel Group Corporation Ltd., HBIS Group Co. Ltd., Metalloinvest Management LLC, LKAB (Luossavaara-Kiirunavaara AB), Iron Ore Company of Canada, Evraz plc, Severstal PJSC, Ferrexpo plc, NMDC Ltd., Champion Iron Ltd., Labrador Iron Ore Royalty Corporation, Mount Gibson Iron Ltd. |
Frequently Asked Questions
Asia Pacific dominated the iron ore market in 2025.
Iron ore fines dominated the iron ore market in 2025.
The continuing industrialisation and urbanisation of emerging economies creating sustained steel demand through construction, infrastructure, and manufacturing investment.
The iron ore market was valued at USD 326.65 billion in 2025.
The iron ore market is expected to grow at a CAGR of 2.7% from 2026 to 2035.
Get in Touch
