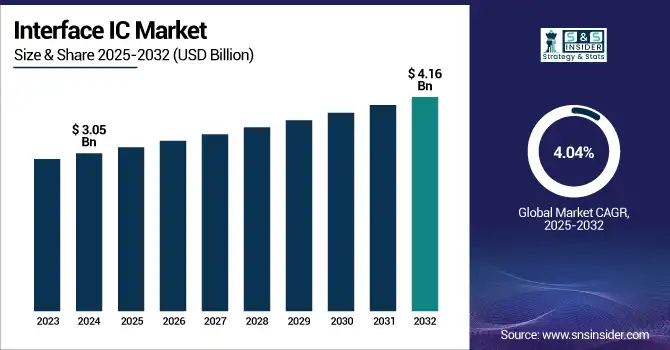
The Interface IC Market Size was valued at USD 3.05 billion in 2024 and is expected to reach USD 4.16 billion by 2032 and grow at a CAGR of 4.04 % over the forecast period 2025-2032.
The global Interface IC market is registering a high growth, spurred by the technology advancements and the rising requirement for faster, safer and more reliable data communication. This momentum is being driven by growth in consumer electronics and industrial automation applications. Moreover, the steady advancement of interface technologies is offering improved speed and performance, making it easier to use in different areas. Local momentum and increasing connectivity demands also help drive the growing market environment globally.
According to research, PCIe 5.0 and PCIe 6.0 are being adopted in hyperscale data centers, supporting 32–64 Gbps/lane, placing new performance demands on interface ICs.
The U.S. Interface IC Market size was USD 0.66 billion in 2024 and is expected to reach USD 0.79 billion by 2032, growing at a CAGR of 2.23 % over the forecast period of 2025–2032.
The US interface ic market growth due to the presence of the multiple electronics manufacturers and integration of IoT and smart solutions. Substantial investments in automotive sector particularly in electric and autonomous vehicles and increase in industrial automation act as drivers of the market. The nation also enjoys a high ecosystem of semiconductor innovators that are continuously innovating advanced interface IC solutions to sustain market expansion and competitive advantages among the world’s marketplace.
According to research, 5G base stations and edge data centers in US now require ICs supporting latency <1ms and ultra-low jitter performance.
Key Drivers:
Increasing demand for high-speed data transfer in consumer electronics fuels market expansion globally
Increasing consumer need of enhanced speed and efficiency of transferring data in smartphones, laptops and other smart devices is a major factor for market growth. Interfacing ICs facilitate the transfer of data between two or more devices such as by providing enhanced device performance and user experience. The increase of applications multimedial, streaming and consumption of high definition contents has increased the demand of efficient interface, leading companies to propose and use sophisticated ICs, capable to support higher data rates and lower power consumptions.
According to research, New interface ICs with adaptive voltage scaling can reduce power consumption by up to 55% compared to older designs.
Restrain:
Rapid technological changes lead to short product lifecycles, impacting market stability
Semiconductor and interface technology are rapidly changing, which leads to a higher rate of product loss. Companies are under tremendous pressures to stay profitable while constantly iterating their products to keep pace with evolving standards and dynamic consumer expectations. This short-life-cycle situation puts strong pressure on manufacturers for cost reduction and operational efficiency improvements, and could also cause inventory problems, supply chain disruption, demand volatility, and finally impact the steady and sustainable growth of the market in the long-term run.
Opportunities:
Adoption of 5G technology opens new avenues for high-performance Interface IC development
The deployment of 5G networks calls for high-performance interface ICs to enable extremely high-speed data and low latency. This transition demands that high-speed, energy-efficient ICs for telecommunications infrastructure and mobile devices, as well as new applications in the form of IoT, autonomous systems, etc. should be designed and implemented. The growth of the 5G ecosystem provides Interface IC manufacturers with a large opportunity to differentiate their products and profit from a burgeoning market which addresses new network requirements, but also imposes power consumption and Signal Integrity constraints in a wide range of complex system environments.
According to research, Modern high-performance interfaces (PCIe 5.0/6.0, USB 4, CXL) now support data rates between 32–64 Gbps, creating challenges for signal integrity at 5G backhaul & fronthaul layers.
Challenges:
Stringent regulatory compliance and certification complexities hinder market expansion and slow innovation pace
The manufacturers are forced to comply with strict rules concerning the product safety, electromagnetic compatibility and environmental sustainability with significant testing activities and documentation. These procedures add to the cost of development and prolong the time required to launch the product. And then, multipe standards across numerous countries compound the complexity, sending providers wading through a sea of regulation. "The current barrier to entry in the Interface IC industry often stunts competition and slows technological innovation to the detriment of smaller companies.
By Type of Interface
The analog segment dominated the Interface IC Market with the highest revenue share of about 45.83% in 2024. Its dominance is attributed to its critical role in bridging real-world analog signals with digital systems across diverse applications. In the middle of this landscape, Texas Instruments features a wide set of analog ICs and it can easily be argued that they are intrinsic to providing power management, audio processing, and sensor interfacing. Their products allow performance, reliability and ease of use in consumer electronics, industry and car industry.
The digital segment is expected to grow at the fastest CAGR of about 5.05% from 2025 to 2032. This growth is fueled by the market's need for high-speed data handling in sophisticated digital systems. At the centre of this shift, STMicroelectronics remains committed to pushing the boundaries in the design of next-generation digital interface ICs for IoT applications, AI and 5G infrastructure. Their advanced technology solutions provide superior system performance while covering the evolving digital interface innovation applications in several markets.
By Interface Standard
The serial segment dominated the Interface IC Market with the highest revenue share of about 43.79% in 2024. This comes mainly from widespread serial communication protocol I2C, SPI and UART. Analog Devices is synonymous with high performance among engineers, and has a long history of inventing breakthrough technology for customers. These are some of the smallest, most highly-integrated connector family in the market, providing many benefits, including compact design, robustness, and high performance for consumer, industrial and automotive applications.
The high-speed segment is expected to grow at the fastest CAGR of about 4.91% from 2025 to 2032. It is in demand for multimedia devices and data centers due to the fast data-rate transfer applications. At the core of this revolution, Renesas Electronics is delivering advanced high-speed interface ICs that support USB 3. x, HDMI and display port specifications. These solutions cater to increasing requirements for high-speed, high-bandwidth and always-on internet connection in consumer electronics, corporate computing and communication.
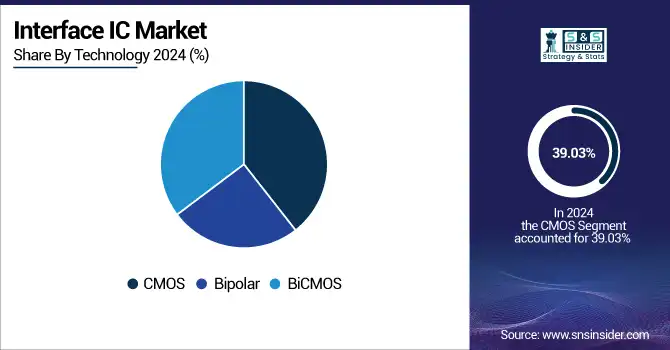
By Technology
The CMOS segment dominated the Interface IC Market with the highest revenue share of about 39.03% in 2024. Its dominance is linked to low power, cost, and adaptability. In addition to CMOS process technologies and provided by Interface ICs Companies such as Infineon Technologies, ultralow power, highly-integrated interface ICs are developed. Their products are widely used in smartphones, in-vehicle electronics, smart appliances, IoT devices, and other areas where small size and low power consumption are requirements.
The BiCMOS segment is expected to grow at the fastest CAGR of about 4.78% from 2025 to 2032, is driven by a need for ICs that can achieve a CMOS power dissipation while matching the performance of a bipolar transistor. Significant in this area, ON Semiconductor is leading development of BiCMOS-based interface ICs for high-performance requirements. Their offerings meet performance demands in automotive safety systems, communications infrastructure, and mixed-signal applications that require high speed, low signal cross talk, and low noise.
By End Use
The consumer electronics segment dominated the Interface IC Market with the highest revenue share of about 34.29% in 2024. This is due to the incredible demand for smartphones, tablets, wearables, and smart home products. Centrally- Many IC’s Qualcomm includes highend interface IC’s in consumer IC’s chips in the middle of the segment which boost the performance and the connectivity of the devices. The strong market momentum in this segment is being propelled by accelerated innovation cycles and consumer’s insatiable appetite for more features.
The automotive segment is expected to grow at the fastest CAGR of about 5.43% from 2025 to 2032. This growth is driven by electric vehicle (EV) deployment, advanced driver-assistance systems (ADAS) and connected car applications. At the core of this expansion, NXP Semiconductors is providing automotive-grade interface ICs that also comply with strict safety and performance requirements. Their products facilitate higher communication and sensor integration, including for vehicle autonomy, electrification and the next generation of automotive electronics.
North America dominated the Interface IC Market share of about 33.35% in 2024. This dominance is driven by strong presence of mature semiconductor manufacturers, high technology R&D capabilities, and aggressive technology push in consumer electronics, automotive, aviation and industrial applications. The region has well-established infrastructure and is open to innovations led in the IoT, AI, and 5G market as well and Northern America also enjoys a secure regulatory framework and consistent investments in new product development, enabling it to lead the overall wearable computing devices market.
The U.S. dominates the North American Interface IC Market due to the presence of large number of leading semiconductor companies in the region along with well-established R&D infrastructure and remarkable demand from end use applications including consumer electronics, automotive, aerospace and industrial automation in the country, which continue to drive innovation and large scale production capacities.
Asia Pacific is expected to grow at the fastest CAGR of about 5.12% from 2025 to 2032. This expansion is driven by fast industrialization, growing electronics production and surging use of smartphones, wearable devices and electric vehicles. Cost-competitive manufacturing environment in the region and increasing government focus on semiconductor manufacturing contribute to the expansion of the market. Moreover, increasing adoption of IoT devices, smart appliances, and automation in the automotive sector in countries including China, India, South Korea, and Taiwan is fueling the demand for Interface ICs.
China leads the Asia Pacific Interface IC Market with a large electronics manufacturing industry presence, favorable government backing for semiconductors development, growing consumer electronics and automotive industry, and establishment of local processing centres that are aiming at decreasing the market’s dependence on foreign technologies.
Europe holds substantial of the Interface IC Market owing to the robust industrial automation, and automotive, and aerospace industries. The area enjoys state-of-the-art manufacturing and a regulatory environment that fosters high-quality semiconductor manufacturing. Rising investment in electric vehicles and smart infrastructure are also spurring demand. Leading the innovative market is none-other than Germany, France and the UK, while the rest of Europe is along for the ride with consistent growth.
Germany dominates Europe’s Interface IC Market, backed by its powerful automotive and industry sectors, its advanced manufacturing strengths and solid R&D landscape. A focus in country at innovation, semiconductor supply chain and steady growth to lead the region.
The Middle East & Africa market is dominated by UAE which has been making heavy investments in the smart cities, telecom, and energy sectors among others while Saudi Arabia and Qatar continue to expand the industrial base. In Latin America, Brazil leads the way with growing electronics, automotive, automation and connected device markets.
Major Key Players in Interface IC Market are Texas Instruments, Analog Devices, NXP Semiconductors, Maxim Integrated, ON Semiconductor, STMicroelectronics, Renesas Electronics, Infineon Technologies, Microchip Technology, Broadcom and others.
In March 2023, Broadcom announced the production launch of its Tomahawk 5 Ethernet switch/router chips, delivering 51.2 terabits/second of switching capacity. This advancement enables single-hop connectivity between 256 high-performance AI/ML accelerators, each with 200 Gbps of network bandwidth, significantly enhancing AI training and inference tasks.
January 2023, Synaptics introduced the SmartBridge SB7900 local dimming IC, enabling high-resolution automotive displays up to 6K while reducing power consumption and system complexity.
Report Attributes | Details |
---|---|
Market Size in 2024 | USD 3.05 Billion |
Market Size by 2032 | USD 4.16 Billion |
CAGR | CAGR of 4.04% From 2025 to 2032 |
Base Year | 2024 |
Forecast Period | 2025-2032 |
Historical Data | 2021-2023 |
Report Scope & Coverage | Market Size, Segments Analysis, Competitive Landscape, Regional Analysis, DROC & SWOT Analysis, Forecast Outlook |
Key Segments | • By Type of Interface (Analog, Digital, Mixed-Signal) • By Interface Standard (Serial, Parallel, High-Speed) • By Technology (CMOS, Bipolar, BiCMOS) • By End Use (Consumer electronics, Automotive, Industrial automation, Telecommunications, Others) |
Regional Analysis/Coverage | North America (US, Canada, Mexico), Europe (Germany, France, UK, Italy, Spain, Poland, Turkey, Rest of Europe), Asia Pacific (China, India, Japan, South Korea, Singapore, Australia,Taiwan, Rest of Asia Pacific), Middle East & Africa (UAE, Saudi Arabia, Qatar, South Africa, Rest of Middle East & Africa), Latin America (Brazil, Argentina, Rest of Latin America) |
Company Profiles | Texas Instruments, Analog Devices, NXP Semiconductors, Maxim Integrated, ON Semiconductor, STMicroelectronics, Renesas Electronics, Infineon Technologies, Microchip Technology, Broadcom |
Ans: The Interface IC Market is expected to grow at a CAGR of 4.04 % from 2025-2032.
Ans: The Interface IC Market size was USD 3.05 billion in 2024 and is expected to reach USD 4.16 billion by 2032.
Ans: The major growth factor of the Interface IC Market is the increasing demand for high-speed data transfer and advanced connectivity in electronics.
Ans: Analog segment dominated the Interface IC Market.
Ans: North America dominated the Interface IC Market in 2024.
Table Of Content
1. Introduction
1.1 Market Definition
1.2 Scope (Inclusion and Exclusions)
1.3 Research Assumptions
2. Executive Summary
2.1 Market Overview
2.2 Regional Synopsis
2.3 Competitive Summary
3. Research Methodology
3.1 Top-Down Approach
3.2 Bottom-up Approach
3.3. Data Validation
3.4 Primary Interviews
4. Market Dynamics Impact Analysis
4.1 Market Driving Factors Analysis
4.1.1 Drivers
4.1.2 Restraints
4.1.3 Opportunities
4.1.4 Challenges
4.2 PESTLE Analysis
4.3 Porter’s Five Forces Model
5. Statistical Insights and Trends Reporting
5.1 Impact of Photonic Interface ICs
5.2 AI-Powered Adaptive Interface Usage
5.3 Use of AI in Interface IC Design Automation
6. Competitive Landscape
6.1 List of Major Companies By Region
6.2 Market Share Analysis By Region
6.3 Product Benchmarking
6.3.1 Product specifications and features
6.3.2 Pricing
6.4 Strategic Initiatives
6.4.1 Marketing and promotional activities
6.4.2 Distribution and Supply Chain Strategies
6.4.3 Expansion plans and new product launches
6.4.4 Strategic partnerships and collaborations
6.5 Technological Advancements
6.6 Market Positioning and Branding
7. Interface IC Market Segmentation By Type of Interface
7.1 Chapter Overview
7.2 Analog
7.2.1 Analog Market Trends Analysis (2021-2032)
7.2.2 Analog Market Size Estimates and Forecasts to 2032 (USD Billion)
7.3 Digital
7.3.1 Digital Market Trends Analysis (2021-2032)
7.3.2 Digital Market Size Estimates and Forecasts to 2032 (USD Billion)
7.4 Mixed-Signal
7.4.1 Mixed-Signal Market Trends Analysis (2021-2032)
7.4.2 Mixed-Signal Market Size Estimates and Forecasts to 2032 (USD Billion)
8. Interface IC Market Segmentation By Interface Standard
8.1 Chapter Overview
8.2 Serial
8.2.1 Serial Market Trends Analysis (2021-2032)
8.2.2 Serial Market Size Estimates and Forecasts to 2032 (USD Billion)
8.3 Parallel
8.3.1 Parallel Market Trends Analysis (2021-2032)
8.3.2 Parallel Market Size Estimates and Forecasts to 2032 (USD Billion)
8.4 High-Speed
8.4.1 High-Speed Market Trends Analysis (2021-2032)
8.4.2 High-Speed Market Size Estimates and Forecasts to 2032 (USD Billion)
9. Interface IC Market Segmentation By Technology
9.1 Chapter Overview
9.2 CMOS
9.2.1 CMOS Market Trends Analysis (2021-2032)
9.2.2 CMOS Market Size Estimates and Forecasts to 2032 (USD Billion)
9.3 Bipolar
9.3.1 Bipolar Market Trends Analysis (2021-2032)
9.3.2 Bipolar Market Size Estimates and Forecasts to 2032 (USD Billion)
9.4 BiCMOS
9.4.1 BiCMOS Market Trends Analysis (2021-2032)
9.4.2 BiCMOS Market Size Estimates and Forecasts to 2032 (USD Billion)
10. Interface IC Market Segmentation By End Use
10.1 Chapter Overview
10.2 Consumer electronics
10.2.1 Consumer electronics Market Trends Analysis (2021-2032)
10.2.2 Consumer electronics Market Size Estimates and Forecasts to 2032 (USD Billion)
10.3 Automotive
10.3.1 Automotive Market Trend Analysis (2021-2032)
10.3.2 Automotive Market Size Estimates and Forecasts to 2032 (USD Billion)
10.4 Industrial automation
10.4.1 Industrial automation Market Trends Analysis (2021-2032)
10.4.2 Industrial automation Market Size Estimates and Forecasts to 2032 (USD Billion)
10.5 Telecommunications
10.5.1 Telecommunications Market Trends Analysis (2021-2032)
10.5.2 Telecommunications Market Size Estimates and Forecasts to 2032 (USD Billion)
10.6 Others
10.6.1 Others Market Trends Analysis (2021-2032)
10.6.2 Others Market Size Estimates and Forecasts to 2032 (USD Billion)
11. Regional Analysis
11.1 Chapter Overview
11.2 North America
11.2.1 Trend Analysis
11.2.2 North America Interface IC Market Estimates and Forecasts by Country (2021-2032) (USD Billion)
11.2.3 North America Interface IC Market Estimates and Forecasts By Type of Interface (2021-2032) (USD Billion)
11.2.4 North America Interface IC Market Estimates and Forecasts By Interface Standard (2021-2032) (USD Billion)
11.2.5 North America Interface IC Market Estimates and Forecasts By Technology (2021-2032) (USD Billion)
11.2.6 North America Interface IC Market Estimates and Forecasts By End Use (2021-2032) (USD Billion)
11.2.7 USA
11.2.7.1 USA Interface IC Market Estimates and Forecasts By Type of Interface (2021-2032) (USD Billion)
11.2.7.2 USA Interface IC Market Estimates and Forecasts By Interface Standard (2021-2032) (USD Billion)
11.2.7.3 USA Interface IC Market Estimates and Forecasts By Technology (2021-2032) (USD Billion)
11.2.7.4 USA Interface IC Market Estimates and Forecasts By End Use (2021-2032) (USD Billion)
11.2.8 Canada
11.2.8.1 Canada Interface IC Market Estimates and Forecasts By Type of Interface (2021-2032) (USD Billion)
11.2.8.2 Canada Interface IC Market Estimates and Forecasts By Interface Standard (2021-2032) (USD Billion)
11.2.8.3 Canada Interface IC Market Estimates and Forecasts By Technology (2021-2032) (USD Billion)
11.2.8.4 Canada Interface IC Market Estimates and Forecasts By End Use (2021-2032) (USD Billion)
11.2.9 Mexico
11.2.9.1 Mexico Interface IC Market Estimates and Forecasts By Type of Interface (2021-2032) (USD Billion)
11.2.9.2 Mexico Interface IC Market Estimates and Forecasts By Interface Standard (2021-2032) (USD Billion)
11.2.9.3 Mexico Interface IC Market Estimates and Forecasts By Technology (2021-2032) (USD Billion)
11.2.9.4 Mexico Interface IC Market Estimates and Forecasts By End Use (2021-2032) (USD Billion)
11.3 Europe
11.3.1 Trend Analysis
11.3.2 Europe Interface IC Market Estimates and Forecasts by Country (2021-2032) (USD Billion)
11.3.3 Europe Interface IC Market Estimates and Forecasts By Type of Interface (2021-2032) (USD Billion)
11.3.4 Europe Interface IC Market Estimates and Forecasts By Interface Standard (2021-2032) (USD Billion)
11.3.5 Europe Interface IC Market Estimates and Forecasts By Technology (2021-2032) (USD Billion)
11.3.6 Europe Interface IC Market Estimates and Forecasts By End Use (2021-2032) (USD Billion)
11.3.7 Germany
11.3.7.1 Germany Interface IC Market Estimates and Forecasts By Type of Interface (2021-2032) (USD Billion)
11.3.7.2 Germany Interface IC Market Estimates and Forecasts By Interface Standard (2021-2032) (USD Billion)
11.3.7.3 Germany Interface IC Market Estimates and Forecasts By Technology (2021-2032) (USD Billion)
11.3.7.4 Germany Interface IC Market Estimates and Forecasts By End Use (2021-2032) (USD Billion)
11.3.8 France
11.3.8.1 France Interface IC Market Estimates and Forecasts By Type of Interface (2021-2032) (USD Billion)
11.3.8.2 France Interface IC Market Estimates and Forecasts By Interface Standard (2021-2032) (USD Billion)
11.3.8.3 France Interface IC Market Estimates and Forecasts By Technology (2021-2032) (USD Billion)
11.3.8.4 France Interface IC Market Estimates and Forecasts By End Use (2021-2032) (USD Billion)
11.3.9 UK
11.3.9.1 UK Interface IC Market Estimates and Forecasts By Type of Interface (2021-2032) (USD Billion)
11.3.9.2 UK Interface IC Market Estimates and Forecasts By Interface Standard (2021-2032) (USD Billion)
11.3.9.3 UK Interface IC Market Estimates and Forecasts By Technology (2021-2032) (USD Billion)
11.3.9.4 UK Interface IC Market Estimates and Forecasts By End Use (2021-2032) (USD Billion)
11.3.10 Italy
11.3.10.1 ItalyInterface IC Market Estimates and Forecasts By Type of Interface (2021-2032) (USD Billion)
11.3.10.2 Italy Interface IC Market Estimates and Forecasts By Interface Standard (2021-2032) (USD Billion)
11.3.10.3 Italy Interface IC Market Estimates and Forecasts By Technology (2021-2032) (USD Billion)
11.3.10.4 Italy Interface IC Market Estimates and Forecasts By End Use (2021-2032) (USD Billion)
11.3.11 Spain
11.3.11.1 Spain Interface IC Market Estimates and Forecasts By Type of Interface (2021-2032) (USD Billion)
11.3.11.2 Spain Interface IC Market Estimates and Forecasts By Interface Standard (2021-2032) (USD Billion)
11.3.11.3 Spain Interface IC Market Estimates and Forecasts By Technology (2021-2032) (USD Billion)
11.3.11.4 Spain Interface IC Market Estimates and Forecasts By End Use (2021-2032) (USD Billion)
11.3.12 Poland
11.3.12.1 Poland Interface IC Market Estimates and Forecasts By Type of Interface (2021-2032) (USD Billion)
11.3.12.2 Poland Interface IC Market Estimates and Forecasts By Interface Standard (2021-2032) (USD Billion)
11.3.12.3 Poland Interface IC Market Estimates and Forecasts By Technology (2021-2032) (USD Billion)
11.3.12.4 Poland Interface IC Market Estimates and Forecasts By End Use (2021-2032) (USD Billion)
11.3.13 Turkey
11.3.13.1 Turkey Interface IC Market Estimates and Forecasts By Type of Interface (2021-2032) (USD Billion)
11.3.13.2 Turkey Interface IC Market Estimates and Forecasts By Interface Standard (2021-2032) (USD Billion)
11.3.13.3 Turkey Interface IC Market Estimates and Forecasts By Technology (2021-2032) (USD Billion)
11.3.13.4 Turkey Interface IC Market Estimates and Forecasts By End Use (2021-2032) (USD Billion)
11.3.14 Rest of Europe
11.3.14.1 Rest of Europe Interface IC Market Estimates and Forecasts By Type of Interface (2021-2032) (USD Billion)
11.3.14.2 Rest of Europe Interface IC Market Estimates and Forecasts By Interface Standard (2021-2032) (USD Billion)
11.3.14.3 Rest of Europe Interface IC Market Estimates and Forecasts By Technology (2021-2032) (USD Billion)
11.3.14.4 Rest of Europe Interface IC Market Estimates and Forecasts By End Use (2021-2032) (USD Billion)
11.4 Asia Pacific
11.4.1 Trend Analysis
11.4.2 Asia Pacific Interface IC Market Estimates and Forecasts by Country (2021-2032) (USD Billion)
11.4.3 Asia Pacific Interface IC Market Estimates and Forecasts By Type of Interface (2021-2032) (USD Billion)
11.4.4 Asia Pacific Interface IC Market Estimates and Forecasts By Interface Standard (2021-2032) (USD Billion)
11.4.5 Asia Pacific Interface IC Market Estimates and Forecasts By Technology (2021-2032) (USD Billion)
11.4.6 Asia Pacific Interface IC Market Estimates and Forecasts By End Use (2021-2032) (USD Billion)
11.4.7 China
11.4.7.1 China Interface IC Market Estimates and Forecasts By Type of Interface (2021-2032) (USD Billion)
11.4.7.2 China Interface IC Market Estimates and Forecasts By Interface Standard (2021-2032) (USD Billion)
11.4.7.3 China Interface IC Market Estimates and Forecasts By Technology (2021-2032) (USD Billion)
11.4.7.4 China Interface IC Market Estimates and Forecasts By End Use (2021-2032) (USD Billion)
11.4.8 India
11.4.8.1 India Interface IC Market Estimates and Forecasts By Type of Interface (2021-2032) (USD Billion)
11.4.8.2 India Interface IC Market Estimates and Forecasts By Interface Standard (2021-2032) (USD Billion)
11.4.8.3 India Interface IC Market Estimates and Forecasts By Technology (2021-2032) (USD Billion)
11.4.8.4 India Interface IC Market Estimates and Forecasts By End Use (2021-2032) (USD Billion)
11.4.9 Japan
11.4.9.1 Japan Interface IC Market Estimates and Forecasts By Type of Interface (2021-2032) (USD Billion)
11.4.9.2 Japan Interface IC Market Estimates and Forecasts By Interface Standard (2021-2032) (USD Billion)
11.4.9.3 Japan Interface IC Market Estimates and Forecasts By Technology (2021-2032) (USD Billion)
11.4.9.4 Japan Interface IC Market Estimates and Forecasts By End Use (2021-2032) (USD Billion)
11.4.10 South Korea
11.4.10.1 South Korea Interface IC Market Estimates and Forecasts By Type of Interface (2021-2032) (USD Billion)
11.4.10.2 South Korea Interface IC Market Estimates and Forecasts By Interface Standard (2021-2032) (USD Billion)
11.4.10.3 South Korea Interface IC Market Estimates and Forecasts By Technology (2021-2032) (USD Billion)
11.4.10.4 South Korea Interface IC Market Estimates and Forecasts By End Use (2021-2032) (USD Billion)
11.4.11 Singapore
11.4.11.1 Singapore Interface IC Market Estimates and Forecasts By Type of Interface (2021-2032) (USD Billion)
11.4.11.2 Singapore Interface IC Market Estimates and Forecasts By Interface Standard (2021-2032) (USD Billion)
11.4.11.3 Singapore Interface IC Market Estimates and Forecasts By Technology (2021-2032) (USD Billion)
11.4.11.4 Singapore Interface IC Market Estimates and Forecasts By End Use (2021-2032) (USD Billion)
11.4.12 Australia
11.4.12.1 Australia Interface IC Market Estimates and Forecasts By Type of Interface (2021-2032) (USD Billion)
11.4.12.2 Australia Interface IC Market Estimates and Forecasts By Interface Standard (2021-2032) (USD Billion)
11.4.12.3 Australia Interface IC Market Estimates and Forecasts By Technology (2021-2032) (USD Billion)
11.4.12.4 Australia Interface IC Market Estimates and Forecasts By End Use (2021-2032) (USD Billion)
11.4.13 Taiwan
11.4.13.1 Taiwan Interface IC Market Estimates and Forecasts By Type of Interface (2021-2032) (USD Billion)
11.4.13.2 Taiwan Interface IC Market Estimates and Forecasts By Interface Standard (2021-2032) (USD Billion)
11.4.13.3 Taiwan Interface IC Market Estimates and Forecasts By Technology (2021-2032) (USD Billion)
11.4.13.4 Taiwan Interface IC Market Estimates and Forecasts By End Use (2021-2032) (USD Billion)
11.4.14 Rest of Asia Pacific
11.4.14.1 Rest of Asia Pacific Interface IC Market Estimates and Forecasts By Type of Interface (2021-2032) (USD Billion)
11.4.14.2 Rest of Asia Pacific Interface IC Market Estimates and Forecasts By Interface Standard (2021-2032) (USD Billion)
11.4.14.3 Rest of Asia Pacific Interface IC Market Estimates and Forecasts By Technology (2021-2032) (USD Billion)
11.4.14.4 Rest of Asia Pacific Interface IC Market Estimates and Forecasts By End Use (2021-2032) (USD Billion)
11.5 Middle East and Africa
11.5.1 Trend Analysis
11.5.2 Middle East and Africa Interface IC Market Estimates and Forecasts by Country (2021-2032) (USD Billion)
11.5.3 Middle East and Africa Interface IC Market Estimates and Forecasts By Type of Interface (2021-2032) (USD Billion)
11.5.4 Middle East and Africa Interface IC Market Estimates and Forecasts By Interface Standard (2021-2032) (USD Billion)
11.5.5 Middle East and Africa Interface IC Market Estimates and Forecasts By Technology (2021-2032) (USD Billion)
11.5.6 Middle East and Africa Interface IC Market Estimates and Forecasts By End Use (2021-2032) (USD Billion)
11.5.7 UAE
11.5.7.1 UAE Interface IC Market Estimates and Forecasts By Type of Interface (2021-2032) (USD Billion)
11.5.7.2 UAE Interface IC Market Estimates and Forecasts By Interface Standard (2021-2032) (USD Billion)
11.5.7.3 UAE Interface IC Market Estimates and Forecasts By Technology (2021-2032) (USD Billion)
11.5.7.4 UAE Interface IC Market Estimates and Forecasts By End Use (2021-2032) (USD Billion)
11.5.8 Saudi Arabia
11.5.8.1 Saudi Arabia Interface IC Market Estimates and Forecasts By Type of Interface (2021-2032) (USD Billion)
11.5.8.2 Saudi Arabia Interface IC Market Estimates and Forecasts By Interface Standard (2021-2032) (USD Billion)
11.5.8.3 Saudi Arabia Interface IC Market Estimates and Forecasts By Technology (2021-2032) (USD Billion)
11.5.8.4 Saudi Arabia Interface IC Market Estimates and Forecasts By End Use (2021-2032) (USD Billion)
11.5.9 Qatar
11.5.9.1 Qatar Interface IC Market Estimates and Forecasts By Type of Interface (2021-2032) (USD Billion)
11.5.9.2 Qatar Interface IC Market Estimates and Forecasts By Interface Standard (2021-2032) (USD Billion)
11.5.9.3 Qatar Interface IC Market Estimates and Forecasts By Technology (2021-2032) (USD Billion)
11.5.1.9.4 Qatar Interface IC Market Estimates and Forecasts By End Use (2021-2032) (USD Billion)
11.5.10 South Africa
11.5.10.1 South Africa Interface IC Market Estimates and Forecasts By Type of Interface (2021-2032) (USD Billion)
11.5.10.2 South Africa Interface IC Market Estimates and Forecasts By Interface Standard (2021-2032) (USD Billion)
11.5.10.3 South Africa Interface IC Market Estimates and Forecasts By Technology (2021-2032) (USD Billion)
11.5.10.4 South Africa Interface IC Market Estimates and Forecasts By End Use (2021-2032) (USD Billion)
11.5.11 Rest of Middle East & Africa
11.5.11.1 Rest of Middle East & Africa Interface IC Market Estimates and Forecasts By Type of Interface (2021-2032) (USD Billion)
11.5.11.2 Rest of Middle East & Africa Interface IC Market Estimates and Forecasts By Interface Standard (2021-2032) (USD Billion)
11.5.11.3 Rest of Middle East & Africa Interface IC Market Estimates and Forecasts By Technology (2021-2032) (USD Billion)
11.5.11.4 Rest of Middle East & Africa Interface IC Market Estimates and Forecasts By End Use (2021-2032) (USD Billion)
11.6 Latin America
11.6.1 Trend Analysis
11.6.2 Latin America Interface IC Market Estimates and Forecasts by Country (2021-2032) (USD Billion)
11.6.3 Latin America Interface IC Market Estimates and Forecasts By Type of Interface (2021-2032) (USD Billion)
11.6.4 Latin America Interface IC Market Estimates and Forecasts By Interface Standard (2021-2032) (USD Billion)
11.6.5 Latin America Interface IC Market Estimates and Forecasts By Technology (2021-2032) (USD Billion)
11.6.6 Latin America Interface IC Market Estimates and Forecasts By End Use (2021-2032) (USD Billion)
11.6.7 Brazil
11.6.7.1 Brazil Interface IC Market Estimates and Forecasts By Type of Interface (2021-2032) (USD Billion)
11.6.7.2 Brazil Interface IC Market Estimates and Forecasts By Interface Standard (2021-2032) (USD Billion)
11.6.7.3 Brazil Interface IC Market Estimates and Forecasts By Technology (2021-2032) (USD Billion)
11.6.7.4 Brazil Interface IC Market Estimates and Forecasts By End Use (2021-2032) (USD Billion)
11.6.8 Argentina
11.6.8.1 Argentina Interface IC Market Estimates and Forecasts By Type of Interface (2021-2032) (USD Billion)
11.6.8.2 Argentina Interface IC Market Estimates and Forecasts By Interface Standard (2021-2032) (USD Billion)
11.6.8.3 Argentina Interface IC Market Estimates and Forecasts By Technology (2021-2032) (USD Billion)
11.6.8.4 Argentina Interface IC Market Estimates and Forecasts By End Use (2021-2032) (USD Billion)
11.6.9 Rest of Latin America
11.6.9.1 Rest of Latin America Interface IC Market Estimates and Forecasts By Type of Interface (2021-2032) (USD Billion)
11.6.9.2 Rest of Latin America Interface IC Market Estimates and Forecasts By Interface Standard (2021-2032) (USD Billion)
11.6.9.3 Rest of Latin America Interface IC Market Estimates and Forecasts By Technology (2021-2032) (USD Billion)
11.6.9.4 Rest of Latin America Interface IC Market Estimates and Forecasts By End Use (2021-2032) (USD Billion)
12. Company Profiles
12.1 Texas Instruments
12.1.1 Company Overview
12.1.2 Financial
12.1.3 Products/ Services Offered
12.1.4 SWOT Analysis
12.2 Analog Devices
12.2.1 Company Overview
12.2.2 Financial
12.2.3 Products/ Services Offered
12.2.4 SWOT Analysis
12.3 NXP Semiconductors
12.3.1 Company Overview
12.3.2 Financial
12.3.3 Products/ Services Offered
12.3.4 SWOT Analysis
12.4 Maxim Integrated
12.4.1 Company Overview
12.4.2 Financial
12.4.3 Products/ Services Offered
12.4.4 SWOT Analysis
12.5 ON Semiconductor
12.5.1 Company Overview
12.5.2 Financial
12.5.3 Products/ Services Offered
12.5.4 SWOT Analysis
12.6 STMicroelectronics
12.6.1 Company Overview
12.6.2 Financial
12.6.3 Products/ Services Offered
12.6.4 SWOT Analysis
12.7 Renesas Electronics
12.7.1 Company Overview
12.7.2 Financial
12.7.3 Products/ Services Offered
12.7.4 SWOT Analysis
12.8 Infineon Technologies
12.8.1 Company Overview
12.8.2 Financial
12.8.3 Products/ Services Offered
12.8.4 SWOT Analysis
12.9 Microchip Technology
12.9.1 Company Overview
12.9.2 Financial
12.9.3 Products/ Services Offered
12.9.4 SWOT Analysis
12.10 Broadcom
12.10.1 Company Overview
12.10.2 Financial
12.10.3 Products/ Services Offered
12.10.4 SWOT Analysis
13. Use Cases and Best Practices
14. Conclusion
An accurate research report requires proper strategizing as well as implementation. There are multiple factors involved in the completion of good and accurate research report and selecting the best methodology to compete the research is the toughest part. Since the research reports we provide play a crucial role in any company’s decision-making process, therefore we at SNS Insider always believe that we should choose the best method which gives us results closer to reality. This allows us to reach at a stage wherein we can provide our clients best and accurate investment to output ratio.
Each report that we prepare takes a timeframe of 350-400 business hours for production. Starting from the selection of titles through a couple of in-depth brain storming session to the final QC process before uploading our titles on our website we dedicate around 350 working hours. The titles are selected based on their current market cap and the foreseen CAGR and growth.
The 5 steps process:
Step 1: Secondary Research:
Secondary Research or Desk Research is as the name suggests is a research process wherein, we collect data through the readily available information. In this process we use various paid and unpaid databases which our team has access to and gather data through the same. This includes examining of listed companies’ annual reports, Journals, SEC filling etc. Apart from this our team has access to various associations across the globe across different industries. Lastly, we have exchange relationships with various university as well as individual libraries.
Step 2: Primary Research
When we talk about primary research, it is a type of study in which the researchers collect relevant data samples directly, rather than relying on previously collected data. This type of research is focused on gaining content specific facts that can be sued to solve specific problems. Since the collected data is fresh and first hand therefore it makes the study more accurate and genuine.
We at SNS Insider have divided Primary Research into 2 parts.
Part 1 wherein we interview the KOLs of major players as well as the upcoming ones across various geographic regions. This allows us to have their view over the market scenario and acts as an important tool to come closer to the accurate market numbers. As many as 45 paid and unpaid primary interviews are taken from both the demand and supply side of the industry to make sure we land at an accurate judgement and analysis of the market.
This step involves the triangulation of data wherein our team analyses the interview transcripts, online survey responses and observation of on filed participants. The below mentioned chart should give a better understanding of the part 1 of the primary interview.
Part 2: In this part of primary research the data collected via secondary research and the part 1 of the primary research is validated with the interviews from individual consultants and subject matter experts.
Consultants are those set of people who have at least 12 years of experience and expertise within the industry whereas Subject Matter Experts are those with at least 15 years of experience behind their back within the same space. The data with the help of two main processes i.e., FGDs (Focused Group Discussions) and IDs (Individual Discussions). This gives us a 3rd party nonbiased primary view of the market scenario making it a more dependable one while collation of the data pointers.
Step 3: Data Bank Validation
Once all the information is collected via primary and secondary sources, we run that information for data validation. At our intelligence centre our research heads track a lot of information related to the market which includes the quarterly reports, the daily stock prices, and other relevant information. Our data bank server gets updated every fortnight and that is how the information which we collected using our primary and secondary information is revalidated in real time.
Step 4: QA/QC Process
After all the data collection and validation our team does a final level of quality check and quality assurance to get rid of any unwanted or undesired mistakes. This might include but not limited to getting rid of the any typos, duplication of numbers or missing of any important information. The people involved in this process include technical content writers, research heads and graphics people. Once this process is completed the title gets uploader on our platform for our clients to read it.
Step 5: Final QC/QA Process:
This is the last process and comes when the client has ordered the study. In this process a final QA/QC is done before the study is emailed to the client. Since we believe in giving our clients a good experience of our research studies, therefore, to make sure that we do not lack at our end in any way humanly possible we do a final round of quality check and then dispatch the study to the client.
Key Segments:
By Type of Interface
Analog
Digital
Mixed-Signal
By Interface Standard
Serial
Parallel
High-Speed
By Technology
CMOS
Bipolar
BiCMOS
By End Use
Consumer electronics
Automotive
Industrial automation
Telecommunications
Others
Request for Segment Customization as per your Business Requirement: Segment Customization Request
Regional Coverage:
North America
US
Canada
Mexico
Europe
Germany
France
UK
Italy
Spain
Poland
Turkey
Rest of Europe
Asia Pacific
China
India
Japan
South Korea
Singapore
Australia
Taiwan
Rest of Asia Pacific
Middle East & Africa
UAE
Saudi Arabia
Qatar
South Africa
Rest of Middle East & Africa
Latin America
Brazil
Argentina
Rest of Latin America
Request for Country Level Research Report: Country Level Customization Request
Available Customization
With the given market data, SNS Insider offers customization as per the company’s specific needs. The following customization options are available for the report:
Detailed Volume Analysis
Criss-Cross segment analysis (e.g. Product X Application)
Competitive Product Benchmarking
Geographic Analysis
Additional countries in any of the regions
Customized Data Representation
Detailed analysis and profiling of additional market players