To Get More Information on IP Camera Market - Request Sample Report
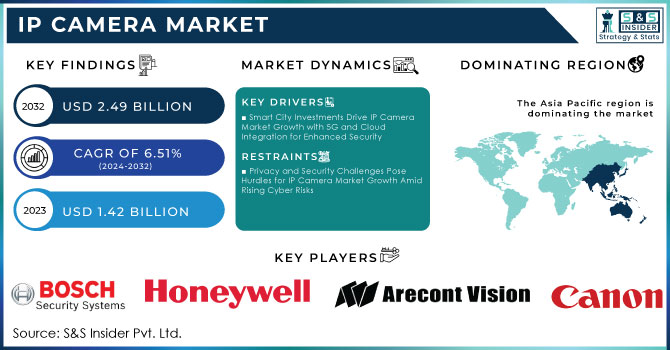
The IP Camera Market was valued at USD 1.42 Billion in 2023 and is expected to reach USD 2.49 Billion by 2032 and grow at a CAGR of 6.51% over the forecast period 2024-2032.
The IP camera market is growing due to increasing demand for improved security among residential, industrial, and commercial applications. Rising security threats are opting for the trend of IP cameras with advanced features including HD videos, remote monitoring, and real-time alerts. IP cameras are much better than their analog counterparts as they offer higher resolution, easier scalability, and can be integrated with other IoT-enabled devices thus making them the perfect solutions for a modern security system. Over 90% of units sold during the current year in the IP camera market support at least 1080p resolution or greater. The utilization of AI-enabled cameras that have features like human detection and motion sensing experienced a 40% year-over-year increase between the years 2023 and 2024. Cloud storage and built-in mobile app features have accounted for 60% of the fresh installations. India continues to feel the rise of property crimes that account for more than 60% of all reported crimes with IP camera demand and multi-camera systems forecast for a consistent growth rate of 30% through the commercial and residential segments.
Furthermore, IoT trends and technologies like artificial intelligence (AI) and machine learning (ML), are supporting the IP camera market to implement innovative features including facial recognition, movement of object detection, and motion analysis. Such intelligent features allow automating the security protocols to reduce human intervention and thus, enhance the efficiency of the surveillance system. Furthermore, the growing use of cloud-based storage solutions for storing video content is also increasing the demand as it offers users a wide range of flexible storage options as well as convenient accessibility to archived footage. Facial recognition was featured in 25% of all new IP camera systems deployed in 2023–2024, and the use of AI and ML for many other advanced camera features, such as object movement detection, motion analysis, etc., showed a strong growth of over 30%. 50% of IP cameras were integrated with the cloud for video storage, a more flexible and scalable approach. The overall robustness of security awareness along with technological advancement is driving the IP camera market.
KEY DRIVERS:
Smart City Investments Drive IP Camera Market Growth with 5G and Cloud Integration for Enhanced Security
Infrastructure modernization is one of the significant factors fuelling the demand for the IP camera market, especially among growing cities. Governments and private entities are pouring billions into smart city projects with a focus on advanced security and surveillance networks, as quick urbanization continues. Such projects place a tremendous focus on IP cameras since they can be effortlessly connected to larger networks, and provide real-time data transmission important for augmenting the successful monitoring of public areas. The modernization of this infrastructure also includes improved connectivity choices, like 5G, enabling IP cameras to stream HD video with low delay time. Smart city use cases have attracted over USD 35 billion of investments worldwide in 2023-2024, resulting in the installation of 10 million IP cameras. These systems with integrated 5G connectivity with 60% could even allow for 4K video streaming at near-zero latency. Moreover, 80% of installations utilized cloud integration for expandable storage, and 75% were developed to be integrated into larger IoT ecosystems to promote public safety monitoring. The rapid urbanization of cities, coupled with their robust expansion, has once again brought attention to the need for seamless interoperability between surveillance infrastructure such as IP cameras to keep the public safe and secure.
Industrial Demand Drives IP Camera Market Growth with Enhanced Safety Productivity and Efficiency Solutions
Another important factor is the increasing requirement for IP cameras in industrial and critical infrastructure applications, where safety and monitoring are also vital to business operations as well as security. IP cameras are increasingly used in industries such as energy, transportation, and manufacturing for equipment monitoring, anomaly detection, and regulatory safety compliance. High-definition and thermal imaging helps detect potential hazards early on, leading to fewer accidents and damage in these high-risk areas where cameras are invaluable. Furthermore, IP cameras generate data that can be tracked and analyzed to increase productivity, decrease downtime, and improve workflow.
1.5 million IP cameras were deployed in energy, transportation, and other manufacturing sectors between 2023-2024, resulting in 30% fewer accidents thanks to HD and thermal imaging. Data from some of the top companies reveals that 85% of companies used IP cameras for anomaly detection and hence reduced 20% downtime. Data from these systems increased productivity by 70% while increasing safety compliance in industrial processes. This increasing demand for industrial safety and operational insight is noticed as the key factor when it comes to driving the IP camera market owing to that companies across various core sectors are on the lookout for comprehensive by way of effective solutions with which they can improve their industrial process safety and efficiency.
RESTRAIN:
Privacy and Security Challenges Pose Hurdles for IP Camera Market Growth Amid Rising Cyber Risks
One of the key challenges in the IP camera market, limited to this report is that privacy concerns with IP cameras not only suites for outside footage but also records videos inside homes/offices and other places constantly. Additionally, the ethical implications of this continuous monitoring can trigger regulatory activity and stricter data protection legislation. Furthermore, meeting data privacy laws like GDPR is harder than ever enterprises need to apply the right practices for securely handling personal data while still having a demand for monitoring deep. Network security is another big hurdle that must be crossed as IP cameras are connected to the internet and may be open targets for cyber-attacks. If these devices are affected by hacking risks, they may have functionality issues where footage is compromised and opens up to anyone other than the eyes that were meant for it. The vulnerability is more impactful for organizations that depend on IP camera cameras to protect, a breach can cause great damage such as operational bankruptcy and critical equipment being destroyed. While necessary to combat these cyber risks, this will create significant challenges around the implementation and maintenance of IP camera systems through default encryption and cybersecurity protocols mounting up.
BY COMPONENT
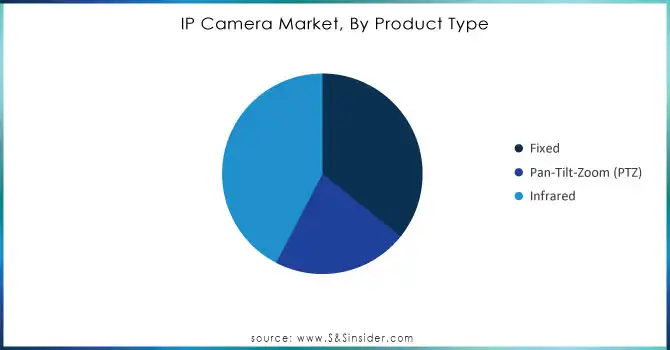
The IP camera hardware segment accounted for a major share of 72% of the overall market in 2023. This supremacy layers over the significance of physical elements high degree video cameras, high degree sensing units, and storage space tools that are needed for the performance of IP surveillance systems. The growing demand for advanced hardware solutions to support high-definition image quality and sophisticated functionalities is mainly driven by enterprises and consumers alike. Such as infrared vision, weather-proof covering, and mass storage capacity all of these functions gain favor for dogged and reliable components during installation keeping in mind that the equipment will be housed in many practical areas i.e. commercial sites of work and public facilities.
The services segment is projected to have the highest CAGR growth from 2024-2032 as well because of the increasing need for maintenance and other cloud storage solutions along with real-time monitoring services. With the increasing sophistication of IP camera systems, users increasingly seek professional support for both installation and network integration along with ongoing technical support. Moreover, cloud-based services are gaining a lot of popularity as they save more time and allow users to access the footage from anywhere by storing it online such as video storage and AI-driven video analytics together. Therefore, the transition towards service-dependent solutions enables end users to leverage their IP camera systems further contributing to the robust growth of the services segment for the rest of the forecast period.
BY PRODUCT TYPE
Infrared IP cameras accounted for the largest market share of 42% in 2023 The increasing need for these cameras, being used for 24×7 surveillance in sensitive areas such as banks and ATMs where low-light or no-light visibility is desired, has led to its dominance. Infrared cameras are famously used in night vision applications: they can take high-resolution images using just their infrared sensors, which makes this technology very popular among people who want to spotlight locations such as warehouses, parking lots, and industrial sites even in total darkness. Growing focus on continuous monitoring across numerous end-use applications has propelled the infrared technology adoption, strengthening its market share.
Pan-Tilt-Zoom cameras are poised to have the highest CAGR growth rate throughout 2024–2032. Part of this growth comes from PTZ cameras for their versatility, they offer the ability to control the camera remotely and pan, tilt, or zoom in on a given field of study. PTZ cameras are best for moving surveillance locations such as large public spaces, event venues, and city monitoring where flexible coverage is needed. PTZ cameras are highly popular for modern security needs due to their features of covering broad areas and aligning views from remote locations, thereby making them expected to grow rapidly over the next few years.
Do You Need any Customization Research on IP Camera Market - Inquire Now
BY CONNECTION TYPE
The consolidated market segment accounted for a 71% share of the overall IP Camera market in 2023. The major share can be attributed to the rising demand for a unified solution in security systems, organizations from large enterprises, government, and critical infrastructure all prefer conventional IP camera systems over scattered subsystems which provide better control, monitoring, and scalability. With looks like high-resolution video feeds, cloud storage, and remote accessibility as key features of a consolidated system, they can be ideal for large-scale surveillance projects.
The distributed segment shall rise with a significant CAGR from 2024 to 2032. As small and medium-sized businesses, as well as residential communities, become more open to consolidation, distributed systems are inherently much more adaptable and scalable than their consolidated counterparts. Cameras can be connected in stand-alone mode from different locations, without requiring a central server. The growing popularity of edge computing, which moves data processing closer to the camera as well as cloud-based solutions, bolsters distributed systems. This availability, cost-efficiency, and increasing need for more decentralized security solutions in other sectors are driving the high CAGR of the distributed segment.
BY END USE
In 2023, the commercial segment accounted for 62% of the total market share, due to the growing demand for surveillance solutions across different commercial sectors, from retail and banking to transportation and government buildings. These sectors require security, asset protection, and a compliance environment with multiple safety standards and regulations that need surveillance technologies due to high demand. With features of high-definition video quality, remote monitoring, and integration with other security systems that make them suitable for large-scale commercial operations they are IP Cameras.
The residential segment is projected to have the highest CAGR from 2024 to 2032. The increasing trend of smart homes, rise in home security awareness and affordable price of IP cameras have propelled the demand for residential surveillance solutions. Consumers across the region are becoming more concerned about their safety and the security of property, which makes them use IP camera systems for home monitoring even more compared to the previous few years with rising online shopping trends supported by less push towards on-site visit primaries.
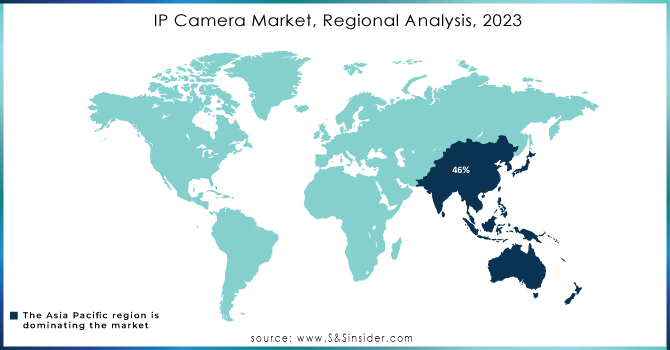
The IP camera market was led by Asia Pacific in 2023, which accounted for 46% of the overall market. The growth in the region is due to rapid urbanization, increasing investments for infrastructural development, and security interest by burgeoning economies like China Japan, India, and South Korea. High-definition video surveillance has emerged to fulfill the need of demand in sectors such as transportation, retail, and government. China's "Safe Cities" program, for instance, has driven the proliferation of millions of IP cameras to improve public safety. The rising penetration of smart city initiatives in multiple metropolitan regions has also supported the growth of demand for IP cameras across the region, awarding Asia Pacific with a lion's share in the market.
Latin America is estimated to register a maximum CAGR during 2024–2032. The reasons for this growth include growing concerns about safety and crime rates, increased urbanization, and the adoption of more intelligent technologies within homes and companies. High urban crime in Brazil, Mexico, and Argentina has created a greater demand for security solutions. Take Brazil for example, the increasing adoption of IP cameras used by both private and public institutions to monitor urban security as well as hosting large-scale events such as the World Cup and Olympics has been a solid market driver. With the growing middle class in the region and cheaper IP technology,
Some of the major players in the IP Camera Market are:
Bosch Security Systems (Bosch IP 4000, Flexidome IP Camera)
Arecont Vision Costar LLC. (MegaVideo IP Camera, ConteraIP Series)
Avigilon Corporation (H4 IP Camera, H5 Camera)
Canon Inc. (VB-C60, VB-M50B)
Belkin International Inc. (NetCam HD, F7D7601)
Zhejiang Dahua Technology Co. Ltd. (IPC-HFW1431S, IPC-HDW5231R-Z)
D-Link Corporation (DCS-5222L, DCS-8010LH)
GeoVision Inc. (GV-BX4700, GV-EFD6700)
Hangzhou Hikvision Digital Technology Co. Ltd. (DS-2CD2085FWD-I, DS-2CD3132-I)
Honeywell International Inc. (EquIP Series, Performance Series)
Guangzhou Juan Intelligent Joint Stock Co. Ltd. (JUAN 4K IP Camera, JN-2105)
March Networks Corporation (8200 Series, 9000 Series)
MOBOTIX AG (MOBOTIX M15, MOBOTIX M24)
Netgear Inc. (Arlo Pro 3, Arlo Ultra)
Pelco by Schneider Electric (Sarix Professional, Opera 180)
Samsung Electronics Co. Ltd. (SNB-6004, SNV-7080)
Shenzhen Apexis Electronic Co. Ltd. (Apexis IP Camera, APM-J903)
Shenzhen Wanscam Technology Co. Ltd. (Wanscam HW0039, Wanscam JW001)
Sony Corporation (Sony SNC-VM772R, SNC-ER580)
Vivotek Inc. (IB8369, IP9160-H)
3M
LG Chem
SABIC
BASF
DuPont
Dow
Solvay
BASF
Mitsubishi Chemical
Sumitomo Chemical
In September 2024, Artificial Intelligence Technology Solutions, Inc. unveiled RADCam™, an innovative residential security product, through its subsidiary Robotic Assistance Devices Residential, Inc. (RAD-R).
In July 2024, Honor launched the Xiaopai Smart Camera Pro, a home security device with a triple-lens system and 4MP sensors for high-definition video capture.
In January 2024, Xiaomi introduced the 360 Home Security Camera 2K, offering AI Human Detection, 2K resolution, and 360-degree coverage for enhanced security.
Report Attributes | Details |
---|---|
Market Size in 2023 | USD 1.42 Billion |
Market Size by 2032 | USD 2.49 Billion |
CAGR | CAGR of 6.51% From 2024 to 2032 |
Base Year | 2023 |
Forecast Period | 2024-2032 |
Historical Data | 2020-2022 |
Report Scope & Coverage | Market Size, Segments Analysis, Competitive Landscape, Regional Analysis, DROC & SWOT Analysis, Forecast Outlook |
Key Segments | • by Component (Hardware, Services) • by Product type (Fixed, Pan-Tilt-Zoom (PTZ), Infrared) • by Connection Type (Consolidated, Distributed) • by End Use (Residential, Commercial, Government) |
Regional Analysis/Coverage | North America (US, Canada, Mexico), Europe (Eastern Europe [Poland, Romania, Hungary, Turkey, Rest of Eastern Europe] Western Europe] Germany, France, UK, Italy, Spain, Netherlands, Switzerland, Austria, Rest of Western Europe]), Asia Pacific (China, India, Japan, South Korea, Vietnam, Singapore, Australia, Rest of Asia Pacific), Middle East & Africa (Middle East [UAE, Egypt, Saudi Arabia, Qatar, Rest of Middle East], Africa [Nigeria, South Africa, Rest of Africa], Latin America (Brazil, Argentina, Colombia, Rest of Latin America) |
Company Profiles | Bosch Security Systems, Arecont Vision Costar LLC., Avigilon Corporation, Canon Inc., Belkin International Inc., Zhejiang Dahua Technology Co. Ltd., D-Link Corporation, GeoVision Inc., Hangzhou Hikvision Digital Technology Co. Ltd., Honeywell International Inc., Guangzhou Juan Intelligent Joint Stock Co. Ltd., March Networks Corporation, MOBOTIX AG, Netgear Inc., Pelco by Schneider Electric, Samsung Electronics Co. Ltd., Shenzhen Apexis Electronic Co. Ltd., Shenzhen Wanscam Technology Co. Ltd., Sony Corporation, Vivotek Inc. |
Key Drivers | • Smart City Investments Drive IP Camera Market Growth with 5G and Cloud Integration for Enhanced Security • Industrial Demand Drives IP Camera Market Growth with Enhanced Safety Productivity and Efficiency Solutions |
Restraints | • Privacy and Security Challenges Pose Hurdles for IP Camera Market Growth Amid Rising Cyber Risks |
Ans: The IP Camera Market is expected to grow at a CAGR of 14.01% during 2024-2032.
Ans: IP Camera Market size was USD 13.02 billion in 2023 and is expected to Reach USD 42.25 billion by 2032.
Ans: The major growth factor of the IP Camera market is the increasing demand for advanced security solutions driven by rising concerns over safety and surveillance in both residential and commercial sectors.
Ans: The Consolidated segment dominated the IP Camera Market in 2023.
Ans: Asia Pacific dominated the IP Camera Market in 2023.
Table of Contents
1. Introduction
1.1 Market Definition
1.2 Scope (Inclusion and Exclusions)
1.3 Research Assumptions
2. Executive Summary
2.1 Market Overview
2.2 Regional Synopsis
2.3 Competitive Summary
3. Research Methodology
3.1 Top-Down Approach
3.2 Bottom-up Approach
3.3. Data Validation
3.4 Primary Interviews
4. Market Dynamics Impact Analysis
4.1 Market Driving Factors Analysis
4.1.1 Drivers
4.1.2 Restraints
4.1.3 Opportunities
4.1.4 Challenges
4.2 PESTLE Analysis
4.3 Porter’s Five Forces Model
5. Statistical Insights and Trends Reporting
5.1 IP Camera Technology Adoption Rate (2023)
5.2 IP Camera Product Performance Metrics (2023)
5.3 IP Camera Installation and Maintenance Costs
5.4 IP Camera Growth of Security as a Service
5.5 IP Camera Distribution Channel Analysis
6. Competitive Landscape
6.1 List of Major Companies, By Region
6.2 Market Share Analysis, By Region
6.3 Product Benchmarking
6.3.1 Product specifications and features
6.3.2 Pricing
6.4 Strategic Initiatives
6.4.1 Marketing and promotional activities
6.4.2 Distribution and Supply Chain Strategies
6.4.3 Expansion plans and new product launches
6.4.4 Strategic partnerships and collaborations
6.5 Technological Advancements
6.6 Market Positioning and Branding
7. IP Camera Market Segmentation, by Component
7.1 Chapter Overview
7.2 Hardware
7.2.1 Hardware Market Trends Analysis (2020-2032)
7.2.2 Hardware Market Size Estimates and Forecasts to 2032 (USD Billion)
7.3 Services
7.3.1 Services Market Trends Analysis (2020-2032)
7.3.2 Services Market Size Estimates and Forecasts to 2032 (USD Billion)
8. IP Camera Market Segmentation, By Product Type
8.1 Chapter Overview
8.2 Fixed
8.2.1 Fixed Market Trends Analysis (2020-2032)
8.2.2 Fixed Market Size Estimates and Forecasts to 2032 (USD Billion)
8.3 Pan-Tilt-Zoom (PTZ)
8.3.1 Pan-Tilt-Zoom (PTZ) Market Trends Analysis (2020-2032)
8.3.2 Pan-Tilt-Zoom (PTZ) Market Size Estimates and Forecasts to 2032 (USD Billion)
8.4 Infrared
8.4.1 Infrared Market Trends Analysis (2020-2032)
8.4.2 Infrared Market Size Estimates and Forecasts to 2032 (USD Billion)
9. IP Camera Market Segmentation, By Connection Type
9.1 Chapter Overview
9.2 Consolidated
9.2.1 Consolidated Market Trends Analysis (2020-2032)
9.2.2 Consolidated Market Size Estimates and Forecasts to 2032 (USD Billion)
9.3 Distributed
9.3.1 Distributed Market Trends Analysis (2020-2032)
9.3.2 Distributed Market Size Estimates and Forecasts to 2032 (USD Billion)
10. IP Camera Market Segmentation, BY End Use
10.1 Chapter Overview
10.2 Residential
10.2.1 Residential Market Trends Analysis (2020-2032)
10.2.2 Residential Market Size Estimates and Forecasts to 2032 (USD Billion)
10.3 Commercial
10.3.1 Commercial Market Trends Analysis (2020-2032)
10.3.2 Commercial Market Size Estimates and Forecasts to 2032 (USD Billion)
10.4 Government
10.4.1 Government Market Trends Analysis (2020-2032)
10.4.2 Government Market Size Estimates and Forecasts to 2032 (USD Billion)
11. Regional Analysis
11.1 Chapter Overview
11.2 North America
11.2.1 Trends Analysis
11.2.2 North America IP Camera Market Estimates and Forecasts, by Country (2020-2032) (USD Billion)
11.2.3 North America IP Camera Market Estimates and Forecasts, by Component (2020-2032) (USD Billion)
11.2.4 North America IP Camera Market Estimates and Forecasts, By Product Type (2020-2032) (USD Billion)
11.2.5 North America IP Camera Market Estimates and Forecasts, By Connection Type (2020-2032) (USD Billion)
11.2.6 North America IP Camera Market Estimates and Forecasts, BY End Use (2020-2032) (USD Billion)
11.2.7 USA
11.2.7.1 USA IP Camera Market Estimates and Forecasts, by Component (2020-2032) (USD Billion)
11.2.7.2 USA IP Camera Market Estimates and Forecasts, By Product Type (2020-2032) (USD Billion)
11.2.7.3 USA IP Camera Market Estimates and Forecasts, By Connection Type (2020-2032) (USD Billion)
11.2.7.4 USA IP Camera Market Estimates and Forecasts, BY End Use (2020-2032) (USD Billion)
11.2.8 Canada
11.2.8.1 Canada IP Camera Market Estimates and Forecasts, by Component (2020-2032) (USD Billion)
11.2.8.2 Canada IP Camera Market Estimates and Forecasts, By Product Type (2020-2032) (USD Billion)
11.2.8.3 Canada IP Camera Market Estimates and Forecasts, By Connection Type (2020-2032) (USD Billion)
11.2.8.4 Canada IP Camera Market Estimates and Forecasts, BY End Use (2020-2032) (USD Billion)
11.2.9 Mexico
11.2.9.1 Mexico IP Camera Market Estimates and Forecasts, by Component (2020-2032) (USD Billion)
11.2.9.2 Mexico IP Camera Market Estimates and Forecasts, By Product Type (2020-2032) (USD Billion)
11.2.9.3 Mexico IP Camera Market Estimates and Forecasts, By Connection Type (2020-2032) (USD Billion)
11.2.9.4 Mexico IP Camera Market Estimates and Forecasts, BY End Use (2020-2032) (USD Billion)
11.3 Europe
11.3.1 Eastern Europe
11.3.1.1 Trends Analysis
11.3.1.2 Eastern Europe IP Camera Market Estimates and Forecasts, by Country (2020-2032) (USD Billion)
11.3.1.3 Eastern Europe IP Camera Market Estimates and Forecasts, by Component (2020-2032) (USD Billion)
11.3.1.4 Eastern Europe IP Camera Market Estimates and Forecasts, By Product Type (2020-2032) (USD Billion)
11.3.1.5 Eastern Europe IP Camera Market Estimates and Forecasts, By Connection Type (2020-2032) (USD Billion)
11.3.1.6 Eastern Europe IP Camera Market Estimates and Forecasts, BY End Use (2020-2032) (USD Billion)
11.3.1.7 Poland
11.3.1.7.1 Poland IP Camera Market Estimates and Forecasts, by Component (2020-2032) (USD Billion)
11.3.1.7.2 Poland IP Camera Market Estimates and Forecasts, By Product type (2020-2032) (USD Billion)
11.3.1.7.3 Poland IP Camera Market Estimates and Forecasts, By Connection Type (2020-2032) (USD Billion)
11.3.1.7.4 Poland IP Camera Market Estimates and Forecasts, BY End Use (2020-2032) (USD Billion)
11.3.1.8 Romania
11.3.1.8.1 Romania IP Camera Market Estimates and Forecasts, by Component (2020-2032) (USD Billion)
11.3.1.8.2 Romania IP Camera Market Estimates and Forecasts, By Product type (2020-2032) (USD Billion)
11.3.1.8.3 Romania IP Camera Market Estimates and Forecasts, By Connection Type (2020-2032) (USD Billion)
11.3.1.8.4 Romania IP Camera Market Estimates and Forecasts, BY End Use (2020-2032) (USD Billion)
11.3.1.9 Hungary
11.3.1.9.1 Hungary IP Camera Market Estimates and Forecasts, by Component (2020-2032) (USD Billion)
11.3.1.9.2 Hungary IP Camera Market Estimates and Forecasts, By Product type (2020-2032) (USD Billion)
11.3.1.9.3 Hungary IP Camera Market Estimates and Forecasts, By Connection Type (2020-2032) (USD Billion)
11.3.1.9.4 Hungary IP Camera Market Estimates and Forecasts, BY End Use (2020-2032) (USD Billion)
11.3.1.10 Turkey
11.3.1.10.1 Turkey IP Camera Market Estimates and Forecasts, by Component (2020-2032) (USD Billion)
11.3.1.10.2 Turkey IP Camera Market Estimates and Forecasts, By Product type (2020-2032) (USD Billion)
11.3.1.10.3 Turkey IP Camera Market Estimates and Forecasts, By Connection Type (2020-2032) (USD Billion)
11.3.1.10.4 Turkey IP Camera Market Estimates and Forecasts, BY End Use (2020-2032) (USD Billion)
11.3.1.11 Rest of Eastern Europe
11.3.1.11.1 Rest of Eastern Europe IP Camera Market Estimates and Forecasts, by Component (2020-2032) (USD Billion)
11.3.1.11.2 Rest of Eastern Europe IP Camera Market Estimates and Forecasts, By Product type (2020-2032) (USD Billion)
11.3.1.11.3 Rest of Eastern Europe IP Camera Market Estimates and Forecasts, By Connection Type (2020-2032) (USD Billion)
11.3.1.11.4 Rest of Eastern Europe IP Camera Market Estimates and Forecasts, BY End Use (2020-2032) (USD Billion)
11.3.2 Western Europe
11.3.2.1 Trends Analysis
11.3.2.2 Western Europe IP Camera Market Estimates and Forecasts, by Country (2020-2032) (USD Billion)
11.3.2.3 Western Europe IP Camera Market Estimates and Forecasts, by Component (2020-2032) (USD Billion)
11.3.2.4 Western Europe IP Camera Market Estimates and Forecasts, By Product type (2020-2032) (USD Billion)
11.3.2.5 Western Europe IP Camera Market Estimates and Forecasts, By Connection Type (2020-2032) (USD Billion)
11.3.2.6 Western Europe IP Camera Market Estimates and Forecasts, BY End Use (2020-2032) (USD Billion)
11.3.2.7 Germany
11.3.2.7.1 Germany IP Camera Market Estimates and Forecasts, by Component (2020-2032) (USD Billion)
11.3.2.7.2 Germany IP Camera Market Estimates and Forecasts, By Product type (2020-2032) (USD Billion)
11.3.2.7.3 Germany IP Camera Market Estimates and Forecasts, By Connection Type (2020-2032) (USD Billion)
11.3.2.7.4 Germany IP Camera Market Estimates and Forecasts, BY End Use (2020-2032) (USD Billion)
11.3.2.8 France
11.3.2.8.1 France IP Camera Market Estimates and Forecasts, by Component (2020-2032) (USD Billion)
11.3.2.8.2 France IP Camera Market Estimates and Forecasts, By Product type (2020-2032) (USD Billion)
11.3.2.8.3 France IP Camera Market Estimates and Forecasts, By Connection Type (2020-2032) (USD Billion)
11.3.2.8.4 France IP Camera Market Estimates and Forecasts, BY End Use (2020-2032) (USD Billion)
11.3.2.9 UK
11.3.2.9.1 UK IP Camera Market Estimates and Forecasts, by Component (2020-2032) (USD Billion)
11.3.2.9.2 UK IP Camera Market Estimates and Forecasts, By Product type (2020-2032) (USD Billion)
11.3.2.9.3 UK IP Camera Market Estimates and Forecasts, By Connection Type (2020-2032) (USD Billion)
11.3.2.9.4 UK IP Camera Market Estimates and Forecasts, BY End Use (2020-2032) (USD Billion)
11.3.2.10 Italy
11.3.2.10.1 Italy IP Camera Market Estimates and Forecasts, by Component (2020-2032) (USD Billion)
11.3.2.10.2 Italy IP Camera Market Estimates and Forecasts, By Product type (2020-2032) (USD Billion)
11.3.2.10.3 Italy IP Camera Market Estimates and Forecasts, By Connection Type (2020-2032) (USD Billion)
11.3.2.10.4 Italy IP Camera Market Estimates and Forecasts, BY End Use (2020-2032) (USD Billion)
11.3.2.11 Spain
11.3.2.11.1 Spain IP Camera Market Estimates and Forecasts, by Component (2020-2032) (USD Billion)
11.3.2.11.2 Spain IP Camera Market Estimates and Forecasts, By Product type (2020-2032) (USD Billion)
11.3.2.11.3 Spain IP Camera Market Estimates and Forecasts, By Connection Type (2020-2032) (USD Billion)
11.3.2.11.4 Spain IP Camera Market Estimates and Forecasts, BY End Use (2020-2032) (USD Billion)
11.3.2.12 Netherlands
11.3.2.12.1 Netherlands IP Camera Market Estimates and Forecasts, by Component (2020-2032) (USD Billion)
11.3.2.12.2 Netherlands IP Camera Market Estimates and Forecasts, By Product type (2020-2032) (USD Billion)
11.3.2.12.3 Netherlands IP Camera Market Estimates and Forecasts, By Connection Type (2020-2032) (USD Billion)
11.3.2.12.4 Netherlands IP Camera Market Estimates and Forecasts, BY End Use (2020-2032) (USD Billion)
11.3.2.13 Switzerland
11.3.2.13.1 Switzerland IP Camera Market Estimates and Forecasts, by Component (2020-2032) (USD Billion)
11.3.2.13.2 Switzerland IP Camera Market Estimates and Forecasts, By Product type (2020-2032) (USD Billion)
11.3.2.13.3 Switzerland IP Camera Market Estimates and Forecasts, By Connection Type (2020-2032) (USD Billion)
11.3.2.13.4 Switzerland IP Camera Market Estimates and Forecasts, BY End Use (2020-2032) (USD Billion)
11.3.2.14 Austria
11.3.2.14.1 Austria IP Camera Market Estimates and Forecasts, by Component (2020-2032) (USD Billion)
11.3.2.14.2 Austria IP Camera Market Estimates and Forecasts, By Product type (2020-2032) (USD Billion)
11.3.2.14.3 Austria IP Camera Market Estimates and Forecasts, By Connection Type (2020-2032) (USD Billion)
11.3.2.14.4 Austria IP Camera Market Estimates and Forecasts, BY End Use (2020-2032) (USD Billion)
11.3.2.15 Rest of Western Europe
11.3.2.15.1 Rest of Western Europe IP Camera Market Estimates and Forecasts, by Component (2020-2032) (USD Billion)
11.3.2.15.2 Rest of Western Europe IP Camera Market Estimates and Forecasts, By Product type (2020-2032) (USD Billion)
11.3.2.15.3 Rest of Western Europe IP Camera Market Estimates and Forecasts, By Connection Type (2020-2032) (USD Billion)
11.3.2.15.4 Rest of Western Europe IP Camera Market Estimates and Forecasts, BY End Use (2020-2032) (USD Billion)
11.4 Asia Pacific
11.4.1 Trends Analysis
11.4.2 Asia Pacific IP Camera Market Estimates and Forecasts, by Country (2020-2032) (USD Billion)
11.4.3 Asia Pacific IP Camera Market Estimates and Forecasts, by Component (2020-2032) (USD Billion)
11.4.4 Asia Pacific IP Camera Market Estimates and Forecasts, By Product type (2020-2032) (USD Billion)
11.4.5 Asia Pacific IP Camera Market Estimates and Forecasts, By Connection Type (2020-2032) (USD Billion)
11.4.6 Asia Pacific IP Camera Market Estimates and Forecasts, BY End Use (2020-2032) (USD Billion)
11.4.7 China
11.4.7.1 China IP Camera Market Estimates and Forecasts, by Component (2020-2032) (USD Billion)
11.4.7.2 China IP Camera Market Estimates and Forecasts, By Product type (2020-2032) (USD Billion)
11.4.7.3 China IP Camera Market Estimates and Forecasts, By Connection Type (2020-2032) (USD Billion)
11.4.7.4 China IP Camera Market Estimates and Forecasts, BY End Use (2020-2032) (USD Billion)
11.4.8 India
11.4.8.1 India IP Camera Market Estimates and Forecasts, by Component (2020-2032) (USD Billion)
11.4.8.2 India IP Camera Market Estimates and Forecasts, By Product Type (2020-2032) (USD Billion)
11.4.8.3 India IP Camera Market Estimates and Forecasts, By Connection Type (2020-2032) (USD Billion)
11.4.8.4 India IP Camera Market Estimates and Forecasts, BY End Use (2020-2032) (USD Billion)
11.4.9 japan
11.4.9.1 Japan IP Camera Market Estimates and Forecasts, by Component (2020-2032) (USD Billion)
11.4.9.2 Japan IP Camera Market Estimates and Forecasts, By Product Type (2020-2032) (USD Billion)
11.4.9.3 Japan IP Camera Market Estimates and Forecasts, By Connection Type (2020-2032) (USD Billion)
11.4.9.4 Japan IP Camera Market Estimates and Forecasts, BY End Use (2020-2032) (USD Billion)
11.4.10 South Korea
11.4.10.1 South Korea IP Camera Market Estimates and Forecasts, by Component (2020-2032) (USD Billion)
11.4.10.2 South Korea IP Camera Market Estimates and Forecasts, By Product Type (2020-2032) (USD Billion)
11.4.10.3 South Korea IP Camera Market Estimates and Forecasts, By Connection Type (2020-2032) (USD Billion)
11.4.10.4 South Korea IP Camera Market Estimates and Forecasts, BY End Use (2020-2032) (USD Billion)
11.4.11 Vietnam
11.4.11.1 Vietnam IP Camera Market Estimates and Forecasts, by Component (2020-2032) (USD Billion)
11.4.11.2 Vietnam IP Camera Market Estimates and Forecasts, By Product Type (2020-2032) (USD Billion)
11.4.11.3 Vietnam IP Camera Market Estimates and Forecasts, By Connection Type (2020-2032) (USD Billion)
11.4.11.4 Vietnam IP Camera Market Estimates and Forecasts, BY End Use (2020-2032) (USD Billion)
11.4.12 Singapore
11.4.12.1 Singapore IP Camera Market Estimates and Forecasts, by Component (2020-2032) (USD Billion)
11.4.12.2 Singapore IP Camera Market Estimates and Forecasts, By Product Type (2020-2032) (USD Billion)
11.4.12.3 Singapore IP Camera Market Estimates and Forecasts, By Connection Type (2020-2032) (USD Billion)
11.4.12.4 Singapore IP Camera Market Estimates and Forecasts, BY End Use (2020-2032) (USD Billion)
11.4.13 Australia
11.4.13.1 Australia IP Camera Market Estimates and Forecasts, by Component (2020-2032) (USD Billion)
11.4.13.2 Australia IP Camera Market Estimates and Forecasts, By Product Type (2020-2032) (USD Billion)
11.4.13.3 Australia IP Camera Market Estimates and Forecasts, By Connection Type (2020-2032) (USD Billion)
11.4.13.4 Australia IP Camera Market Estimates and Forecasts, BY End Use (2020-2032) (USD Billion)
11.4.14 Rest of Asia Pacific
11.4.14.1 Rest of Asia Pacific IP Camera Market Estimates and Forecasts, by Component (2020-2032) (USD Billion)
11.4.14.2 Rest of Asia Pacific IP Camera Market Estimates and Forecasts, By Product Type (2020-2032) (USD Billion)
11.4.14.3 Rest of Asia Pacific IP Camera Market Estimates and Forecasts, By Connection Type (2020-2032) (USD Billion)
11.4.14.4 Rest of Asia Pacific IP Camera Market Estimates and Forecasts, BY End Use (2020-2032) (USD Billion)
11.5 Middle East and Africa
11.5.1 Middle East
11.5.1.1 Trends Analysis
11.5.1.2 Middle East IP Camera Market Estimates and Forecasts, by Country (2020-2032) (USD Billion)
11.5.1.3 Middle East IP Camera Market Estimates and Forecasts, by Component (2020-2032) (USD Billion)
11.5.1.4 Middle East IP Camera Market Estimates and Forecasts, By Product Type (2020-2032) (USD Billion)
11.5.1.5 Middle East IP Camera Market Estimates and Forecasts, By Connection Type (2020-2032) (USD Billion)
11.5.1.6 Middle East IP Camera Market Estimates and Forecasts, BY End Use (2020-2032) (USD Billion)
11.5.1.7 UAE
11.5.1.7.1 UAE IP Camera Market Estimates and Forecasts, by Component (2020-2032) (USD Billion)
11.5.1.7.2 UAE IP Camera Market Estimates and Forecasts, By Product Type (2020-2032) (USD Billion)
11.5.1.7.3 UAE IP Camera Market Estimates and Forecasts, By Connection Type (2020-2032) (USD Billion)
11.5.1.7.4 UAE IP Camera Market Estimates and Forecasts, BY End Use (2020-2032) (USD Billion)
11.5.1.8 Egypt
11.5.1.8.1 Egypt IP Camera Market Estimates and Forecasts, by Component (2020-2032) (USD Billion)
11.5.1.8.2 Egypt IP Camera Market Estimates and Forecasts, By Product Type (2020-2032) (USD Billion)
11.5.1.8.3 Egypt IP Camera Market Estimates and Forecasts, By Connection Type (2020-2032) (USD Billion)
11.5.1.8.4 Egypt IP Camera Market Estimates and Forecasts, BY End Use (2020-2032) (USD Billion)
11.5.1.9 Saudi Arabia
11.5.1.9.1 Saudi Arabia IP Camera Market Estimates and Forecasts, by Component (2020-2032) (USD Billion)
11.5.1.9.2 Saudi Arabia IP Camera Market Estimates and Forecasts, By Product Type (2020-2032) (USD Billion)
11.5.1.9.3 Saudi Arabia IP Camera Market Estimates and Forecasts, By Connection Type (2020-2032) (USD Billion)
11.5.1.9.4 Saudi Arabia IP Camera Market Estimates and Forecasts, BY End Use (2020-2032) (USD Billion)
11.5.1.10 Qatar
11.5.1.10.1 Qatar IP Camera Market Estimates and Forecasts, by Component (2020-2032) (USD Billion)
11.5.1.10.2 Qatar IP Camera Market Estimates and Forecasts, By Product Type (2020-2032) (USD Billion)
11.5.1.10.3 Qatar IP Camera Market Estimates and Forecasts, By Connection Type (2020-2032) (USD Billion)
11.5.1.10.4 Qatar IP Camera Market Estimates and Forecasts, BY End Use (2020-2032) (USD Billion)
11.5.1.11 Rest of Middle East
11.5.1.11.1 Rest of Middle East IP Camera Market Estimates and Forecasts, by Component (2020-2032) (USD Billion)
11.5.1.11.2 Rest of Middle East IP Camera Market Estimates and Forecasts, By Product Type (2020-2032) (USD Billion)
11.5.1.11.3 Rest of Middle East IP Camera Market Estimates and Forecasts, By Connection Type (2020-2032) (USD Billion)
11.5.1.11.4 Rest of Middle East IP Camera Market Estimates and Forecasts, BY End Use (2020-2032) (USD Billion)
11.5.2 Africa
11.5.2.1 Trends Analysis
11.5.2.2 Africa IP Camera Market Estimates and Forecasts, by Country (2020-2032) (USD Billion)
11.5.2.3 Africa IP Camera Market Estimates and Forecasts, by Component (2020-2032) (USD Billion)
11.5.2.4 Africa IP Camera Market Estimates and Forecasts, By Product Type (2020-2032) (USD Billion)
11.5.2.5 Africa IP Camera Market Estimates and Forecasts, By Connection Type (2020-2032) (USD Billion)
11.5.2.6 Africa IP Camera Market Estimates and Forecasts, BY End Use (2020-2032) (USD Billion)
11.5.2.7 South Africa
11.5.2.7.1 South Africa IP Camera Market Estimates and Forecasts, by Component (2020-2032) (USD Billion)
11.5.2.7.2 South Africa IP Camera Market Estimates and Forecasts, By Product Type (2020-2032) (USD Billion)
11.5.2.7.3 South Africa IP Camera Market Estimates and Forecasts, By Connection Type (2020-2032) (USD Billion)
11.5.2.7.4 South Africa IP Camera Market Estimates and Forecasts, BY End Use (2020-2032) (USD Billion)
11.5.2.8 Nigeria
11.5.2.8.1 Nigeria IP Camera Market Estimates and Forecasts, by Component (2020-2032) (USD Billion)
11.5.2.8.2 Nigeria IP Camera Market Estimates and Forecasts, By Product Type (2020-2032) (USD Billion)
11.5.2.8.3 Nigeria IP Camera Market Estimates and Forecasts, By Connection Type (2020-2032) (USD Billion)
11.5.2.8.4 Nigeria IP Camera Market Estimates and Forecasts, BY End Use (2020-2032) (USD Billion)
11.5.2.9 Rest of Africa
11.5.2.9.1 Rest of Africa IP Camera Market Estimates and Forecasts, by Component (2020-2032) (USD Billion)
11.5.2.9.2 Rest of Africa IP Camera Market Estimates and Forecasts, By Product Type (2020-2032) (USD Billion)
11.5.2.9.3 Rest of Africa IP Camera Market Estimates and Forecasts, By Connection Type (2020-2032) (USD Billion)
11.5.2.9.4 Rest of Africa IP Camera Market Estimates and Forecasts, BY End Use (2020-2032) (USD Billion)
11.6 Latin America
11.6.1 Trends Analysis
11.6.2 Latin America IP Camera Market Estimates and Forecasts, by Country (2020-2032) (USD Billion)
11.6.3 Latin America IP Camera Market Estimates and Forecasts, by Component (2020-2032) (USD Billion)
11.6.4 Latin America IP Camera Market Estimates and Forecasts, By Product Type (2020-2032) (USD Billion)
11.6.5 Latin America IP Camera Market Estimates and Forecasts, By Connection Type (2020-2032) (USD Billion)
11.6.6 Latin America IP Camera Market Estimates and Forecasts, BY End Use (2020-2032) (USD Billion)
11.6.7 brazil
11.6.7.1 Brazil IP Camera Market Estimates and Forecasts, by Component (2020-2032) (USD Billion)
11.6.7.2 Brazil IP Camera Market Estimates and Forecasts, By Product Type (2020-2032) (USD Billion)
11.6.7.3 Brazil IP Camera Market Estimates and Forecasts, By Connection Type (2020-2032) (USD Billion)
11.6.7.4 Brazil IP Camera Market Estimates and Forecasts, BY End Use (2020-2032) (USD Billion)
11.6.8 Argentina
11.6.8.1 Argentina IP Camera Market Estimates and Forecasts, by Component (2020-2032) (USD Billion)
11.6.8.2 Argentina IP Camera Market Estimates and Forecasts, By Product Type (2020-2032) (USD Billion)
11.6.8.3 Argentina IP Camera Market Estimates and Forecasts, By Connection Type (2020-2032) (USD Billion)
11.6.8.4 Argentina IP Camera Market Estimates and Forecasts, BY End Use (2020-2032) (USD Billion)
11.6.9 Colombia
11.6.9.1 Colombia IP Camera Market Estimates and Forecasts, by Component (2020-2032) (USD Billion)
11.6.9.2 Colombia IP Camera Market Estimates and Forecasts, By Product Type (2020-2032) (USD Billion)
11.6.9.3 Colombia IP Camera Market Estimates and Forecasts, By Connection Type (2020-2032) (USD Billion)
11.6.9.4 Colombia IP Camera Market Estimates and Forecasts, BY End Use (2020-2032) (USD Billion)
11.6.10 Rest of Latin America
11.6.10.1 Rest of Latin America IP Camera Market Estimates and Forecasts, by Component (2020-2032) (USD Billion)
11.6.10.2 Rest of Latin America IP Camera Market Estimates and Forecasts, By Product Type (2020-2032) (USD Billion)
11.6.10.3 Rest of Latin America IP Camera Market Estimates and Forecasts, By Connection Type (2020-2032) (USD Billion)
11.6.10.4 Rest of Latin America IP Camera Market Estimates and Forecasts, BY End Use (2020-2032) (USD Billion)
12. Company Profiles
12.1 Bosch Security Systems
12.1.1 Company Overview
12.1.2 Financial
12.1.3 Products/ Services Offered
12.1.4 SWOT Analysis
12.2 Arecont Vision Costar LLC.
12.2.1 Company Overview
12.2.2 Financial
12.2.3 Products/ Services Offered
12.2.4 SWOT Analysis
12.3 Avigilon Corporation
12.3.1 Company Overview
12.3.2 Financial
12.3.3 Products/ Services Offered
12.3.4 SWOT Analysis
12.4 Canon Inc.
12.4.1 Company Overview
12.4.2 Financial
12.4.3 Products/ Services Offered
12.4.4 SWOT Analysis
12.5 Belkin International Inc
12.5.1 Company Overview
12.5.2 Financial
12.5.3 Products/ Services Offered
12.5.4 SWOT Analysis
12.6 Zhejiang Dahua Technology Co. Ltd
12.6.1 Company Overview
12.6.2 Financial
12.6.3 Products/ Services Offered
12.6.4 SWOT Analysis
12.7 D-Link Corporation
12.7.1 Company Overview
12.7.2 Financial
12.7.3 Products/ Services Offered
12.7.4 SWOT Analysis
12.8 GeoVision Inc
12.8.1 Company Overview
12.8.2 Financial
12.8.3 Products/ Services Offered
12.8.4 SWOT Analysis
12.9 Hangzhou Hikvision Digital Technology Co. Ltd.
12.9.1 Company Overview
12.9.2 Financial
12.9.3 Products/ Services Offered
12.9.4 SWOT Analysis
12.10 Honeywell International Inc
12.10.1 Company Overview
12.10.2 Financial
12.10.3 Products/ Services Offered
12.10.4 SWOT Analysis
13. Use Cases and Best Practices
14. Conclusion
An accurate research report requires proper strategizing as well as implementation. There are multiple factors involved in the completion of good and accurate research report and selecting the best methodology to compete the research is the toughest part. Since the research reports we provide play a crucial role in any company’s decision-making process, therefore we at SNS Insider always believe that we should choose the best method which gives us results closer to reality. This allows us to reach at a stage wherein we can provide our clients best and accurate investment to output ratio.
Each report that we prepare takes a timeframe of 350-400 business hours for production. Starting from the selection of titles through a couple of in-depth brain storming session to the final QC process before uploading our titles on our website we dedicate around 350 working hours. The titles are selected based on their current market cap and the foreseen CAGR and growth.
The 5 steps process:
Step 1: Secondary Research:
Secondary Research or Desk Research is as the name suggests is a research process wherein, we collect data through the readily available information. In this process we use various paid and unpaid databases which our team has access to and gather data through the same. This includes examining of listed companies’ annual reports, Journals, SEC filling etc. Apart from this our team has access to various associations across the globe across different industries. Lastly, we have exchange relationships with various university as well as individual libraries.
Step 2: Primary Research
When we talk about primary research, it is a type of study in which the researchers collect relevant data samples directly, rather than relying on previously collected data. This type of research is focused on gaining content specific facts that can be sued to solve specific problems. Since the collected data is fresh and first hand therefore it makes the study more accurate and genuine.
We at SNS Insider have divided Primary Research into 2 parts.
Part 1 wherein we interview the KOLs of major players as well as the upcoming ones across various geographic regions. This allows us to have their view over the market scenario and acts as an important tool to come closer to the accurate market numbers. As many as 45 paid and unpaid primary interviews are taken from both the demand and supply side of the industry to make sure we land at an accurate judgement and analysis of the market.
This step involves the triangulation of data wherein our team analyses the interview transcripts, online survey responses and observation of on filed participants. The below mentioned chart should give a better understanding of the part 1 of the primary interview.
Part 2: In this part of primary research the data collected via secondary research and the part 1 of the primary research is validated with the interviews from individual consultants and subject matter experts.
Consultants are those set of people who have at least 12 years of experience and expertise within the industry whereas Subject Matter Experts are those with at least 15 years of experience behind their back within the same space. The data with the help of two main processes i.e., FGDs (Focused Group Discussions) and IDs (Individual Discussions). This gives us a 3rd party nonbiased primary view of the market scenario making it a more dependable one while collation of the data pointers.
Step 3: Data Bank Validation
Once all the information is collected via primary and secondary sources, we run that information for data validation. At our intelligence centre our research heads track a lot of information related to the market which includes the quarterly reports, the daily stock prices, and other relevant information. Our data bank server gets updated every fortnight and that is how the information which we collected using our primary and secondary information is revalidated in real time.
Step 4: QA/QC Process
After all the data collection and validation our team does a final level of quality check and quality assurance to get rid of any unwanted or undesired mistakes. This might include but not limited to getting rid of the any typos, duplication of numbers or missing of any important information. The people involved in this process include technical content writers, research heads and graphics people. Once this process is completed the title gets uploader on our platform for our clients to read it.
Step 5: Final QC/QA Process:
This is the last process and comes when the client has ordered the study. In this process a final QA/QC is done before the study is emailed to the client. Since we believe in giving our clients a good experience of our research studies, therefore, to make sure that we do not lack at our end in any way humanly possible we do a final round of quality check and then dispatch the study to the client.
Key Segments:
By Component
Hardware
Services
By Product Type
Fixed
Pan-Tilt-Zoom (PTZ)
Infrared
By Connection Type
Consolidated
Distributed
By End Use
Residential
Commercial
Government
Request for Segment Customization as per your Business Requirement: Segment Customization Request
REGIONAL COVERAGE:
North America
US
Canada
Mexico
Europe
Eastern Europe
Poland
Romania
Hungary
Turkey
Rest of Eastern Europe
Western Europe
Germany
France
UK
Italy
Spain
Netherlands
Switzerland
Austria
Rest of Western Europe
Asia Pacific
China
India
Japan
South Korea
Vietnam
Singapore
Australia
Rest of Asia Pacific
Middle East & Africa
Middle East
UAE
Egypt
Saudi Arabia
Qatar
Rest of the Middle East
Africa
Nigeria
South Africa
Rest of Africa
Latin America
Brazil
Argentina
Colombia
Rest of Latin America
Request for Country Level Research Report: Country Level Customization Request
Available Customization
With the given market data, SNS Insider offers customization as per the company’s specific needs. The following customization options are available for the report:
Product Analysis
Criss-Cross segment analysis (e.g. Product X Application)
Product Matrix which gives a detailed comparison of the product portfolio of each company
Geographic Analysis
Additional countries in any of the regions
Company Information
Detailed analysis and profiling of additional market players (Up to five)
The Interactive Tables Market was valued at USD 1.43 Billion in 2023 and is expected to reach USD 3.01 Billion by 2032 and grow at a CAGR of 8.66% over the forecast period 2024-2032.
The Human Machine Interface Market Size was USD 5.59 Billion in 2023 and will reach USD 12.49 Billion by 2032 and grow at a CAGR of 9.54% by 2024-2032.
The Super Hi-Vision Market size was valued at USD 61.2 Bn in 2023 and is expected to reach USD 409.92 Bn by 2032 and grow at a CAGR of 23.53% over the forecast period 2024-2032.
Inspection and Maintenance Robot Market was valued at USD 41.66 billion in 2023 and is expected to reach USD 150.03 billion by 2032, and grow at a CAGR of 15.3% over the forecast period 2024-2032.
The Smart Lighting Market Size was valued at USD 11.95 billion in 2023, and is expected to reach USD 40.09 billion by 2032, and grow at a CAGR of 14.44% over the forecast period 2024-2032.
The Automation Control Components and Devices Market Size was valued at USD 74.09 billion in 2023 and is expected to reach USD 197.35 billion by 2032 and grow at a CAGR of 11.5% over the forecast period 2024-2032.
Hi! Click one of our member below to chat on Phone