Near-Eye Display Market Size & Overview:
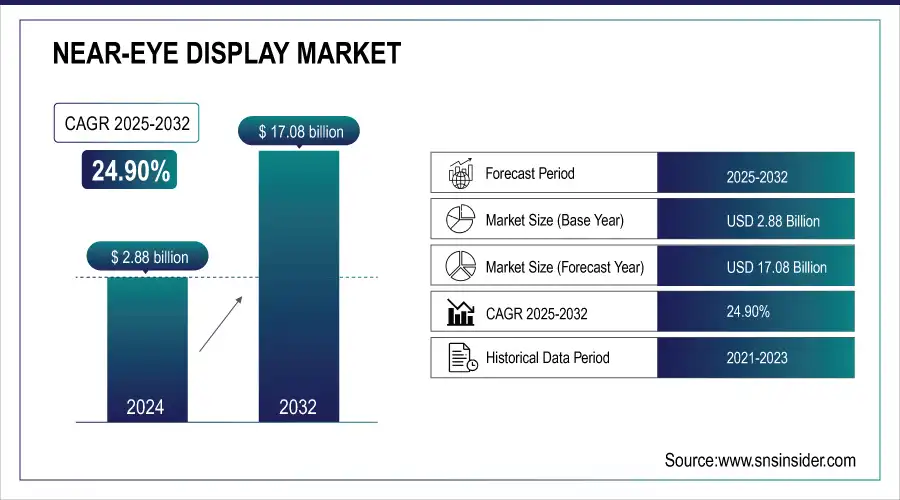
The Near-Eye Display Market Size was valued at USD 2.88 Billion in 2024 and is expected to grow at a CAGR of 24.90% to reach USD 17.08 Billion by 2032.
The Near-Eye Display Market has witnessed unprecedented developments in recent times, which has been largely fuelled by advances in augmented reality (AR) and virtual reality (VR) technologies. Amongst the developed countries, the significant contributors include Japan, China, the USA, France, Germany, and India. The governmental initiatives, which have driven Near-Eye Display adoption, were largely experienced in the years 2023 and 2024. For instance, "Digital Japan Initiative" emphasizes the use of advanced technologies, such as AR/VR, in public infrastructure and education, while the "Made in China 2025" has focused on developing high-tech displays.
Get more information on Near-Eye Display Market - Request Sample Report
In the United States, the government has promoted AR/VR applications in defense and healthcare for training and surgical assistance. For example, OLED specialist, OLEDWorks has agreed on a deal with the Department of Defense, USA placing the U.S. Army at the head of a project in which the two will jointly develop a thin screen for use in augmented and virtual reality (AR/VR) glasses. The Army is investing USD 8.6 million into the effort, which draws upon OLEDWorks' "multi-stack" OLED technology. The multi-stack approach is much brighter than single-stack or double-stack screens and will therefore significantly increase the efficacy of the screen in daylight.
Technological advancement has also boosted the Near-Eye Display Market. MicroLED and OLED technologies are now integral to high-quality near-eye displays, providing greater brightness, contrast, and energy efficiency. Holographic displays and waveguide technology have further improved user immersion and addressed key challenges in AR/VR adoption.
This type of integration in healthcare, education, and automotive industries is opening the road for growth. Germany is adopting AR-based training modules in its automotive sector, while Indian hospitals are looking forward to the possibility of using VR-guided surgical procedures. The lines are open to significant opportunities as AI and machine learning will create smarter and more interactive interfaces.
Market Size and Forecast:
-
Market Size in 2024 USD 2.88 Billion
-
Market Size by 2032 USD 17.08 Billion
-
CAGR of 24.90% From 2025 to 2032
-
Base Year 2024
-
Forecast Period 2025-2032
-
Historical Data 2021-2023
Near-Eye Display Market Trends:
-
Rising consumer interest in AR/VR devices driven by near-eye display technology.
-
Government support in countries like the U.S., China, India, Japan, and Germany promoting AR/VR adoption across healthcare, education, and defense.
-
Increasing use of AR-assisted surgeries, improving precision and reducing errors in medical procedures.
-
Growth of the VR gaming industry, with revenues projected to exceed USD 20 billion by 2024.
-
Expansion of wearable electronics, particularly smart glasses, driven by lightweight, high-resolution, and affordable next-generation displays.
Near-Eye Display Market Growth Drivers:
-
Near-Eye Displays Driving AR/VR Adoption across Industries by 2024
By 2024, many consumers have shown interest in AR/VR devices, with the near-eye display becoming the primary driving factor for such technology. The development of AR/VR has also received significant backing from governments, especially from countries like the U.S. and China, towards its implementation in various sectors like education, health care, and defense.
AR-assisted surgeries through near-eye displays in healthcare have also surged in 2023, cutting error rates and making the surgeries much more precise. A study at the Hospital for Special Surgery (HSS) compared robot-assisted navigation (RAN) and augmented reality (AR) in spinal surgery, highlighting excellent accuracy and safety for pedicle screw placement. Over 1.2 million spinal surgeries are performed annually in the U.S., with AR showing superior precision compared to conventional methods.
The gaming industry is also going to continue its growth, and VR gaming revenues are expected to reach more than USD 20 billion in 2024, increasing the demand for high-quality displays.
Near-Eye Display Market Restraints:
-
High Production Costs And Limited Infrastructure Hinder Widespread Adoption Of Near-Eye Display Technologies
The limiting factor for near-eye displays is the cost of producing advanced technologies. Such expensive advanced display technologies limit their diffusion. Near-eye displays make use of complex components involving microLEDs, OLEDs, and high-performance image generators that need one of the world's best facilities and significant investments. It has resulted in higher prices at retail levels; AR glasses costs around USD 1,500 in 2023, making large-scale adoption unfeasible.
There is also a lack of mass manufacturing infrastructure in emerging economies, which limits the expansion of the market. Countries like China and the U.S. are leading in production, but regions like Africa and parts of Southeast Asia are facing affordability and access issues. Governments in developing nations have not yet implemented subsidies or support schemes for AR/VR technologies. The cost barriers for these will be addressed to unlock the potential of near-eye displays for a wider audience, thus ensuring equitable growth across global markets.
Near-Eye Display Market Segment Analysis:
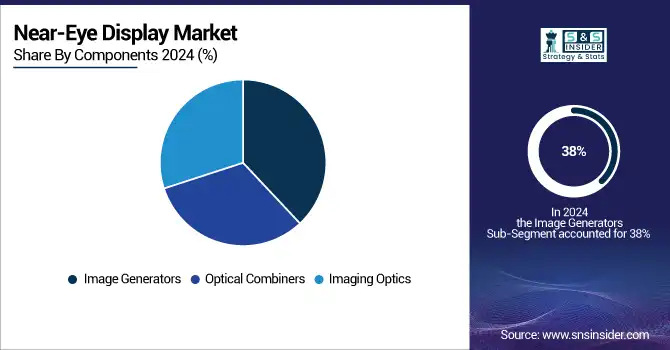
By Components
The Image Generators segment held the largest market share in 2024, accounting for 38% of the market, as they play a crucial role in generating high-quality images for AR and VR devices. These components have seen tremendous advancements, especially in microOLED and microLED technologies, which provide better brightness and resolution.
Optical Combiners segment will experience fastest growth, with an anticipated CAGR of 25.05% in the forecasted period of 2025-2032. Combiners are vital elements used in creating transparent visual experiences because they integrate physical and digital elements in AR-based applications. Emerging holographic and waveguide-based optical combiner developments are propelling this growth. Increasing adoption of smart glasses in the industrial and consumer sectors accelerates demand for high-performance optical components. The categorization demonstrates a shift in focus for NED technology-from solely immersive to hybrid, immersive as well as functionally versatile experiences.
By Industry
The Consumer segment was a market leader in 2024, with 35% market share, bolstered by VR headsets and AR-enabled smart glasses for gaming and entertainment. The commitment to lightweight, high resolution, and increased field of view has created growth momentum among consumers worldwide, but primarily from the Japanese and the U.S. market.
The Medical segment will grow at a fastest CAGR of 26.06% from 2025 to 2032. Near-eye displays are revolutionizing healthcare through AR-guided surgeries, diagnostics, and training modules. In 2024, more than 15% of global hospitals will adopt AR/VR solutions and be supported with government funding across countries like Germany and India. This growth clearly underlines that near-eye displays possess the potential of transforming critical sectors and ensuring much better outcomes for efficiency across most industries.
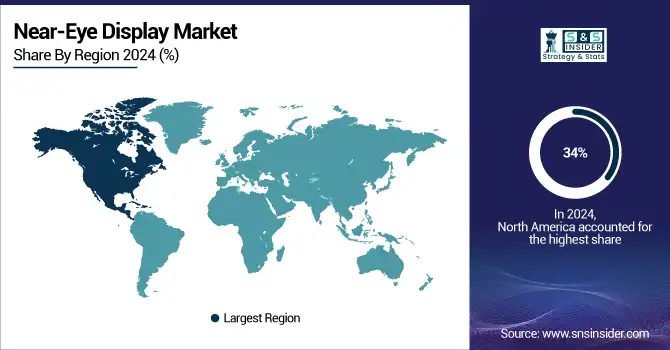
Near-Eye Display Market Regional Analysis:
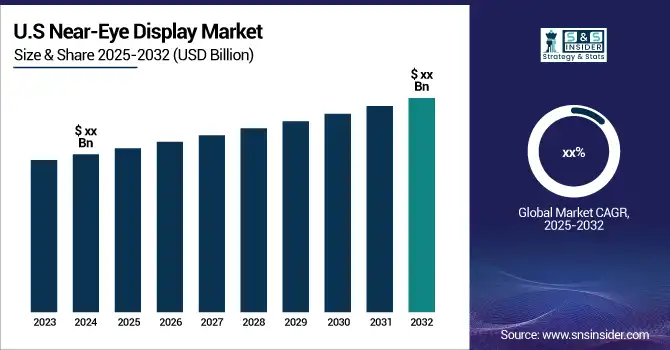
North America Near-Eye Display Market Insights
North America was the largest in 2024, holding 34% of the market share, primarily because of the early adoption of AR/VR technologies and support from government initiatives such as the U.S. Department of Defense's investments in immersive training tools.
Need any customization research on Near-Eye Display Market - Enquiry Now
Asia Pacific Near-Eye Display Market Insights
The Asia-Pacific region is expected to grow the fastest, with a CAGR of 25.51% from 2025 to 2032. Growth in this region is being spurred by increased consumer electronics demand in China, Japan, and India, along with significant government incentives for tech innovation. Initiatives such as China's 5G rollout and India's "Digital India" program are further fueling adoption. The regional analysis showcases a great outlook for near-eye displays; such demand along with innovation provides sustainable growth on the global map.
Europe Near-Eye Display Market Insights
Europe’s near-eye display market is driven by strong adoption in healthcare, defense, education, and gaming sectors. Government support, technological advancements, and increasing consumer awareness of AR/VR devices boost growth. The region focuses on high-resolution, lightweight, and energy-efficient displays, with countries like Germany, France, and the UK leading in both development and deployment of near-eye display technologies.
Latin America (LATAM) and Middle East & Africa (MEA) Near-Eye Display Market Insights
The LATAM and MEA near-eye display markets are growing steadily, driven by rising interest in AR/VR applications in gaming, healthcare, and industrial training. Government incentives, emerging tech hubs, and increasing consumer adoption support expansion. Limited local manufacturing encourages imports, while innovation in high-resolution, lightweight displays creates opportunities for market growth across these regions.
Near-Eye Display Market Key Players:
Some of the Near-Eye Display Market Companies are
-
Sony Corporation (AR Glasses, OLED Microdisplays)
-
Samsung Electronics (VR Headsets, AMOLED Displays)
-
Microsoft Corporation (HoloLens, AR Development Software)
-
Google LLC (Google Glass, ARCore)
-
Apple Inc. (Vision Pro, AR Development Framework)
-
Magic Leap (AR Headsets, AR Content Development)
-
Meta Platforms, Inc. (Quest VR Headsets, Horizon Workrooms)
-
HTC Corporation (Vive VR Devices, VR Gaming Solutions)
-
Vuzix Corporation (AR Smart Glasses, Enterprise Wearables)
-
Panasonic Corporation (VR Goggles, MicroLED Displays)
-
NVIDIA Corporation (Graphics Cards, AI Solutions for AR/VR)
-
Intel Corporation (Silicon Chips, AR/VR Platforms)
-
Himax Technologies (LCOS Displays, Waveguides)
-
Kopin Corporation (Microdisplays, Imaging Optics)
-
BOE Technology Group (Flexible OLED Displays, AR Screens)
-
LG Display (OLED Panels, Transparent Displays)
-
WaveOptics (Waveguide Optics, Optical Engines)
-
eMagin Corporation (OLED Microdisplays, Augmented Vision Systems)
-
MicroVision (LBS Technology, Pico Projectors)
-
Lumus (Optical Waveguides, AR Lenses)
Major Suppliers (Components, Technologies)
-
Corning Incorporated (Specialty Glass, Optical Components)
-
SCHOTT AG (Optical Glass, Laser Components)
-
Asahi Glass Co., Ltd. (Display Glass, Transparent Substrates)
-
Universal Display Corporation (OLED Materials, Phosphorescent Emitters)
-
Applied Materials, Inc. (Semiconductor Equipment, Display Technologies)
-
JSR Corporation (Photoresists, Display Materials)
-
Sumitomo Chemical (Optical Polymers, OLED Materials)
-
Merck Group (Liquid Crystals, OLED Chemicals)
-
3M Company (Optical Films, AR Reflective Materials)
-
Nitto Denko Corporation (Display Films, Adhesive Solutions)
Competitive Landscape for Near-Eye Display Market:
Sony Semiconductor Solutions Corporation (SSS) is a leading provider of advanced imaging and display technologies, including near-eye displays for AR and VR applications. The company focuses on high-resolution, lightweight, and energy-efficient solutions, enabling enhanced visual experiences in gaming, healthcare, and industrial applications. SSS’s innovation and expertise position it as a key player in the growing near-eye display market.
-
September 2024: Sony Semiconductor Solutions Corporation (SSS) has today announced the latest addition to their family of ECX Microdisplay products: a new 0.44-inch Full HD OLED Microdisplay named the ECX350F. This display marks a new world record in two areas: both pixel density at 5.1 µm (approximately 5,000 ppi), and peak brightness at up to 10,000 cd/m².
Samsung Display is a global leader in advanced display technologies, specializing in high-resolution, AMOLED, and flexible panels for near-eye applications in AR and VR devices. The company’s innovations enable lightweight, energy-efficient, and immersive visual experiences across gaming, healthcare, and industrial sectors. Samsung Display’s expertise and technological advancements position it strongly in the expanding near-eye display market.
-
August 2024: Samsung Display showcased a new OLED microdisplay at K-Display 2024, a 1.3" 12,000 nits 4000 PPI display. It is not known if this is a direct-emission display or one using white OLEDs with color filters.
| Report Attributes | Details |
|---|---|
| Market Size in 2024 | USD 2.88 Billion |
| Market Size by 2032 | USD 17.08 Billion |
| CAGR | CAGR of 24.90% From 2025 to 2032 |
| Base Year | 2024 |
| Forecast Period | 2025-2032 |
| Historical Data | 2021-2023 |
| Report Scope & Coverage | Market Size, Segments Analysis, Competitive Landscape, Regional Analysis, DROC & SWOT Analysis, Forecast Outlook |
| Key Segments | • By Technology (Laser Beam Scanning, TFT LCD, LCoS, MicroLED, AMOLED, OLEDOS, DLP), • By Components (Image Generators, Imaging Optics, Optical Combiners), • By Device Type (AR Devices, VR Devices, Others), • By Industry (Consumer, Aerospace & Defense, Automotive, Medical, Others) |
| Regional Analysis/Coverage | North America (US, Canada), Europe (Germany, UK, France, Italy, Spain, Russia, Poland, Rest of Europe), Asia Pacific (China, India, Japan, South Korea, Australia, ASEAN Countries, Rest of Asia Pacific), Middle East & Africa (UAE, Saudi Arabia, Qatar, South Africa, Rest of Middle East & Africa), Latin America (Brazil, Argentina, Mexico, Colombia, Rest of Latin America). |
| Company Profiles | Sony Corporation, Samsung Electronics, Microsoft Corporation, Google LLC, Apple Inc., Magic Leap, Meta Platforms Inc., HTC Corporation, Vuzix Corporation, Panasonic Corporation, NVIDIA Corporation, Intel Corporation, Himax Technologies, Kopin Corporation, BOE Technology Group, LG Display, WaveOptics, eMagin Corporation, MicroVision, Lumus. |
Frequently Asked Questions
Ans: The Consumer segment dominated the Near-Eye Display Market.
Ans: The Near-Eye Display Market is expected to grow at a CAGR of 24.90% during 2025-2032.
Ans: The major growth factors of the Near-Eye Display Market are Increasing AR/VR Adoption and Growing Demand in Consumer Electronics.
Ans: North America dominated the Near-Eye Display Market in 2024.
Ans: Near-Eye Display Market Size was valued at USD 2.88 Billion in 2024 and is expected to grow at a CAGR of 24.90% to reach USD 17.08 Billion by 2032.
Get in Touch
