Microcarriers Market Report Scope & Overview:
The Microcarriers Market Size was valued at USD 1.8 Billion in 2023 and is expected to reach USD 4.5 billion by 2032, growing at a CAGR of 10.6% over the forecast period 2024-2032.

Get more information on Microcarriers Market - Request Sample Report
The microcarriers market is witnessing robust growth, primarily driven by the expanding demand for advanced biopharmaceutical production technologies and supportive government initiatives. For instance, the U.S. Food and Drug Administration (FDA) reported in its 2023 annual statistics that over 15% of newly approved biologics utilized microcarrier-based technologies during cell culture stages. Additionally, the European Medicines Agency (EMA) stated in a 2023 publication that biopharmaceutical advancements contributed to over $25 billion in revenue across the EU. These trends align with global initiatives to improve healthcare infrastructure and increase biologics production efficiency, such as the "Innovation in Biopharma Production Program" launched by the UK government in January 2023.
Another significant driver is the rising prevalence of chronic diseases, which necessitates the development of advanced biologics and cell therapies. According to the World Health Organization (WHO), non-communicable diseases accounted for 74% of all deaths globally in 2022, prompting increased investment in biopharmaceuticals. Furthermore, China’s Ministry of Science and Technology reported that the nation’s biotech sector grew by 20% in 2023, supported by a $10 billion allocation for biomanufacturing infrastructure. Similarly, India’s Department of Biotechnology announced in 2023 the establishment of five new biopharma clusters under its National Biopharma Mission, aiming to accelerate cell-based therapy production. Governments are also prioritizing workforce development and technological advancements. For instance, the U.S. Advanced Regenerative Manufacturing Institute (ARMI) received $80 million in federal funding in 2023 to develop scalable cell culture techniques, including microcarrier technologies.
Microcarriers Market Dynamics
Drivers
-
The demand for cell-based vaccines to address infectious diseases is boosting the need for microcarriers, enabling scalable and efficient vaccine manufacturing.
-
Microcarriers are integral to 3D cell cultures, providing a platform for creating complex, tissue-like structures vital for advanced research and therapy.
-
The rise in biopharmaceutical R&D, coupled with growing demand for monoclonal antibodies and biosimilars, drives microcarrier adoption for scalable cell culture.
Cell-based vaccine production is increasingly transitioning to microcarriers, due to the demand for increased efficiency and scalability of the vaccine manufacturing process. Microcarriers are small, polystyrene or glass-based particles that offer a bioreactor surface for proliferating anchorage-dependent cells. These technologies facilitate the production of vaccines both at large scale and in high efficiency by providing methods to culture cells at high density which, in turn, translate into larger volumes of vaccine into less time. One such prominent instance of this movement is the utilization of microcarriers for the COVID-19 vaccine manufacturing process. For instance, the production of the AstraZeneca COVID-19 vaccine relied on microcarriers for culturing the virus in mammalian cells. Microcarrier technology that supports high-density cell culture was applied to improve the production capacity of the vaccine, enabling the rapid production of millions of doses.
Furthermore, with the increasing incidence of infectious disease and the rise of cell-based vaccines, microcarriers allow for rapid and economical vaccine production. The worldwide avenge of vaccines clamored a lot in 2023, with worldwide use estimating more than 1.5 billion doses of COVID-19 vaccines worldwide in 2023, according to the World Health Organization, which required working generation methods (WHO). Microcarriers are expected to play a vital role in meeting this growing demand, offering scalable and reproducible systems for large-scale vaccine manufacturing.
Restraints:
-
The expensive nature of equipment, reagents, and processes limits the adoption of microcarriers, especially among smaller companies and academic institutions.
-
Serum-free media, preferred for its safety and consistency, is costly, making its adoption challenging for widespread use.
-
Scaling up high-density cell culture using microcarriers presents technical challenges, affecting its broader implementation.
The cost of serum-free media is one of the major restraints in the microcarriers market. In comparison with the conventional cell culture systems, the serum-free media offer a well-defined and controlled environment that largely overcomes the risk of contamination and has benefits at the clinical-requirements level. Nonetheless, offering serum-free media will be a more expensive process than conventional serum-containing media. Serum-free media, used for maternal embryonic stem (ES) and other stem cell lines, is generally very expensive due to the materials, formulations, and level of quality control required for production. As a result, it is not so affordable for smaller research labs, academic institutions, and start-up biopharma companies with limited budgets. Additionally, converting serum-containing to serum-free media often necessitates substantial optimization and testing, resulting in further time and capital investment. As a result, despite the advantages of serum-free media in terms of consistency and safety, its cost remains a barrier to widespread adoption in the microcarriers market.
Microcarriers Market Segment Analysis
By Consumable
In 2023, microcarrier beads accounted for the largest revenue share of the microcarriers market. This dominance is fueled by its high advantages in large-scale biopharma manufacturing techniques. Government statistics highlight their critical role in vaccine production, where the World Health Organization (WHO) noted a 30% increase in vaccine output in 2023 due to advancements in microcarrier bead technology. These beads can be made from dextran, gelatin, etc., and enable high-density cultures required for many modern biopharma processes with easily scalable performance achieved with high reproducibility. This is in line with growing government investments in biomanufacturing infrastructure, such as the $1.5 billion allocated by the U.S. government under the "Biomanufacturing Modernization Act" of 2023.
Likewise, the use of microcarrier beads offers solutions to fundamental issues for cell culture systems, such as improved viabilities, and reduced running costs. On the other hand, the National Institutes of Health (NIH) has demonstrated that per-batch production costs were reduced by a factor of 20 when comparing microcarrier bead systems. These reasons make microcarrier beads an essential component behind low-cost biopharmaceutical production.
By End Use
The largest market share 42% was held by the pharmaceutical & biotechnology companies segment in 2023. The rapid growth of this sector can be attributed to the rising interventions in R&D, as reported by the U.S. Department of Health and Human Services (HHS) which announced an additional $10 billion in funding for biotech research in 2023. In addition, government-sponsored collaborations like the "Biotech Advancement Partnership" have fostered accelerated innovations in cell-based therapies and biologics.
The critical role of microcarrier-based systems for the scale-up production of monoclonal antibodies, vaccines, and cell therapies within the pharmaceutical and biotech sector. The EMA approved more than 50 new cell-based products in the year 2023, most of them using this technology of microcarriers. This trend is a demonstration of the dependence of the sector on microcarriers for reproducibility, scalability, and regulatory compliance. The IFPMA states that the industry has also benefited from a 25% increase in manufacturing efficiency and a 15% decrease in production timelines due to the Industry's dependence on microcarriers.
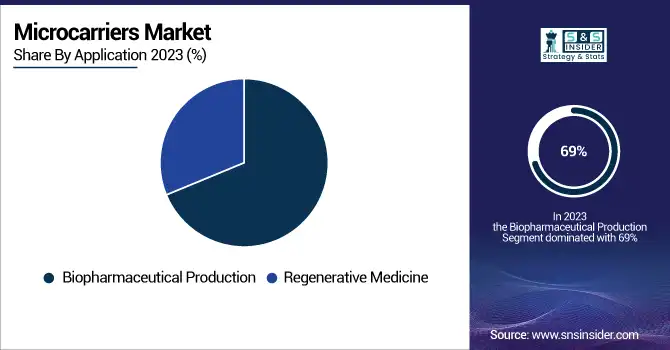
By Application
The biopharmaceutical production segment accounted for the highest market share of 69% in 2023. Microcarrier technology has been adopted widely in this segment due to it being unparalleled in terms of scalability of biologics production. The approval rates for biologics in the biopharmaceutical industry rose by 45% between 2015 and 2023, according to historical data from the U.S. FDA, attributed to improved production methods such as microcarrier-based systems.
Microcarriers have made significant contributions to monoclonal antibody and cell-based vaccine manufacturing, providing solutions to worldwide healthcare challenges such as COVID-19 and oncology. According to the WHO, microcarrier-assisted vaccine production contributed to the manufacture of over 5 billion doses globally in 2023, reflecting its role in meeting urgent demands.
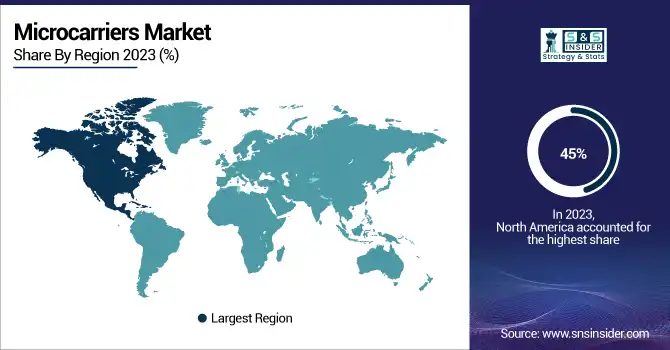
Microcarriers Market Regional Overview
North America dominated the global microcarriers market, accounting for around 45% of revenue share in 2023, owing to the higher prevalence of advanced healthcare infrastructure and greater government funding in this region. Recent years have seen vast progress in biopharmaceutical innovations, particularly in the United States where the National Institutes of Health (NIH) has provided $3.2 billion for funding biopharmaceutical research and development. Coupled with a strong regulatory environment and the presence of leading biopharma corporations, this spending propelled North America to market leadership. Furthermore, the well-established production facilities enable a constant supply of microcarriers for biopharmaceutical applications, such as cell therapy and vaccine production in the province.
Conversely, the Asia-Pacific region is experiencing rapid growth, with a significant CAGR during the forecast period. This pivotal step is catalyzed by governments backed by countries like China and India. Meanwhile, the Asian Development Bank (ADB) revealed biopharmaceutical investments in the region increased to 30% this year compared to last year, aligned with a strategic push for self-sufficiency in economic sectors such as health and vaccine production. The initiatives of China such as Made in China 2025 & India aim to expand the pharmaceutical sector have attracted domestic & foreign investment in biomanufacturing technologies. Additionally, the boom is also being driven by pro-business government policies like tax benefits for R&D and spending on biotech infrastructure. An increase in the local production of essential biopharmaceuticals, coupled with an expanding demand for vaccines, therapeutics, and innovative systems for the delivery of each of these drugs, is helping to support the region.
Need any customization research on Microcarriers Market - Enquiry Now
Recent News and Developments
-
Semarion, a biotechnology company developing innovative solutions for cell culture applications, launched the SemaCyte Microcarrier Platform Early Adopter Programme in October 2023. This program was designed to familiarize and promote their new microcarrier platform with the scientific and research community to early adopters.
-
Thermo Fisher Scientific (US) introduced a revolutionary platform called Gibco CTS Detachable Dynabeads, featuring an innovative active-release mechanism, for seamless integration into clinical and commercial cell therapy manufacturing in September 2023.
Key Players
Key Service Providers/Manufacturers
-
Thermo Fisher Scientific (Dynabeads, Thermo Scientific Microcarrier)
-
GE Healthcare (Cytodex, Microcarriers for Cell Culture)
-
Merck Group (Millicell, Cellvento)
-
Lonza Group (CliniMacs Prodigy, Procell)
-
Corning Incorporated (Corning CellBIND, Corning® Microcarrier Beads)
-
Cytiva (Gibco™ Microcarriers, Microcarrier Beads)
-
FUJIFILM Irvine Scientific (CellMax, Cellartis)
-
Roche Diagnostics (Roche Cell Culture, AccuGen)
-
Becton, Dickinson and Company (BD) (BD Falcon Microcarriers, BD Cell Gro)
-
Sartorius AG (Sartocell, Sartorius Cell Culture Media)
Key Users of Microcarriers
-
Pfizer Inc.
-
Johnson & Johnson
-
Novartis AG
-
Sanofi
-
Gilead Sciences
-
Amgen Inc.
-
Regeneron Pharmaceuticals
-
Bristol-Myers Squibb
-
Roche
-
Merck & Co.
| Report Attributes | Details |
|---|---|
| Market Size in 2023 | USD 1.8 Billion |
| Market Size by 2032 | USD 4.5 Billion |
| CAGR | CAGR of 10.6% From 2024 to 2032 |
| Base Year | 2023 |
| Forecast Period | 2024-2032 |
| Historical Data | 2020-2022 |
| Report Scope & Coverage | Market Size, Segments Analysis, Competitive Landscape, Regional Analysis, DROC & SWOT Analysis, Forecast Outlook |
| Key Segments | • By Product (Consumables, Media, Reagents, Microcarrier Beads, Other Consumables, Equipment, Bioreactors, Culture Vessels, Filtration and Separation Equipment, Cell Counters, Other Equipment) • By Cell Type (Stem Cells, Immune Cells, Other Cell Types) • By Application (Biopharmaceutical Production, Regenerative Medicine) • By End-use (Pharmaceutical & Biotechnology Companies, Contract Research Organizations & Contract Manufacturing Organizations, Academic & Research Institutes) |
| Regional Analysis/Coverage | North America (US, Canada, Mexico), Europe (Eastern Europe [Poland, Romania, Hungary, Turkey, Rest of Eastern Europe] Western Europe] Germany, France, UK, Italy, Spain, Netherlands, Switzerland, Austria, Rest of Western Europe]), Asia Pacific (China, India, Japan, South Korea, Vietnam, Singapore, Australia, Rest of Asia Pacific), Middle East & Africa (Middle East [UAE, Egypt, Saudi Arabia, Qatar, Rest of Middle East], Africa [Nigeria, South Africa, Rest of Africa], Latin America (Brazil, Argentina, Colombia, Rest of Latin America) |
| Company Profiles | Thermo Fisher Scientific, GE Healthcare, Merck Group, Lonza Group, Corning Incorporated, Cytiva, FUJIFILM Irvine Scientific, Roche Diagnostics, Becton, Dickinson and Company (BD), Sartorius AG, Quamma. |
| Key Drivers | • The demand for cell-based vaccines to address infectious diseases is boosting the need for microcarriers, enabling scalable and efficient vaccine manufacturing. • Microcarriers are integral to 3D cell cultures, providing a platform for creating complex, tissue-like structures vital for advanced research and therapy. |
| Restraints | • The expensive nature of equipment, reagents, and processes limits the adoption of microcarriers, especially among smaller companies and academic institutions. • Serum-free media, preferred for its safety and consistency, is costly, making its adoption challenging for widespread use. |
Get in Touch
