Near-infrared Imaging Market Size & Trends:
Get More Information on Near-infrared Imaging Market - Request Sample Report
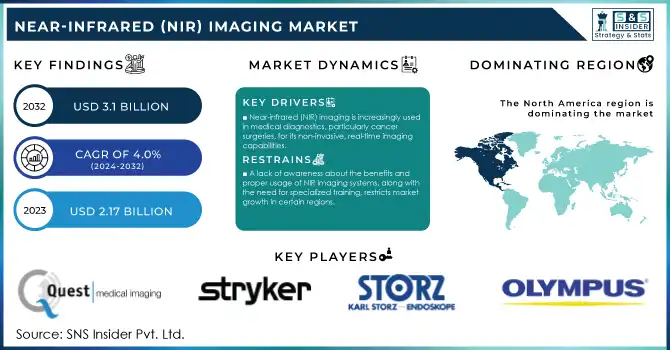
The Near-infrared (NIR) Imaging Market Size was valued at USD 2.17 Billion in 2023 and is expected to reach USD 3.1 billion by 2032, growing at a CAGR of 4.0% over the forecast period 2024-2032.
The global near-infrared (NIR) imaging market has experienced huge growth as government initiatives along with funding have fueled the growth of the NIR imaging market. In 2023, many governments have invested in research and development (R&D) in healthcare innovation, especially in medical imaging. In 2023, the U.S. National Institutes of Health (NIH) allocated about $5.5 billion to cancer research, most of which was directed towards early-stage detection technologies such as near-infrared imaging (NIR). The Horizon Europe program has allocated €2.2 billion for health-related R&D in Europe, a substantial portion of which focuses on NIR imaging technologies.
Governments also recognize the potential of NIR imaging in improving healthcare outcomes by enabling non-invasive and accurate diagnostic procedures. For example, multiple U.S. FDA-approved NIR imaging devices are available for use in clinical settings to visualize tumor marginalization and measure brain activity, and disease progression. This approval and support have led to technological progress and widespread adoption in the clinic and research. An expanding number of government health agencies are expected to continue driving the market forward, particularly with NIR reagents that are new tech with an increased number of approvals. Governmental regulators have established the standards of regulation for the use of NIR imaging technologies, which help to assure safety, efficacy, and quality control. These efforts are expected to continue driving the growth of the NIR imaging market across various regions.
Market Dynamics
Drivers
-
Near-infrared (NIR) imaging is gaining significant traction in medical diagnostics, especially for cancer surgeries, due to its non-invasive nature and ability to provide real-time imaging for better treatment decisions.
-
Continuous advancements in NIR imaging systems, such as the integration of fluorescence and bioluminescence technologies, are enhancing diagnostic accuracy and expanding their applications in various medical fields.
The rising application of near-infrared (NIR) imaging in medical diagnostics is one of the key drivers contributing to the growth of the near-infrared (NIR) imaging market especially in surgical applications. Utilising NIR imaging this is real-time, high-resolution, and non-invasive imaging, allowing surgical decisions to be made in a more informative manner for complex procedures. Due to the higher resolution for visualizing tissues (especially in differentiating cancerous and healthy tissues), it has become more conventional for use in several fields including cancer surgeries, cardiovascular surgeries, along with gastrointestinal surgeries.
For example, a paper published by Fluoptics discusses that NIR imaging improves accuracy in surgical-oriented oncology by providing fluorescent-image-guided tumor resections, which results in improved outcomes for patients. Systems like Fluobeam 800 have been incorporated into operating theaters to provide surgeons with accurate tumor margins during cancer surgeries, thereby decreasing recurrence rates. Moreover, NIR imaging can enhance the real-time imaging of vascular structures, thus facilitating the efficiency of reconstructive surgeries according to a recent study. Moreover, NIR imaging can enhance the real-time imaging of vascular structures, thus facilitating the efficiency of reconstructive surgeries. Not only the NIR imaging can improve the accuracy of these surgical strokes. They are also used in preclinical imaging, which is a crucial step of drug development workflow to enable clearer visualization of disease progression (and response to therapy) in animal models. This increasing utility of NIR imaging in clinical and research settings is anticipated to further propel its widespread adoption across the broad spectrum of medical specialties.
Restraints
-
The high upfront costs associated with acquiring and implementing NIR imaging systems, along with maintenance costs, may limit their adoption, particularly in low-resource healthcare settings.
-
A lack of awareness about the benefits and proper usage of NIR imaging systems, along with the need for specialized training, restricts market growth in certain regions.
The factor restraining the growth of the near-infrared imaging market is the high initial costs of equipment. The up-front investment needed for NIR imaging systems is high mainly because of complex hardware and software. Such technology costs can prevent smaller healthcare facilities or research laboratories from adopting these technologies. Routine maintenance, calibration, and potential upgrades only add to this cost burden. Hence, these technologies may get incorporated by bigger hospitals or institutions with good budget plans, but smaller clinics or facilities may lack the capital to incorporate these in any emerging market. This leaves a discontinuity in the adoption of NIR imaging in general, especially in resource-limited countries with low healthcare budgets or lack of funding for advanced diagnostic devices. That alone makes implementation costlier due to the high price and the specialization needs to train staff to use this system effectively.
Segmentation Analysis
By Product
The reagents segment accounted for the largest revenue share of 54% in the near-infrared imaging market in 2023 The dominance is primarily due to the importance of the reagents in enhancing the specificity and sensitivity of NIR imaging. They help to increase tissue contrast during imaging procedures and are critical for the detection and diagnosis of many conditions, such as cancer, neurological, and vascular diseases.
The market growth is also attributed to the government initiatives for the development and approval of near-infrared imaging reagents. Several new NIR imaging contrast agents have been approved by the U.S. FDA since 2023, which are one of the essential determinants to broaden the application scope of NIR imaging technologies. Such contrast agents enable improved imaging and real-time monitoring, thus playing a vital role in medical imaging. In addition, ongoing research projects funded by institutions like the NIH are aimed at creating next-generation agents that might yield optimal results with lower toxicity. The rising demand for accurate diagnostic tools in medical and research applications has propelled the market for reagents to new heights.
At the same time, the increasing healthcare costs worldwide have prompted the government to better diagnostic accuracy, thereby increasing demand for NIR reagents. The development and subsequent evolution of these reagents are expected to drive the market in the near future being that a constant state of innovation is likely to enhance the efficiency of medical imaging techniques.
By Application
The preclinical imaging segment was the largest application segment in 2023, with a share of 33% in terms of revenue. This segment's market share dominance and prominence can be explained by the increased focus on early-stage disease identification and drug discovery. Near-infrared technologies for preclinical imaging allow the non-invasive monitoring and assessment of disease progress in animal models, providing a unique opportunity to study the preclinical safety and efficacy of new therapeutic compounds before testing in humans.
Governments have had a big part in funding preclinical research, especially animal imaging, investing a huge amount of money into various studies. As an example in 2023, the US NIH National Cancer Institute (NCI) dedicated more than $3 billion to cancer research, some of which were directed towards the development of preclinical imaging technologies for accelerating cancer drug discovery. In addition, the European Commission has sponsored a large number of projects under Horizon 2020 focused on the development of innovative imaging technologies (NIR) employed in preclinical settings. These investments have pushed toward the development of preclinical imaging, leading to the broad application of NIR technology in research institutions and universities.
NIR imaging can supply both the high-resolution images required in small animal studies and is preferable over the use of harmful radiation, leading investigators to select this imaging modality for many preclinical applications when animal welfare and the requirement for precise statistics is a primary focus. This trend is projected to continue as governments promote additional developments in preclinical imaging modalities, and will keep this section dominating the near infra-red imaging market for the coming future.
By End-Use
The near-infrared imaging market was dominated by hospitals and clinics in 2023, attaining the largest revenue share accounting for about 43%. The growth in this segment is mainly attributed to the increasing adoption of non-invasive NIR imaging technologies for clinical diagnostics especially in the field of oncology, neurology, and vascular diseases. NIR imaging serves as a base for many applications nowadays due to the non-invasive, low-cost, and high-resolution diagnostic capabilities of NIR imaging in hospitals and clinics which enable early disease detection and patient follow-up.
To promote the integration of NIR imaging within healthcare systems, the government has played a vital role. As an example, the U.S. Centers for Medicare & Medicaid Services (CMS) has established for hospitals and clinics to start being reimbursed to perform advanced diagnostic imaging technologies, which include NIR-based techniques. As a result, healthcare providers have begun to integrate NIR imaging into their diagnostic protocols. In the same vein, European governments have financed projects that aim to borrow state-of-the-art imaging technologies to be part of public healthcare, making these technologies available to hospitals and clinics.
A rise in the availability of portable and user-friendly NIR imaging devices is another factor that will likely propel the growth of these devices in hospitals and clinics aside from government funding. These devices, often equipped with advanced reagents, enable healthcare providers to conduct real-time, accurate imaging at the point of care, thus improving patient outcomes and reducing healthcare costs. As governments continue to invest in healthcare infrastructure, the hospitals and clinics segment will likely maintain its dominant position in the near-infrared imaging market.
Regional Outlook
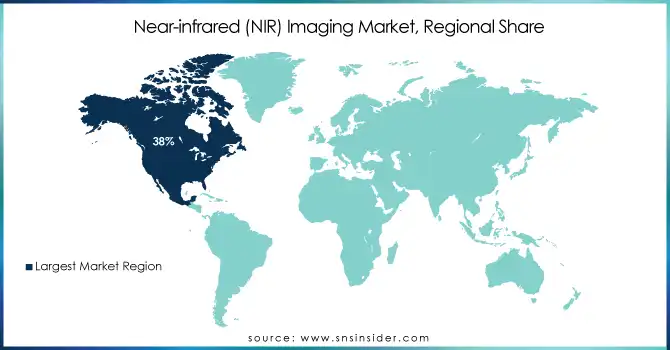
North America held the largest revenue share 38% in 2023. The market in this region was the largest owing to the presence of effective healthcare infrastructure, high healthcare expenditure, and the presence of key market players in this region. The market was led by the U.S., which accounted for a large portion of the global revenue. The growing use of advanced imaging technologies, favourable government support for medical research, and the conducive regulatory environment for NIR-based devices are the significant factors contributing to its dominance in the region. Furthermore, several NIR imaging devices were granted approvals by the U.S. FDA, which significantly contributed to the growth of the market in 2023.
On the other hand, the Asia-Pacific (APAC) region will grow with the highest CAGR during the forecast period. The increasing availability of healthcare infrastructure, rising healthcare spending, and improving adoption of imaging technologies in Asian countries such as China, Japan, and India are further propelling this growth. Government reports indicate that the healthcare market in China is expected to be achieving $1 trillion in market value by the year 2030 while NIR technologies will play an important role in medical imaging development. Moreover, the Government of India is also investing in the digitization of healthcare which is likely to augment opportunities for NIR imaging devices in hospitals and clinics traded here.
Get Customized Report as per Your Business Requirement - Request For Customized Report
Recent Developments
-
The European Commission announced a new funding opportunity in January 2024, planning to invest €25 million into the development of novel near-infrared imaging technologies. The funding, announced today, is part of the Horizon Europe program that facilitates partnerships to conquer the most pressing healthcare problems.
-
The NIR-D7000 was introduced by Olympus in April 2023 for medical and industrial applications.
-
Hamamatsu Photonics launched the NIR-A1200, a near-infrared camera for industrial and scientific applications, in March 2023.
-
In May 2023, PerkinElmer launched NIRQuest 5000, an imaging system for research and clinical applications.
Key Players
Key Service Providers/Manufacturers
-
Hamamatsu Photonics (NIR-A1200, ORCA-R2)
-
Olympus Corporation (NIR-D7000, AlphaTIRF)
-
PerkinElmer, Inc. (NIRQuest 5000, Vectra Polaris)
-
FLIR Systems, Inc. (A6780sc, T1020)
-
Teledyne DALSA (Calibir GXF, Z-Trak 3D)
-
Bruker Corporation (Alpha II, INVENIO R)
-
Thermo Fisher Scientific (DXR3, Nicolet iS50)
-
Edmund Optics Inc. (VSD NIR Camera, EO-1312M)
-
Raytheon Technologies Corporation (X8500sc, NightSight)
-
Carl Zeiss AG (ZEISS LSM 980, Axiocam 702 NIR)
Key Users
-
Siemens Healthineers
-
General Electric (GE Healthcare)
-
Philips Healthcare
-
Johnson & Johnson (Ethicon)
-
Medtronic plc
-
Abbott Laboratories
-
Boston Scientific Corporation
-
Roche Diagnostics
-
Stryker Corporation
-
Canon Medical Systems Corporation
| Report Attributes | Details |
|---|---|
| Market Size in 2023 | USD 2.17 Billion |
| Market Size by 2032 | USD 3.1 Billion |
| CAGR | CAGR of 4.0% From 2024 to 2032 |
| Base Year | 2023 |
| Forecast Period | 2024-2032 |
| Historical Data | 2020-2022 |
| Report Scope & Coverage | Market Size, Segments Analysis, Competitive Landscape, Regional Analysis, DROC & SWOT Analysis, Forecast Outlook |
| Key Segments | • By Product (Devices {Near-infrared Fluorescence Imaging Systems, Near-infrared Fluorescence & Bioluminescence Imaging Systems}, Reagents {Indocyanine Green (ICG), Other Reagents}) • By Application (Preclinical Imaging, Cancer Surgeries, Gastrointestinal Surgeries, Cardiovascular Surgeries, Plastic/Reconstructive Surgeries, Others) • By End-use (Hospitals & Clinics, Pharmaceutical & Biotechnology Companies, Research Laboratories) |
| Regional Analysis/Coverage | North America (US, Canada, Mexico), Europe (Eastern Europe [Poland, Romania, Hungary, Turkey, Rest of Eastern Europe] Western Europe] Germany, France, UK, Italy, Spain, Netherlands, Switzerland, Austria, Rest of Western Europe]), Asia Pacific (China, India, Japan, South Korea, Vietnam, Singapore, Australia, Rest of Asia Pacific), Middle East & Africa (Middle East [UAE, Egypt, Saudi Arabia, Qatar, Rest of Middle East], Africa [Nigeria, South Africa, Rest of Africa], Latin America (Brazil, Argentina, Colombia, Rest of Latin America) |
| Company Profiles | Hamamatsu Photonics, Olympus Corporation, PerkinElmer, Inc., FLIR Systems, Inc., Teledyne DALSA, Bruker Corporation, Thermo Fisher Scientific, Edmund Optics Inc., Raytheon Technologies Corporation, Carl Zeiss AG |
| Key Drivers | • Near-infrared (NIR) imaging is gaining significant traction in medical diagnostics, especially for cancer surgeries, due to its non-invasive nature and ability to provide real-time imaging for better treatment decisions. • Continuous advancements in NIR imaging systems, such as the integration of fluorescence and bioluminescence technologies, are enhancing the diagnostic accuracy and expanding their applications in various medical fields. |
| Restraints | • The high upfront costs associated with acquiring and implementing NIR imaging systems, along with maintenance costs, may limit their adoption, particularly in low-resource healthcare settings. |
Frequently Asked Questions
- Near-infrared (NIR) imaging is gaining significant traction in medical diagnostics, especially for cancer surgeries, due to its non-invasive nature and ability to provide real-time imaging for better treatment decisions?.
-
Continuous advancements in NIR imaging systems, such as the integration of fluorescence and bioluminescence technologies, are enhancing the diagnostic accuracy and expanding their applications in various medical fields?.
The Hospitals & Clinics end-use segment dominated the Near-infrared (NIR) imaging Market in 2023.
The CAGR of the Near-infrared (NIR) imaging Market is 4.0% During the forecast period of 2024-2032.
The North America region dominated the Near-infrared (NIR) imaging Market in 2023.
The projected market size for the Near-infrared (NIR) imaging Market is USD 3.1 Billion by 2032
Get in Touch
