P2P Antennas Market Size & Overview:
Get more Information on P2P Antennas Market - Request Sample Report
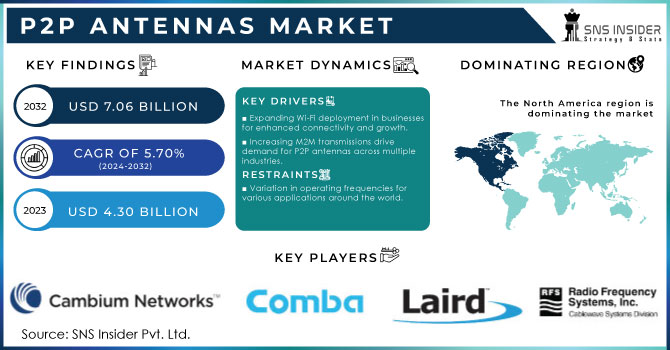
The P2P Antennas Market size was valued at USD 4.30 Billion in 2023. It is estimated to reach USD 7.06 Billion by 2032, growing at a CAGR of 5.70% during 2024-2032.
The point-to-point (P2P) antennas market has experienced significant growth in the past few years due to the increasing need for high-capacity wireless communication. These antennas are mainly created for establishing far-reaching, high-capacity wireless connections, which are essential for businesses needing reliable and fast data transfer across extended distances. The growing dependence on wireless communication infrastructure is a major factor driving the growth of the P2P antennas market. The wireless communication network in the United States is vast and crucial for ensuring connectivity throughout the country. By 2023, the United States had about 142,100 cell towers and 209,500 macrocell locations, with roughly 678,700 macrocell segments in use. Furthermore, there are 452,200 small cell nodes installed outdoors and 747,400 installed indoors to improve coverage and capacity. Monetarily, the sector spent around USD 11.9 billion on enhancements to infrastructure, while network operating costs totaled about USD 46 billion. Service providers and organizations are concentrating on constructing strong wireless networks due to the increasing number of smart devices, mobile internet usage, and data-intensive applications. P2P antennas provide a cost-efficient and reliable option for creating backhaul connections for mobile networks, ISPs, and enterprise networks. Their capacity to send information across vast distances without the use of physical wires is particularly advantageous in remote or hard-to-access areas, where traditional wired connections may be costly or not feasible.
P2P antennas are extensively employed in the broadcasting and media industries for live event coverage, remote broadcasting, and video transmission. For example, broadcasters have the option to utilize P2P antennas for sending high-definition video signals from a distant site, like a sports stadium or concert venue, to their main broadcasting station without experiencing any signal degradation. An important instance of broadcasters using P2P antennas for transmitting high-definition video signals occurred during the 2021 UEFA Champions League final, which took place at Estadio do Dragao in Porto, Portugal. At this event, broadcasters utilized P2P antenna technology to create a strong connection between the stadium and their main broadcasting station. This configuration allowed for uninterrupted, high-quality live video transmission with no loss of signal, allowing global audiences to watch the match as it happened. This feature is especially beneficial in live events where continuous, high-quality broadcast is crucial.
Point-to-Point Antennas Market Dynamics
Drivers
-
Expanding Wi-Fi deployment in businesses for enhanced connectivity and growth.
Expanding Wi-Fi deployment in businesses is a notable trend that signifies their strategic response to changing connectivity needs. Wi-Fi networks provide higher connectivity by allowing employees, as well as customers and visitors, to access the internet and internal networks from any point within the business premises. For instance, data can be transferred efficiently, enabling employees to collaborate and work productively. Scalability is another factor as many businesses continue to grow or adapt, consequentially requiring Wi-Fi deployment expansion to accommodate the heightened demands. An additional driver of these changes is the use of IoT devices that are increasingly being integrated with business systems. Without Wi-Fi for managing and working with such devices, businesses miss an opportunity to optimize operations and gain additional data insights. Moreover, in customer-facing industries, such as retail or hospitality, satisfying the market demand has also become a must for businesses that wish to remain competitive. The final factor, which also becomes truer with time, is the shift to remote and hybrid work models. With all or some of the business operations no longer anchored to a specific location, Wi-Fi infrastructure has become vital for ensuring adequate connectivity irrespective of the physical environment. Due to all of these reasons, expanding Wi-Fi deployment in businesses is an essential step that would help them survive in the digital age.
-
Increasing M2M transmissions drive demand for P2P antennas across multiple industries.
The primary driving factor for the P2P Antennas Market is the increasing number of M2M transmissions in various industry verticals. With the growing adoption in increased automation and number of connected devices, it is leading to surge in demand for fast and effective communication solutions. M2M transmissions facilitate direct transmission from one device to the other without the need of human assistance. Such type of communication is beneficial in terms of saving time incompetency, cost, and impact of human errors. For instance, in the manufacturing sector, M2M transmissions are used for monitoring various machines and quickly diagnosing the problem if any. In the logistics sector, the delivery trucks are connected to the central system using M2P antennas through GPS devices that help in finding the exact location of the shipment, optimizing the route, and ensuring the timely delivery. Unlike, P2P antennas, the P2P antennas are used in transmitting the relevant data for the operations. Similarly, in the healthcare sector, the remote monitoring of the health of the patient is done using the P2P antennas which transmits and share the health vital data to the assigned medical staff. This helps in the immediate attendance of medical aid in case of emergency.
Restraints
-
Variation in operating frequencies for various applications around the world.
One of the major restraining factors for the P2P Antennas Market is the varying frequencies for the operation of this technology across the world and applications. In different countries, regulators have allocated different frequencies for use or to manage the spectrum. As such, P2P antenna deployment cannot be uniform across all regions. For instance, the frequencies allocated for industrial, scientific, and medical applications in the United States may differ in a significant degree from those allocated across Europe and Asia. These variations have made it difficult to implement standards across all equipment and the technology used. Different sectors use different frequency bands for their operations, which also vary across the different regions of the world. This condition has considerably affected international communications, especially for multinational corporations that must ensure that their equipment operation in a specific region is compliant with basic industry standards. An example is the telecommunications companies that deploy microwave P2P antennas for backhaul in urban and rural areas, with P2P antennas licensed by the spectrum. Such deployment usually suffers from a high cost and delayed implementation in some areas because of different licenses of the spectrum.
P2P Antennas Market Segmentation
BY TYPE
Parabolic antennas had a major market share of over 42% in 2023 and therefore it led the market segment. These are commonly used in long-range communication due to their highly focused signal and ability to direct energy in a specific direction. These antennas are perfect for microwave and satellite communications, providing excellent gain and high-frequency capability. Their prevalence comes from their widespread application in communication towers, ground stations for satellites, and mobile network microwave backhaul. Huawei utilizes parabolic antennas in its base stations for efficient data transmission at high speeds. Their effectiveness for rural and remote connectivity projects stems from their ability to work efficiently over long distances.
Flat panel antennas, known for being small and light, are supposed to become the fastest-growing market during 2024-2032 because they are easy to install and can transmit large amounts of data over shorter distances. The market growth is driven by their quick acceptance in cities, as well as IoT and 5G infrastructure. Cambium Networks utilizes flat panel antennas for providing wireless broadband and enterprise networking solutions. The attractiveness of this section lies in its compatibility with crowded, high-traffic urban locations where space utilization is essential.
BY FREQUENCY RANGE
The 1 GHz to 9.9 GHz segment, which is widely used in communication systems, dominated the market with a 45% market share in 2023. This frequency band is ideal for transmitting data over long distances, such as through mobile networks, satellite connections, and Wi-Fi. Its capability to navigate obstacles renders it appropriate for use in urban and rural settings. Moreover, the growth in this sector is being propelled by the rising need for mobile internet access and the implementation of 5G networks. Enterprises like Cisco use antennas in this frequency band for their networking solutions, providing dependable connections in both outdoor and indoor settings.
The 10 GHz to 29.9 GHz is accounted to experience the most rapid growth rate in the P2P Antennas Market during 2024-2032, due to advancements in high-capacity communication technologies. This frequency band enables faster data speeds and better capacity, making it well-suited for millimeter-wave backhaul, fixed wireless access, and high-frequency trading systems. With the increasing need for fast internet and quick-response applications, more companies are incorporating this technology into their operations. Hughes Network Systems and MikroTik utilize antennas in this frequency range for different Parabolic Antenna, like satellite and broadband, and point-to-point links to enhance data transmission speed and efficiency.
BY POLARIZATION
Single-polarized antennas generated the major revenue for the market in 2023, by dominating the market with 56% market share in 2023. These antennas are created for transmitting and receiving signals in a single polarization, which can be either vertical or horizontal. This particular kind of antenna is commonly utilized in a variety of applications because of its straightforwardness and efficiency in sustaining a reliable communication connection. Single-polarized antennas are cost-effective and favored by many operators, particularly in low signal interference scenarios. For example, corporations such as Cisco and Hewlett Packard Enterprise use single-polarized antennas in their wireless communication systems, providing dependable connectivity for a range of settings, from corporate networks to outdoor scenarios.
Dual-polarized antennas are going to be the fastest-growing market during 2024-2032. This function allows them to enhance signal quality and data transmission rates by reducing multipath interference, making them very efficient in urban and crowded settings. With the increasing need for fast data transmission, dual-polarized antennas are the most rapidly growing sector in the market for P2P antennas. Major corporations like Ericsson and Nokia use dual-polarized antennas in their 5G network systems to improve user experiences with faster data speeds and more stable connections.
Point-to-Point Antennas Market Regional Analysis
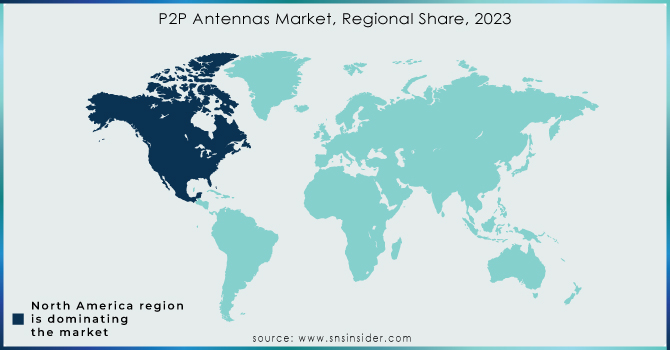
North America held a major market share of 41% in 2023 and dominated the market due to advanced infrastructure, widespread use of wireless communication technologies, and substantial investment in 5G networks. The mature telecommunications industry in the region, along with an increasing need for high-speed data transmission, strengthens its position in the market. Corporations like CommScope, Cambium Networks, and Laird Connectivity offer P2P antenna solutions for a variety of industries including telecommunications, defense, and industrial automation. The area's emphasis on building smart cities, increasing cellular backhaul, and integrating the Internet of Things (IoT) continues to drive the need for P2P antennas, strengthening its leading position.
Asia-Pacific is accounted to be a rapidly growing region during the forecast period 2024-2032 due to increasing urbanization, the expansion of 5G networks, and rising demand for high-speed internet are driving the growth of the P2P antenna market in APAC. China, India, and Japan are at the forefront of telecom infrastructure development. Companies like Huawei, ZTE, and Ericsson play a big role in installing P2P antennas for uses such as remote communication, mobile backhaul, and network growth, especially in rural locations.
Need any customization research on P2P Antennas Market - Enquiry Now
Key Players
The key players in the P2P Antennas market are:
-
Cambium Networks(PMP 450i PTP Antenna, PTP 820c)
-
Mimosa Networks (B5c PTP Backhaul, C5x PTP)
-
RADWIN (RADWIN 2000 Alpha, Jet DUO Antenna)
-
Laird Connectivity(SHX2400P Omni Antenna, PAR24-19 Panel Antenna)
-
TP-Link (TL-ANT2424B Parabolic Antenna, TL-ANT5830MD Parabolic Antenna)
-
PCTEL (FP2458 Dual-Band Panel Antenna, MLPV460 Mobile Antenna)
-
MTI Wireless Edge (MT-486042/NVH Parabolic Antenna, MT-402020/NVH)
-
CommScope (PX6515 Antenna, UHX50 Parabolic Antenna)
-
Infinite Electronics (AFH24G24-WB Parabolic Antenna, ANF-7.5G-PTP)
-
KP Performance Antennas (KPPA-5GHZ-DP Dish Antenna, KPPA-2.4GHz Yagi Antenna)
-
Ericsson (MINI-LINK 6352, AIR 3246)
-
Rosenberger (SP14 Antenna, RRH32 Antenna)
-
Amphenol Antenna Solutions (DualPol Parabolic Antenna, APD8-32 Antenna)
-
Proxim Wireless (Tsunami MP-10100 Antenna, Tsunami QB-10100 Antenna)
-
MicroTik (RBLHGG-5acD Antenna, RB911G PTP Antenna)
-
Alvarion (BreezeNET B100, BreezeACCESS VL)
-
Trango Systems (GigaLINK 6450, ApexPlus PTP Antenna)
-
Procom (CXL 900-3/L Antenna, CXL 70-3/L)
-
RF Elements (UltraDish TP 550, UltraHorn TP 5-24)
Recent Development
-
September 2024: Huawei has unveiled its Alpha line-up in the Global Antenna Technology & Industry Forum, which integrates cutting-edge digital competencies and high efficiency. Deliberately developed to satisfy the demanding requirements of the mobile AI era, the Alpha series offers robust performance across many network scenarios.
-
January 2024: ZTE has announced the release of a novel P2P antenna featuring advanced beamforming capabilities, which significantly diversifies the user experience by providing a more consistent connection amid dense populations.
-
October 2023: Nokia has introduced enhancements to its P2P antenna central technology, furthering its capacity related to 5-G network provision: the modifications associated with the uplink processing and the minimization of interface diminish latency.
-
August 2023: Cobra Technologies has featured a P2P antenna revolving around the notion of signal direction improvement aiming at better quality across significant lengths: the development is principally targeted at the rural deployment of broadband Parabolic Antenna.
-
April 2023: Sierra Wireless has introduced a multi-band P2P antenna dedicated to assorted mobile devices and integrating sufficient flexibility to be deployed in diverse frequency ranges.
| Report Attributes | Details |
|---|---|
| Market Size in 2023 | USD 4.30 Billion |
| Market Size by 2032 | USD 7.06 Billion |
| CAGR | CAGR of 5.70% From 2024 to 2032 |
| Base Year | 2023 |
| Forecast Period | 2024-2032 |
| Historical Data | 2020-2022 |
| Report Scope & Coverage | Market Size, Segments Analysis, Competitive Landscape, Regional Analysis, DROC & SWOT Analysis, Forecast Outlook |
| Key Segments | • By Type (Flat Panel Antenna, Parabolic Antenna, Yagi Antenna) • By Frequency Range (1 GHz To 9.9 GHz, 10 GHz To 29.9 GHz, 30 GHz To 86 GHz) • By Diameter (0.2m To 0.9mm, 1.0m To 3.0m, 3.1m To 4.6m) • By Polarization (Single-Polarized Antenna, Dual-Polarized Antenna) • By Application (Telecommunication, Military, And Defense, Commercial/Industrial, Satellite, Others) |
| Regional Analysis/Coverage | North America (US, Canada, Mexico), Europe (Eastern Europe [Poland, Romania, Hungary, Turkey, Rest of Eastern Europe] Western Europe] Germany, France, UK, Italy, Spain, Netherlands, Switzerland, Austria, Rest of Western Europe]), Asia Pacific (China, India, Japan, South Korea, Vietnam, Singapore, Australia, Rest of Asia Pacific), Middle East & Africa (Middle East [UAE, Egypt, Saudi Arabia, Qatar, Rest of Middle East], Africa [Nigeria, South Africa, Rest of Africa], Latin America (Brazil, Argentina, Colombia, Rest of Latin America) |
| Company Profiles | Cambium Networks, Ubiquiti Networks, Mimosa Networks, RADWIN, Laird Connectivity, TP-Link, PCTEL, MTI Wireless Edge, CommScope, Infinite Electronics, KP Performance Antennas, Ericsson, Rosenberger, Amphenol Antenna Solutions, Proxim Wireless, MicroTik, Alvarion, Trango Systems, Procom, RF Elements |
| Key Drivers | • Expanding Wi-Fi deployment in businesses for enhanced connectivity and growth. • Increasing M2M transmissions drive demand for P2P antennas across multiple industries. |
| Restraints | • Variation in operating frequencies for various applications around the world. |
Frequently Asked Questions
Ans: North America dominated the P2P Antennas Market in 2023.
Ans: Expanding Wi-Fi deployment in businesses for enhanced connectivity and growth is the major growth factor of the P2P Antennas Market.
Ans: The Parabolic antennas segment dominated the P2P Antennas Market in 2023.
Ans: The P2P Antennas Market is expected to grow at a CAGR of 5.70% during 2024-2032.
Ans: P2P Antennas Market size was USD 4.30 billion in 2023 and is expected to Reach USD 7.06 billion by 2032.
Get in Touch
