Plasma Lighting Market Report Scope and Overview:
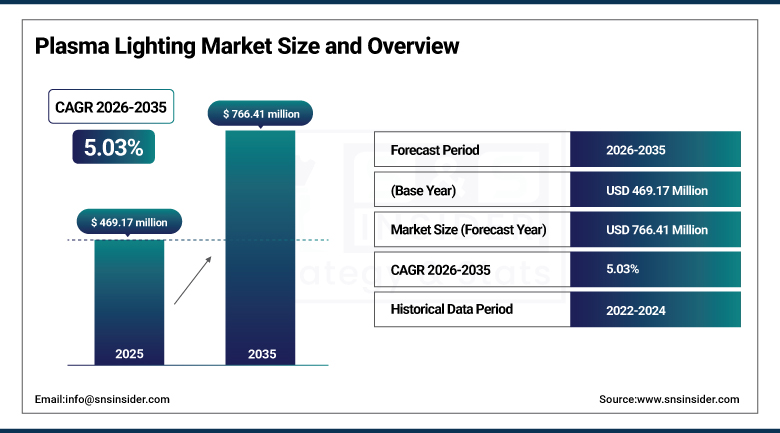
The Plasma Lighting Market size was valued at USD 469.17 Million in 2025 and is expected to reach USD 766.41 Million by 2035, growing at a CAGR of 5.03% over the forecast period of 2026-2035.
The plasma lighting market is growing as it offers high brightness lighting along with the energy efficiency for applications including horticulture, industrial operation and large-scale outdoor architecture. Plasma lighting offers higher lumen output, better full-spectrum light quality and longer operating life than other sources and it is aimed to fill the gap of between traditional LEDs that are not up to the task in challenging, precision-requiring work and production spaces. While LEDs dominate in terms of sheer volume, plasma lighting is gaining ground in specialized areas where robust, thermally stable light is emphasized.
According to the U.S. Department of Energy, LED lighting can cut energy use by up to 75% and last 25 times longer than incandescent bulbs. By 2035, it could save over 569 TWh annually—equal to the output of 92 large power plants.
Plasma Lighting Market Size and Growth Projection:
-
Market Size in 2025: USD 469.17 Million
-
Market Size by 2035: USD 766.41 Million
-
CAGR: 5.03% from 2026 to 2035
-
Base Year: 2025
-
Forecast Period: 2026–2035
-
Historical Data: 2022–2024
To Get more information on Plasma Lighting Market - Request Free Sample Report
Key Plasma Lighting Market Trends Highlights:
-
Recent scientific studies of plasma behavior in extreme environments are driving increased interest in advanced plasma technologies and applications.
-
Observations of dynamic plasma bursts and multi-temperature plasma phenomena are enhancing understanding of how to control and optimize plasma for industrial uses.
-
Insights into plasma’s interaction with magnetic fields and varying temperature states are contributing to innovation in plasma device design.
-
Cross-disciplinary research into natural plasma events is stimulating development of improved diagnostics and monitoring techniques for engineered plasma systems.
-
Growing knowledge of high-energy plasma dynamics supports greater investment in technologies that rely on stable, efficient plasma generation and management.
-
Advances in multi-sensor measurement approaches for plasma research are influencing next-generation plasma lighting and related product performance improvements.
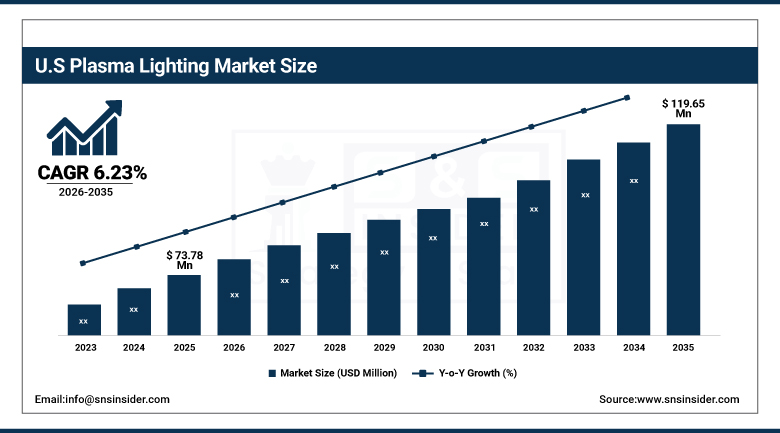
U.S Plasma Lighting Market Size Outlook
The U.S Plasma Lighting Market Size was valued at USD 73.78 Million in 2025 and is expected to reach USD 119.65 Million by 2035 and grow at a CAGR of 6.23% over the forecast period of 2026-2035, on account of growing preference towards high-intensity energy efficient solutions for horticulture, industrial and infrastructure applications. Sustainability and high durability in harsh environment are encouraging Plasma Lighting market demand. Development of smart lighting, new plasma lamp designs, growing application in specialized markets requiring spectral precision, long lifetime, and robust operation.
Plasma Lighting Market Drivers:
-
Rising Fusion Energy Ambitions Propel Demand for Advanced Plasma Solutions
The growing need for advanced energy solutions and durable materials in extreme environments is accelerating the adoption of plasma technologies. Plasma systems offer exceptional heat resistance, high-intensity output, and precision control, features vital for applications ranging from industrial processing to next-generation lighting and materials testing. As industries prioritize energy efficiency and sustainability, plasma technology is increasingly being viewed as a strategic asset. The demand for high-performance lighting in controlled environments including horticulture and manufacturing also underscores its market potential. This shift is driving significant market growth and shaping emerging Plasma Lighting Market trends in high-performance illumination and testing equipment, making plasma technologies essential in sectors seeking long-term, efficient, and robust solutions.
-
China unveiled its advanced SWORD linear plasma device designed to test materials for nuclear fusion reactors. Inspired by the legendary Chixiao sword, the 15.5-meter, 22.5-tonne machine delivers a plasma flux of 10²⁴ particles/m²/s and operates continuously for over 24 hours. Developed by the Hefei Institutes of Physical Science, it supports research at the EAST tokamak and enhances global collaboration on sustainable fusion energy.
Plasma Lighting Market Restraints:
-
Advancements in LED Technology Limit Growth Opportunities for Plasma Lighting Market
The plasma lighting market faces significant restraint from the rapid evolution and affordability of LED technology. LEDs, which have become perfectly efficient and have a long life and low-maintenance, became the discount plasma light once heralded for products that were such good performers. Consequently, industries and consumers are highly turning toward LED solutions for both general and high-performance lighting applications. This switch narrows the potential market for plasma lighting, especially when considering larger or cost-sensitive applications. Moreover, massive investment in LED technology and government supports for the adoption of LED are boosting their market presence further. The broad adoption, technological maturation, and regulation support of LED technologies makes its challenging for plasma lighting, relegating it to niche or speciality applications.
Plasma Lighting Market Opportunities:
-
Geopolitical Restrictions Accelerate Demand for Domestic Semiconductor Lithography Innovation
Growing geopolitical restrictions and trade barriers are creating a compelling opportunity for the expansion of localized semiconductor lithography solutions. With the chip supply chain being weaponized and nations looking to reduce reliance on foreign technology, the market is also seeing higher investment in alternative lithography methods and domestic manufacturing facilities. This change is creating a growing need of advanced, energy-saving plasma lighting sources, and photolithography systems of the next generation. The demand for sovereign semiconductor capability, particularly in advanced economies and in ascending technology clusters, is likely to drive R&D, collaboration, and commercialization. Suppliers that can provide compact, high-performance lithography that suits dynamic regulation and technical trends will be able to tap into this aggressive, new independent production trend in the semiconductor industry.
-
China has achieved a breakthrough in EUV lithography through Laser-Induced Discharge Plasma (LDP) technology, advancing domestic chipmaking capabilities. Backed by USD 41 billion in semiconductor investments in 2023, the country is pushing forward despite the U.S. sanctions. Institutions including the Harbin Institute and SMEE are leading innovation, with SMEE set to produce 28nm chipmaking machines by early 2025.
Plasma Lighting Market Segment Analysis:
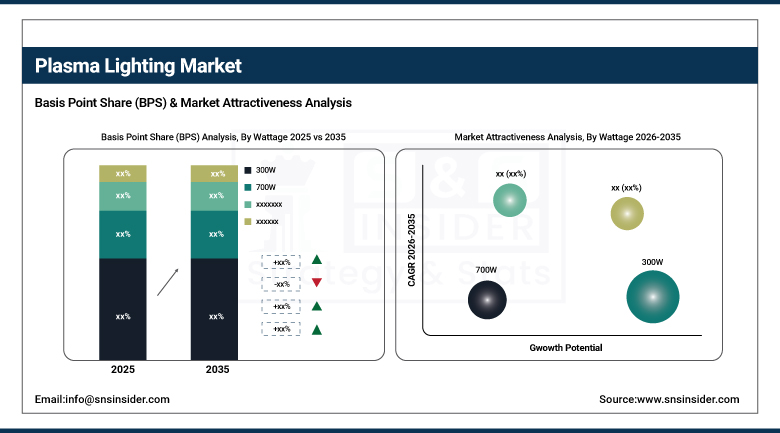
By Wattage
The 300W segment held a dominant Plasma Lighting Market share of around 52% in 2025, and is extensively being utilized across industrial, commercial and outdoor lighting. The powerful output combined with the financial savings in maintenance and efficiency features, ensures that it meets the needs of both merchants seeking similar solutions for high-traffic areas.
The 1000W segment is expected to experience the fastest growth in the Plasma Lighting Market over 2026-2035 with a CAGR of 11.02%, on account of the rising demand for ultra-high-intensity lights for applications on a larger scale, such as sports venues, ports, and industrial areas, for which high luminance and long life are essential.
By Component
The Waveguide segment held a dominant Plasma Lighting Market share of around 42% in 2025, on account of its enhanced directing and scattering capabilities of intense light. This market is served by the increasing demand in many large industrial and commercial institutional outdoor based applications for uniform lit illumination, rugged durability and low energy loss. Its competitive advantage can guarantee the continued expansion of its market.
The Bulb Assembly segment is expected to experience the fastest growth in the Plasma Lighting Market over 2026-2035 with a CAGR of 8.43%, owing to the rising application in high-bay lighting, horticulture, and infrastructure. Its small size, increased luminous efficiency, and integration convenience are promoting interest, and are key to overall growth in the plasma lighting market.
By Application
The Highways, Street Lighting, and Tunnels segment held a dominant Plasma Lighting Market share of around 39% in 2025, This leadership is driven by the growing demand for energy-efficient, long-lasting lighting solutions in transportation infrastructure. Plasma lighting’s ability to deliver high lumen output, superior visibility, and reduced maintenance makes it ideal for harsh outdoor environments and 24/7 operation.
The Horticulture segment is expected to experience the fastest growth in the Plasma Lighting Market over 2026-2035 with a CAGR of 15.04%, his growth is driven by the increasing adoption of advanced cultivation techniques such as vertical farming and indoor agriculture. According to the Plasma Lighting Market Analysis, plasma lighting systems offer high spectral accuracy and intensity, making them ideal for plant health and optimized yield. As demand rises for sustainable, high-efficiency grow lighting solutions, the Plasma Lighting Systems Market is witnessing strong momentum from the horticulture sector globally.
Plasma Lighting Market Regional Analysis:
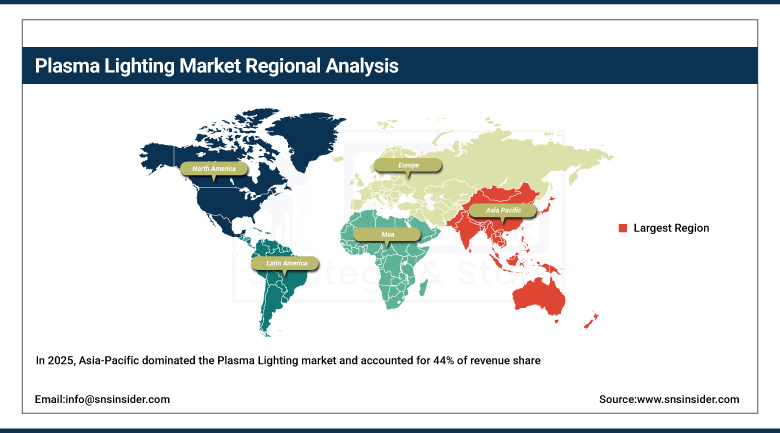
Asia-Pacific Plasma Lighting Market Trends:
In 2025, Asia-Pacific dominated the Plasma Lighting market and accounted for 44% of revenue share. This can be attributed to growing urbanization, infrastructure projects, and governments expenditure on energy-efficient lighting technologies in the countries such as China, India, and Japan. Plasma Lighting Market Analysis also mentions rapidly increasing uptake of smart city projects, and the development of applications in Plasma Lighting Market including, but not limited to highways, factories and horticulture, among other factors contributing to a higher demand. Furthermore, the strong regional manufacturing capacities and availability of major industry players in region are the major factors that contribute to that Asia Pacific makes large contribution to the global plasma lighting market.
China leads the Asia-Pacific Plasma Lighting Market due to rapid infrastructure growth, smart city projects, industrial expansion, and strong government backing for energy-efficient lighting, boosting overall Plasma Lighting Market Analysis.
South Korea's artificial sun made a great record by maintaining a temperature of 100 million°C (180 million°F) for 48 seconds. The development is a key step toward the goal of continuous and effective fusion energy generation.
Get Customized Report as per Your Business Requirement - Enquiry Now
North America Plasma Lighting Market Trends:
North America is expected to witness the fastest growth in the Plasma Lighting Market over 2026-2035, with a projected CAGR of 7.70% due to implementation of infrastructure & correction and sustainability targets and increasing demand for high intensity and energy-efficient lighting solutions. Rise in application prospects in the transportation industry, industrial sites and horticulture are expected to further drive the regional Plasma Lighting Market.
Europe Plasma Lighting Market Trends:
In 2025, Europe emerged as a promising region in the Plasma Lighting Market, driven by stringent environmental regulations, rising energy costs, and strong governmental support for sustainable lighting technologies. The region’s growing investments in smart infrastructure and emphasis on reducing carbon footprints have accelerated the adoption of Plasma Lighting Systems across public and industrial applications, boosting market growth.
On 22 May 2024, Germany’s Wendelstein 7-X stellarator achieved the world record for the longest triple product (pressure times energy confinement time and volume) of any fusion device, including tokamaks, in the world for this product, and signal the beginning of a new heart treatment for the machine. This is a really exciting step on the path to fusion power.
Latin America andMiddle East & Africa Plasma Lighting Market Trends:
LATAM and MEA is experiencing steady growth in the Plasma Lighting market due to increasing rate of urbanization, developing infrastructure, and increasing number of energy efficient lights experienced by these markets. Growing government performance projects in improving public lighting and conservation of electricity and the need for sustainable lighting solutions in some remote and industrial area are acting as the drivers for the advanced Plasma Lighting System in the upcoming regions.
Plasma Lighting Market Competitive Landscape:
Gavita International B.V. is a professional horticultural lighting company specializing in high-performance plasma and LED grow light solutions for commercial growers. Established in 1983, the company is known for innovation, reliability, and advanced spectrum technologies that enhance crop yield, quality, and energy efficiency across global controlled-environment agriculture markets.
-
In Sept 2025, Gavita International B.V. became independent again effective following a management buyout, with existing leadership retained and operations continuing unchanged while expanding its focus on sustainable horticultural lighting and related technologies
Plasma Lighting Companies are:
-
Ceravision Limited
-
Gavita International B.V.
-
Pure Plasma Lighting Inc.
-
Saturn Overseas Trading LLC
-
KA Shui International Holdings
-
LG Electronics Inc.
-
Green De Corp
-
BIRNS Inc.
-
Luxim / LUMA Group
-
Topanga Technologies, Inc.
-
Plasma International
-
Advanced Plasma Lighting (APL)
-
Light Emitting Designs, Inc.
-
Stray Light Optical Technologies
-
PlasmaTech Solutions
-
Plasma Lighting Systems
-
FusionLux Lighting
-
Samsung Electronics Co., Ltd.
| Report Attributes | Details |
|---|---|
| Market Size in 2025 | USD 469.17 Million |
| Market Size by 2035 | USD 766.41 Million |
| CAGR | CAGR of 5.03% From 2026 to 2035 |
| Base Year | 2025 |
| Forecast Period | 2026-2035 |
| Historical Data | 2022-2024 |
| Report Scope & Coverage | Market Size, Segments Analysis, Competitive Landscape, Regional Analysis, DROC & SWOT Analysis, Forecast Outlook |
| Key Segments | • By Component (Lightron , Waveguide, Bulb Assembly, Cavity Resonator) • By Wattage (300W, 700W, 1000W) • By Application (Highways, Street Lighting, and Tunnels, Industrial, Sports & Entertainment, Horticulture, Others (Military, etc.)) |
| Regional Analysis/Coverage | North America (US, Canada), Europe (Germany, UK, France, Italy, Spain, Russia, Poland, Rest of Europe), Asia Pacific (China, India, Japan, South Korea, Australia, ASEAN Countries, Rest of Asia Pacific), Middle East & Africa (UAE, Saudi Arabia, Qatar, South Africa, Rest of Middle East & Africa), Latin America (Brazil, Argentina, Mexico, Colombia, Rest of Latin America). |
| Company Profiles | Ceravision Limited, Hive Lighting Inc., Gavita International B.V., Pure Plasma Lighting Inc., Saturn Overseas Trading LLC, KA Shui International Holdings, LG Electronics Inc., Green De Corp, Solaronix SA, BIRNS Inc., Luxim / LUMA Group, Topanga Technologies, Inc., Plasma International, Advanced Plasma Lighting (APL), Light Emitting Designs, Inc., Stray Light Optical Technologies, PlasmaTech Solutions, Plasma Lighting Systems, FusionLux Lighting, Samsung Electronics Co., Ltd. |
Get in Touch
