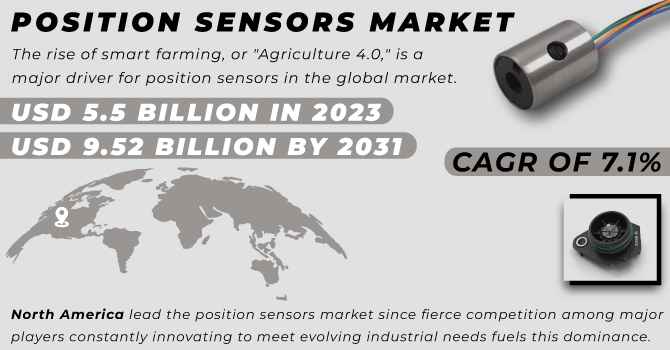
The Position Sensors Market size was valued at USD 5.5 billion in 2023. It is expected to hit USD 9.52 billion by 2031 and grow at a CAGR of 7.1% over the forecast period of 2024-2031.
The rise of smart farming, or "Agriculture 4.0," is a major driver for position sensors in the global market. This trend is fueled by the growing use of internet-connected devices (IoT) in agriculture, which reached 1.8 million globally in 2022. Position sensors play a key role in collecting real-time data about crops and soil conditions. This data allows farmers to adjust resource application (like water or fertilizer) based on specific needs, leading to increased efficiency and productivity.
Now, various sensors like electromagnetic, optical, and mechanical ones are being integrated to provide even more precise information. A recent example is Soilsens, a low-cost system that monitors soil moisture, temperature, and humidity. This helps farmers optimize irrigation through a mobile app.
Drones equipped with position sensors are used for plant health monitoring, while tractors and harvesters are increasingly incorporating this technology to improve yields and profits. For instance, “John Deere's new combine harvester uses GPS, AI, and sensors to make decisions about harvesting. With these advancements, precision agriculture is poised to be a major growth engine for the position sensor market in the coming years”.
Get E-PDF Sample Report on Position Sensors Market - Request Sample Report
In recent years, the position sensors market has witnessed significant growth due to the increasing demand for automation and the need for precise position detection in various industries. The automotive Industry, in particular, has been a major driver of this market, as position sensors are widely used in vehicle navigation systems, engine control units, and advanced driver assistance systems. Furthermore, the aerospace industry has also contributed to the growth of the position sensors market. These sensors are crucial in aircraft navigation systems, flight control systems, and landing gear position detection. The demand for position sensors in the aerospace sector is expected to increase further with the rise in air travel and the development of unmanned aerial vehicles.
MARKET DYNAMICS
KEY DRIVERS:
The growth of industries like oil and gas, utilities, and transportation is driving the demand for Position Sensors.
The demand for Position Sensorss is surging alongside industries like oil & gas, utilities, and transportation. Manufacturers are meeting this need with innovative products like absorbers and isolating pads. Macroeconomic factors like rising utility spending and government investment are also fueling growth. Several other trends are boosting sales: growing awareness of protecting machinery, rising use of active Position Sensorss, and a booming global market for automobiles and airplanes.
Manufacturers are developing new VCS products like absorbers, dampers, and isolating pads, catering to the growing market needs.
RESTRAIN:
Integration Challenges with Existing Systems
Integrating Position Sensorss with existing machinery and infrastructure can be complex and time-consuming. This is especially true for older or legacy systems. Companies may struggle with the intricacies of retrofitting and upgrading older systems to accommodate new vibration control technologies.
Position Sensorss can be expensive to purchase, install, and maintain.
OPPORTUNITY:
Rise of Automation and Advanced Manufacturing
As automation and advanced manufacturing processes become more widespread, the demand for precision and efficiency will rise. Position Sensorss play a crucial role in achieving these goals by minimizing equipment downtime and ensuring smooth operation.
The increasing adoption of renewable energy sources like wind and solar power creates opportunities for Position Sensorss.
CHALLENGES:
Competition from Passive Control Methods
Passive vibration control methods, such as rubber isolators and springs, are often simpler and cheaper to implement. While they might not offer the same level of control as active systems, they can be a viable alternative for some applications.
The position sensors market, which plays a crucial role in various industries such as automotive, aerospace, and manufacturing, has experienced both positive and negative effects due to the Russia-Ukraine war. The conflict has disrupted the supply chain of position sensors, leading to delays in production and delivery. Many position sensor manufacturers rely on components and raw materials sourced from the affected regions, causing a shortage in the market. This scarcity has resulted in increased prices and reduced availability, affecting businesses that depend on these sensors for their operations. To mitigate supply chain disruptions, many companies have shifted their manufacturing operations to alternative regions. This relocation has led to increased production costs and logistical challenges. Additionally, the quality and reliability of position sensors from these new manufacturing hubs may vary, impacting the overall market reputation.
The Russia-Ukraine war has created a surge in demand for position sensors due to the increased need for advanced monitoring and surveillance systems. As both countries strive to enhance their military capabilities, the demand for accurate and reliable position sensors has increased. The Russia-Ukraine war has also opened up new avenues for international collaboration and partnerships. As countries seek to support Ukraine in its defense efforts, there has been an increase in joint ventures and strategic alliances between domestic and foreign companies. This exchange of expertise and resources has further propelled the growth of the position sensor market, creating a mutually beneficial environment for all stakeholders involved.
Impact of Economic Slowdown
The economic slowdown leads to a decline in demand and sales of position sensors as businesses faced financial constraints, they reduced their investments in new technologies, including position sensors. This reduction in demand has resulted in a decrease in market growth and profitability for manufacturers. The decrease in demand has forced them to reassess their production capacities and reduce their workforce. This has led to downsizing and layoffs, causing significant disruptions within the industry. Moreover, the recession has also affected the supply chain of position sensors. As manufacturers faced financial difficulties, they struggled to source raw materials and components, resulting in delays in production and delivery. This has further impacted the market, as customers have become dissatisfied with delayed orders and turned to alternative suppliers.
By Technology
Photoelectric
Rotary
Linear
Proximity
Others
Proximity sensors currently holds supreme position, with over 30% of the market share in 2023. However, photoelectric sensors are poised for the fastest growth. This surge is fueled by the growing emphasis on sensor data and information-driven manufacturing within production lines, where photoelectric sensors play a critical role.
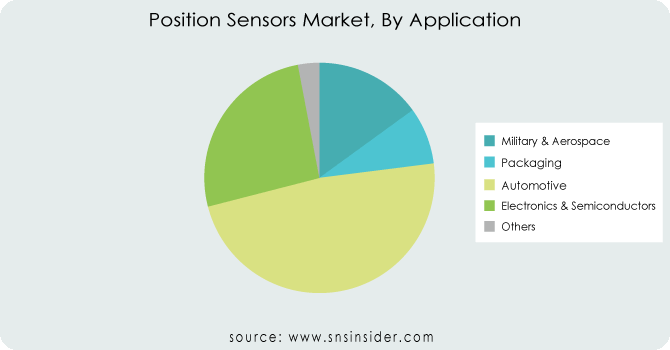
By Application
Military & Aerospace
Packaging
Automotive
Electronics & Semiconductors
Others
The automotive industry takes the leading position, holding over 48% of the market share in 2023. Electronics and semiconductors are also showing promise for growth. This is driven by the increasing need for precise positioning in various car features like steering, acceleration, gear selection, and stability control. These advancements all rely heavily on sensor technology.
Get Customized Report as Per Your Business Requirement - Request For Customized Report
North America lead the position sensors market since fierce competition among major players constantly innovating to meet evolving industrial needs fuels this dominance. Within the region, the US holds the biggest market share, while Canada boasts the fastest growth.
Europe follows closely due to its large population and booming commercial vehicle production. Germany reigns supreme here, but the UK is experiencing the most rapid growth
The future, however, belongs to Asia-Pacific. Stringent emission standards are driving the adoption of advanced driver-assistance systems (ADAS) and autonomous cars, propelling the region's position sensor market to the fastest growth rate globally. Here, China holds the largest market share, with India experiencing the most significant growth.

REGIONAL COVERAGE:
North America
US
Canada
Mexico
Europe
Eastern Europe
Poland
Romania
Hungary
Turkey
Rest of Eastern Europe
Western Europe
Germany
France
UK
Italy
Spain
Netherlands
Switzerland
Austria
Rest of Western Europe
Asia Pacific
China
India
Japan
South Korea
Vietnam
Singapore
Australia
Rest of Asia Pacific
Middle East & Africa
Middle East
UAE
Egypt
Saudi Arabia
Qatar
Rest of Middle East
Africa
Nigeria
South Africa
Rest of Africa
Latin America
Brazil
Argentina
Colombia
Rest of Latin America
The major key players are ams AG, TE Connectivity, Honeywell International Inc., SICK AG, STMicroelectronics, Vishay Technologies Inc., Infineon Technologies AG, MTS Systems, Allegro Microsystem, Egis Technology, Apple Inc., Bourns, Touch Biometrix, Synaptics, Q Technology, and other key players mentioned in the final report.
Honeywell International Inc-Company Financial Analysis
In Feb 2023, TE, a leader in connectors and sensors, collaborated with Preddio, a manufacturer of user-friendly remote monitoring solutions for condition-based maintenance and operational productivity gains. This partnership allows industrial and commercial facilities of all sizes to easily and affordably implement and enjoy the benefits of condition monitoring.
In July 2023, STMicroelectronics unveiled their latest innovation, the FlightSense™ multi-zone distance sensor, which boasts a camera-like field of view.
In April 2022, Vishay Intertechnology, Inc. introduced a miniature position sensor with a compact 12.7 mm outer diameter. This sensor surpasses its competitors in terms of accuracy and resolution, while also offering enhanced reliability and durability for the demanding operating environments of military and industrial applications.
In Nov 2022, Infineon Technologies AG expanded its sensor portfolio for automotive applications by introducing the new XENSIV™ TLE4971 family.
In June 2022, Allegro MicroSystems, Inc. made an exciting announcement at the Sensors Converge Conference in San Jose, CA. They introduced their latest innovations, the A33110 and A33115 magnetic position sensors.
| Report Attributes | Details |
| Market Size in 2023 | US$ 5.5 Bn |
| Market Size by 2031 | US$ 9.52 Bn |
| CAGR | CAGR of 7.1% From 2024 to 2031 |
| Base Year | 2023 |
| Forecast Period | 2024-2031 |
| Historical Data | 2020-2022 |
| Report Scope & Coverage | Market Size, Segments Analysis, Competitive Landscape, Regional Analysis, DROC & SWOT Analysis, Forecast Outlook |
| Key Segments |
• By Technology (Photoelectric, Rotary, Linear, Proximity, And Others) |
| Regional Analysis/Coverage | North America (US, Canada, Mexico), Europe (Eastern Europe [Poland, Romania, Hungary, Turkey, Rest of Eastern Europe] Western Europe] Germany, France, UK, Italy, Spain, Netherlands, Switzerland, Austria, Rest of Western Europe]). Asia Pacific (China, India, Japan, South Korea, Vietnam, Singapore, Australia, Rest of Asia Pacific), Middle East & Africa (Middle East [UAE, Egypt, Saudi Arabia, Qatar, Rest of Middle East], Africa [Nigeria, South Africa, Rest of Africa], Latin America (Brazil, Argentina, Colombia Rest of Latin America) |
| Company Profiles | ams AG, TE Connectivity, Honeywell International Inc., SICK AG, STMicroelectronics, Vishay Technologies Inc., Infineon Technologies AG, MTS Systems, Allegro Microsystem, Egis Technology, Apple Inc., Bourns, Touch Biometrix, Synaptics, Q Technology |
| Key Drivers |
• The growth of industries like oil and gas, utilities, and transportation is driving the demand for Position Sensors. • Manufacturers are developing new VCS products like absorbers, dampers, and isolating pads, catering to the growing market needs. |
| Market Restraints | • Integration Challenges with Existing Systems • Position Sensorss can be expensive to purchase, install, and maintain. |
Ans: The expected CAGR of the global Position Sensors Market during the forecast period is 7.1%.
Ans: The Position Sensors Market was valued at USD 5.5 billion in 2023.
Ans: The automotive segment accounted for the largest revenue share of about 47% in 2022
Ans: APAC region will grow with the highest CAGR during the forecast period.
Ans: Position sensors are an integral part of IoT devices, enabling them to accurately detect and measure the position of objects. The growing demand for IoT devices is consequently driving the position sensors market.
Table of Contents
1. Introduction
1.1 Market Definition
1.2 Scope
1.3 Research Assumptions
2. Industry Flowchart
3. Research Methodology
4. Market Dynamics
4.1 Drivers
4.2 Restraints
4.3 Opportunities
4.4 Challenges
5. Impact Analysis
5.1 Impact Of Russia Ukraine Crisis
5.2 Impact of Economic Slowdown on Major Countries
5.2.1 Introduction
5.2.2 United States
5.2.3 Canada
5.2.4 Germany
5.2.5 France
5.2.6 UK
5.2.7 China
5.2.8 Japan
5.2.9 South Korea
5.2.10 India
6. Value Chain Analysis
7. Porter’s 5 Forces Model
8. Pest Analysis
9. Position Sensors Market Segmentation, By Technology
9.1 Introduction
9.2 Trend Analysis
9.3 Photoelectric
9.4 Rotary
9.5 Linear
9.6 Proximity
9.7 Others
10. Position Sensors Market Segmentation, By Application
10.1 Introduction
10.2 Trend Analysis
10.3 Military & Aerospace
10.4 Packaging
10.5 Automotive
10.6 Electronics & Semiconductors
10.7 Others
11. Regional Analysis
11.1 Introduction
11.2 North America
11.2.1 Trend Analysis
11.2.2 North America Position Sensors Market by Country
11.2.3 North America Position Sensors Market By Technology
11.2.4 North America Position Sensors Market By Application
11.2.5 USA
11.2.5.1 USA Position Sensors Market By Technology
11.2.5.2 USA Position Sensors Market By Application
11.2.6 Canada
11.2.6.1 Canada Position Sensors Market By Technology
11.2.6.2 Canada Position Sensors Market By Application
11.2.7 Mexico
11.2.7.1 Mexico Position Sensors Market By Technology
11.2.7.2 Mexico Position Sensors Market By Application
11.3 Europe
11.3.1 Trend Analysis
11.3.2 Eastern Europe
11.3.2.1 Eastern Europe Position Sensors Market by Country
11.3.2.2 Eastern Europe Position Sensors Market By Technology
11.3.2.3 Eastern Europe Position Sensors Market By Application
11.3.2.4 Poland
11.3.2.4.1 Poland Position Sensors Market By Technology
11.3.2.4.2 Poland Position Sensors Market By Application
11.3.2.5 Romania
11.3.2.5.1 Romania Position Sensors Market By Technology
11.3.2.5.2 Romania Position Sensors Market By Application
11.3.2.6 Hungary
11.3.2.6.1 Hungary Position Sensors Market By Technology
11.3.2.6.2 Hungary Position Sensors Market By Application
11.3.2.7 Turkey
11.3.2.7.1 Turkey Position Sensors Market By Technology
11.3.2.7.2 Turkey Position Sensors Market By Application
11.3.2.8 Rest of Eastern Europe
11.3.2.8.1 Rest of Eastern Europe Position Sensors Market By Technology
11.3.2.8.2 Rest of Eastern Europe Position Sensors Market By Application
11.3.3 Western Europe
11.3.3.1 Western Europe Position Sensors Market by Country
11.3.3.2 Western Europe Position Sensors Market By Technology
11.3.3.3 Western Europe Position Sensors Market By Application
11.3.3.4 Germany
11.3.3.4.1 Germany Position Sensors Market By Technology
11.3.3.4.2 Germany Position Sensors Market By Application
11.3.3.5 France
11.3.3.5.1 France Position Sensors Market By Technology
11.3.3.5.2 France Position Sensors Market By Application
11.3.3.6 UK
11.3.3.6.1 UK Position Sensors Market By Technology
11.3.3.6.2 UK Position Sensors Market By Application
11.3.3.7 Italy
11.3.3.7.1 Italy Position Sensors Market By Technology
11.3.3.7.2 Italy Position Sensors Market By Application
11.3.3.8 Spain
11.3.3.8.1 Spain Position Sensors Market By Technology
11.3.3.8.2 Spain Position Sensors Market By Application
11.3.3.9 Netherlands
11.3.3.9.1 Netherlands Position Sensors Market By Technology
11.3.3.9.2 Netherlands Position Sensors Market By Application
11.3.3.10 Switzerland
11.3.3.10.1 Switzerland Position Sensors Market By Technology
11.3.3.10.2 Switzerland Position Sensors Market By Application
11.3.3.11 Austria
11.3.3.11.1 Austria Position Sensors Market By Technology
11.3.3.11.2 Austria Position Sensors Market By Application
11.3.3.12 Rest of Western Europe
11.3.3.12.1 Rest of Western Europe Position Sensors Market By Technology
11.3.2.12.2 Rest of Western Europe Position Sensors Market By Application
11.4 Asia-Pacific
11.4.1 Trend Analysis
11.4.2 Asia Pacific Position Sensors Market by Country
11.4.3 Asia Pacific Position Sensors Market By Technology
11.4.4 Asia Pacific Position Sensors Market By Application
11.4.5 China
11.4.5.1 China Position Sensors Market By Technology
11.4.5.2 China Position Sensors Market By Application
11.4.6 India
11.4.6.1 India Position Sensors Market By Technology
11.4.6.2 India Position Sensors Market By Application
11.4.7 Japan
11.4.7.1 Japan Position Sensors Market By Technology
11.4.7.2 Japan Position Sensors Market By Application
11.4.8 South Korea
11.4.8.1 South Korea Position Sensors Market By Technology
11.4.8.2 South Korea Position Sensors Market By Application
11.4.9 Vietnam
11.4.9.1 Vietnam Position Sensors Market By Technology
11.4.9.2 Vietnam Position Sensors Market By Application
11.4.10 Singapore
11.4.10.1 Singapore Position Sensors Market By Technology
11.4.10.2 Singapore Position Sensors Market By Application
11.4.11 Australia
11.4.11.1 Australia Position Sensors Market By Technology
11.4.11.2 Australia Position Sensors Market By Application
11.4.12 Rest of Asia-Pacific
11.4.12.1 Rest of Asia-Pacific Position Sensors Market By Technology
11.4.12.2 Rest of Asia-Pacific Position Sensors Market By Application
11.5 Middle East & Africa
11.5.1 Trend Analysis
11.5.2 Middle East
11.5.2.1 Middle East Position Sensors Market by Country
11.5.2.2 Middle East Position Sensors Market By Technology
11.5.2.3 Middle East Position Sensors Market By Application
11.5.2.4 UAE
11.5.2.4.1 UAE Position Sensors Market By Technology
11.5.2.4.2 UAE Position Sensors Market By Application
11.5.2.5 Egypt
11.5.2.5.1 Egypt Position Sensors Market By Technology
11.5.2.5.2 Egypt Position Sensors Market By Application
11.5.2.6 Saudi Arabia
11.5.2.6.1 Saudi Arabia Position Sensors Market By Technology
11.5.2.6.2 Saudi Arabia Position Sensors Market By Application
11.5.2.7 Qatar
11.5.2.7.1 Qatar Position Sensors Market By Technology
11.5.2.7.2 Qatar Position Sensors Market By Application
11.5.2.8 Rest of Middle East
11.5.2.8.1 Rest of Middle East Position Sensors Market By Technology
11.5.2.8.2 Rest of Middle East Position Sensors Market By Application
11.5.3 Africa
11.5.3.1 Africa Position Sensors Market by Country
11.5.3.2 Africa Position Sensors Market By Technology
11.5.3.3 Africa Position Sensors Market By Application
11.5.2.4 Nigeria
11.5.2.4.1 South Africa Position Sensors Market By Technology
11.5.2.4.2 South Africa Position Sensors Market By Application
11.5.2.5 South Africa
11.5.2.5.1 South Africa Position Sensors Market By Technology
11.5.2.5.2 South Africa Position Sensors Market By Application
11.5.2.6 Rest of Africa
11.5.2.6.1 Rest of Africa Position Sensors Market By Technology
11.5.2.6.2 Rest of Africa Position Sensors Market By Application
11.6 Latin America
11.6.1 Trend Analysis
11.6.2 Latin America Position Sensors Market by Country
11.6.3 Latin America Position Sensors Market By Technology
11.6.4 Latin America Position Sensors Market By Application
11.6.5 Brazil
11.6.5.1 Brazil Position Sensors Market By Technology
11.6.5.2 Brazil Position Sensors Market By Application
11.6.6 Argentina
11.6.6.1 Argentina Position Sensors Market By Technology
11.6.6.2 Argentina Position Sensors Market By Application
11.6.7 Colombia
11.6.7.1 Colombia Position Sensors Market By Technology
11.6.7.2 Colombia Position Sensors Market By Application
11.6.8 Rest of Latin America
11.6.8.1 Rest of Latin America Position Sensors Market By Technology
11.6.8.2 Rest of Latin America Position Sensors Market By Application
12. Company Profiles
12.1 ams AG
12.1.1 Company Overview
12.1.2 Financial
12.1.3 Products/ Services Offered
12.1.4 SWOT Analysis
12.1.5 The SNS View
12.2 TE Connectivity
12.2.1 Company Overview
12.2.2 Financial
12.2.3 Products/ Services Offered
12.2.4 SWOT Analysis
12.2.5 The SNS View
12.3 Honeywell International Inc
12.3.1 Company Overview
12.3.2 Financial
12.3.3 Products/ Services Offered
12.3.4 SWOT Analysis
12.3.5 The SNS View
12.4 SICK AG
12.4.1 Company Overview
12.4.2 Financial
12.4.3 Products/ Services Offered
12.4.4 SWOT Analysis
12.4.5 The SNS View
12.5 STMicroelectronics
12.5.1 Company Overview
12.5.2 Financial
12.5.3 Products/ Services Offered
12.5.4 SWOT Analysis
12.5.5 The SNS View
12.6 Vishay Technologies Inc.
12.6.1 Company Overview
12.6.2 Financial
12.6.3 Products/ Services Offered
12.6.4 SWOT Analysis
12.6.5 The SNS View
12.7 Infineon Technologies AG
12.7.1 Company Overview
12.7.2 Financial
12.7.3 Products/ Services Offered
12.7.4 SWOT Analysis
12.7.5 The SNS View
12.8 MTS Systems
12.8.1 Company Overview
12.8.2 Financial
12.8.3 Products/ Services Offered
12.8.4 SWOT Analysis
12.8.5 The SNS View
12.9 Allegro Microsystem
12.9.1 Company Overview
12.9.2 Financial
12.9.3 Products/ Services Offered
12.9.4 SWOT Analysis
12.9.5 The SNS View
12.10 Egis Technology
12.10.1 Company Overview
12.10.2 Financial
12.10.3 Products/ Services Offered
12.10.4 SWOT Analysis
12.10.5 The SNS View
12.11 Apple Inc.
12.11.1 Company Overview
12.11.2 Financial
12.11.3 Products/ Services Offered
12.11.4 SWOT Analysis
12.11.5 The SNS View
12.12 Bourns
12.12.1 Company Overview
12.12.2 Financial
12.12.3 Products/ Services Offered
12.12.4 SWOT Analysis
12.12.5 The SNS View
12.13 Touch Biometrix
12.13.1 Company Overview
12.13.2 Financial
12.13.3 Products/ Services Offered
12.13.4 SWOT Analysis
12.13.5 The SNS View
12.14 Synaptics
12.14.1 Company Overview
12.14.2 Financial
12.14.3 Products/ Services Offered
12.14.4 SWOT Analysis
12.14.5 The SNS View
12.15 Q Technology
12.15.1 Company Overview
12.15.2 Financial
12.15.3 Products/ Services Offered
12.15.4 SWOT Analysis
12.15.5 The SNS View
13. Competitive Landscape
13.1 Competitive Benchmarking
13.2 Market Share Analysis
13.3 Recent Developments
13.3.1 Industry News
13.3.2 Company News
13.3.3 Mergers & Acquisitions
14. USE Cases And Best Practices
15. Conclusion
An accurate research report requires proper strategizing as well as implementation. There are multiple factors involved in the completion of good and accurate research report and selecting the best methodology to compete the research is the toughest part. Since the research reports we provide play a crucial role in any company’s decision-making process, therefore we at SNS Insider always believe that we should choose the best method which gives us results closer to reality. This allows us to reach at a stage wherein we can provide our clients best and accurate investment to output ratio.
Each report that we prepare takes a timeframe of 350-400 business hours for production. Starting from the selection of titles through a couple of in-depth brain storming session to the final QC process before uploading our titles on our website we dedicate around 350 working hours. The titles are selected based on their current market cap and the foreseen CAGR and growth.
The 5 steps process:
Step 1: Secondary Research:
Secondary Research or Desk Research is as the name suggests is a research process wherein, we collect data through the readily available information. In this process we use various paid and unpaid databases which our team has access to and gather data through the same. This includes examining of listed companies’ annual reports, Journals, SEC filling etc. Apart from this our team has access to various associations across the globe across different industries. Lastly, we have exchange relationships with various university as well as individual libraries.

Step 2: Primary Research
When we talk about primary research, it is a type of study in which the researchers collect relevant data samples directly, rather than relying on previously collected data. This type of research is focused on gaining content specific facts that can be sued to solve specific problems. Since the collected data is fresh and first hand therefore it makes the study more accurate and genuine.
We at SNS Insider have divided Primary Research into 2 parts.
Part 1 wherein we interview the KOLs of major players as well as the upcoming ones across various geographic regions. This allows us to have their view over the market scenario and acts as an important tool to come closer to the accurate market numbers. As many as 45 paid and unpaid primary interviews are taken from both the demand and supply side of the industry to make sure we land at an accurate judgement and analysis of the market.
This step involves the triangulation of data wherein our team analyses the interview transcripts, online survey responses and observation of on filed participants. The below mentioned chart should give a better understanding of the part 1 of the primary interview.

Part 2: In this part of primary research the data collected via secondary research and the part 1 of the primary research is validated with the interviews from individual consultants and subject matter experts.
Consultants are those set of people who have at least 12 years of experience and expertise within the industry whereas Subject Matter Experts are those with at least 15 years of experience behind their back within the same space. The data with the help of two main processes i.e., FGDs (Focused Group Discussions) and IDs (Individual Discussions). This gives us a 3rd party nonbiased primary view of the market scenario making it a more dependable one while collation of the data pointers.
Step 3: Data Bank Validation
Once all the information is collected via primary and secondary sources, we run that information for data validation. At our intelligence centre our research heads track a lot of information related to the market which includes the quarterly reports, the daily stock prices, and other relevant information. Our data bank server gets updated every fortnight and that is how the information which we collected using our primary and secondary information is revalidated in real time.

Step 4: QA/QC Process
After all the data collection and validation our team does a final level of quality check and quality assurance to get rid of any unwanted or undesired mistakes. This might include but not limited to getting rid of the any typos, duplication of numbers or missing of any important information. The people involved in this process include technical content writers, research heads and graphics people. Once this process is completed the title gets uploader on our platform for our clients to read it.
Step 5: Final QC/QA Process:
This is the last process and comes when the client has ordered the study. In this process a final QA/QC is done before the study is emailed to the client. Since we believe in giving our clients a good experience of our research studies, therefore, to make sure that we do not lack at our end in any way humanly possible we do a final round of quality check and then dispatch the study to the client.
The 3D Holographic Market size was valued at USD 601.1 million in 2022 and is expected to grow to USD 3559.96 million by 2030 and grow at a CAGR of 24.9 % over the forecast period of 2023-2030.
The Gas Sensor Market size was valued at USD 2.84 billion in 2023 and is expected to grow to USD 6.05 billion by 2031 and grow at a CAGR Of 9.86 % over the forecast period of 2024-2031.
The Alcohol Sensor Market size was valued at USD 2.31 billion in 2022 and is expected to grow to USD 6.69 billion by 2030 and grow at a CAGR Of 14.22 % over the forecast period of 2023-2030.
The InGaAs Photodiode Sensor Market size was valued at USD 205.5 million in 2022 and is expected to grow to USD 394.68 million by 2030 and grow at a CAGR of 8.5 % over the forecast period of 2023-2030.
The Display Technology Market size was valued at USD 125.5 Billion in 2022 and is expected to grow to USD 212.42897 Billion by 2030 and grow at a CAGR Of 6.8 % over the forecast period of 2023-2030.
The Restaurant Delivery Robot Market size was valued at USD 11.2 billion in 2022. It is estimated to hit USD 63.82 billion by 2030 and grow at a CAGR of 24.3% over the forecast period of 2023-2030.

Hi! Click one of our member below to chat on Phone
© 2024 All Rights Reserved by SNS Insider Pvt Ltd