Get more information on Rugged Servers Market - Request Sample Report
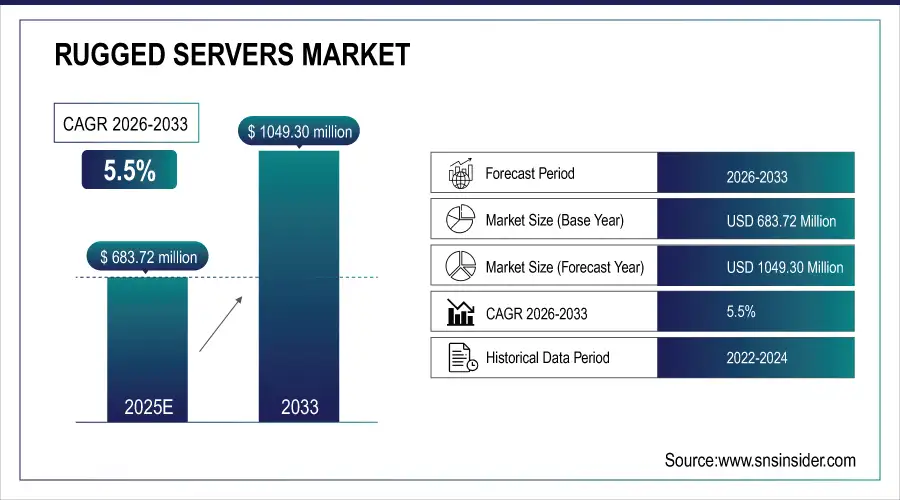
The Rugged Servers Market Size was valued at USD 614.3 million in 2023 and is expected to reach USD 994.6 Million by 2032 and grow at a CAGR of 5.5% over the forecast period 2024-2032.
The Rugged Servers market has experienced notable expansion due to the increasing demand for durable computing solutions that can function in harsh environments. Rugged Servers are essential in industries like military, industrial automation, and transportation, where regular servers may not withstand vibrations, humidity, dust, and heat. Their ability to withstand challenges is confirmed through strict testing criteria, which includes Ingress Protection (IP), ATEX, IECEx, and military specifications. These servers are necessary for real-time data processing applications in Machine Learning (ML), Artificial Intelligence (AI), and unmanned systems, frequently utilizing specialized wide-temperature Solid State Disks (SSDs) to improve data security. The growing use of IoT devices and automation in sectors such as manufacturing, oil & gas, and transportation is also driving the need for durable servers. The significance of Cubic Corporation's M3X and M3-SE Rugged Servers in critical infrastructure is highlighted by government regulations like Do DIN APL certification for product safety and quality. The pandemic exposed weaknesses in supply chains, but the market's rebound and expected increase show a positive direction, with a prediction of faster growth in the future as industries adopt advanced rugged computing solutions.
Due to the incorporation of various devices and strict safety regulations, with enterprises adopting advanced technologies such as IoT and edge computing. This adjustment demonstrates an overarching shift in the industry as companies quickly integrate advanced functions to meet strict regulations. The increase of multi-functionality in devices improves their capabilities, changing them from individual units to adaptable, high-performance tools. In fields like defense, Rugged Servers are vital when Commercial Off-The-Shelf (COTS) products need to meet strict military-grade criteria. These servers are created to function in harsh environments such as high temperatures and humidity, meeting the increasing need for dependable, high-performing equipment from consumers. For example, Lenovo's introduction of the Think Edge S50 in March 2021, which includes durable features and advanced processing abilities, shows this trend by meeting the requirements of sectors such as healthcare with improved device connectivity. These developments indicate the wider trend in the market towards strong, versatile servers that satisfy operational and regulatory needs equally. The focus on strict safety regulations and device flexibility not only promotes the increase of durable servers but also encourages creativity and growth in different industries. The need for Rugged Servers is projected to increase as businesses adopt advanced technologies and adhere to strict regulations, driving market growth and ensuring these critical systems can withstand challenging operational conditions.
Strict regulations in sectors such as military, aerospace, marine, and power drive the high demand for durable servers. These industries must adhere to strict requirements for the excellence and safety of their products, requiring strong computing solutions that can operate dependably in challenging environments. Rugged Servers are specially built to withstand tough conditions like extreme temperatures, heavy vibrations, and high pressures, making them essential in industries where regular servers would struggle. In industries like food and beverages and pharmaceuticals, specific manufacturing processes happen under harsh conditions that regular servers cannot handle. Deploying Rugged Servers ensures smooth operations in compliance with regulations, improving safety and efficiency. The need for durable servers is also highlighted by their capacity to manage expenses and quality effectively while adhering to strict regulatory requirements. Industries are increasingly focusing on safety and compliance, leading to a projected increase in the use of Rugged Servers, which aligns with a larger trend of investing in durable, high-performance computing options that can function effectively in harsh environments. The increasing focus on compliance with regulations and the importance of strong, reliable computing environments are main factors driving market expansion for Rugged Servers.
The Rugged Servers Market is experiencing considerable expansion due to rising need for powerful computing solutions that can function in harsh conditions, especially in military and defense fields. One main reason driving this expansion is the strict certification procedures that robust servers must go through to satisfy the demanding criteria needed for military purposes. In June 2022, Cubic Corporation's M3X and M3-SE Rugged Servers were granted Do DIN APL certification, indicating they are secure, trusted, and authorized for use in the U.S. Department of Defense's technology system. This certification emphasizes the crucial importance of durable servers in military activities, where reliability and security are of utmost significance. The M3-SE servers, equipped with Intel Xeon processors, provide 10-gigabit networking and SSD storage, making them perfect for compact command post locations needing advanced computing capabilities. Moreover, the M3X-APP server module, equipped with a 16-core processor from Intel Xeon and 128GB of DDR4 RAM, is specifically crafted for handling intensive virtual workloads, guaranteeing smooth functioning even in challenging settings. These servers meet MIL-STD-810G and MIL-STD-461 standards, demonstrating the durability necessary for military purposes, offering unmatched performance at the frontline. The M3-SE and M3X servers feature a modular design that enables simple upgrades and seamless integration with current systems, providing adaptability and scalability to meet changing mission requirements. With global military spending on the rise, the demand for Rugged Servers is expected to increase as well, especially with the U.S. Department of Defense budget reaching around USD 773 billion in 2023. The servers' capability to adhere to strict military requirements, along with their strong performance in challenging environments, makes them vital elements in the update of defense technology, leading to the growth of the Rugged Servers market as a whole.
Restraints
Rugged Servers, commonly used in challenging conditions like military bases, oil rigs, and industrial facilities, are essential for handling and safeguarding confidential information. Nonetheless, the protection and safety of the information managed by these servers are notable worries, particularly considering their placement in remote and frequently unprotected areas. These servers are commonly utilized for important tasks such as real-time data processing for military communications, monitoring industrial equipment, and conducting remote sensing in dangerous environments. The servers in these areas are susceptible to cyber-attacks, physical tampering, and unauthorized access, putting the data integrity at risk. The government has become stricter with data privacy and security regulations due to growing concerns. An example is the implementation of the Cybersecurity Maturity Model Certification (CMMC) framework by the U.S. Department of Defense (DoD), mandating contractors, including users of Rugged Servers, to adhere to cybersecurity standards in safeguarding sensitive data on DoD networks. Furthermore, the General Data Protection Regulation (GDPR) in the European Union enforces stringent rules on data protection that are also relevant for businesses utilizing Rugged Servers within European territories. It is necessary to follow these regulations, as not protecting data properly can result in significant consequences such as penalties and harm to one's reputation. In military scenarios, the information handled by these servers may be categorized, and a breach could result in significant national security consequences. The increasing number of cyber threats targeting critical infrastructure emphasizes the importance of improving security measures for servers, including rugged versions, especially those in remote areas, as stated by the U.S. Cybersecurity & Infrastructure Security Agency (CISA). Guaranteeing the privacy and security of data
By Offering
In 2023, the Hardware Segment dominated the revenue in the Rugged Servers Market with a 62% share. Considering the crucial importance of strong and efficient parts in meeting the tough needs of challenging conditions. Continuous technological advances and increasing demand for durable servers capable of withstanding extreme conditions like temperature variations, physical impacts, dust, and moisture are driving the growth of this sector. Companies in the Rugged Servers sector are making significant investments in R&D to improve the durability and performance of their hardware products. An example is Trenton Systems, a top provider of durable computing solutions, who has released high-tech durable server platforms made to adhere to military standards like MIL-STD-810G. Their servers come with shock-mounted components and advanced cooling systems to guarantee top performance in the toughest conditions. In the same way, Dell Technologies has broadened its rugged server selection by launching the PowerEdge XR11 and XR12, specifically made for edge deployments in harsh environments. These servers are perfect for remote military outposts, oil rigs, and industrial sites due to their strong chassis, sealed connectors, and advanced thermal management systems. The hardware industry is also profiting from the growing complexity of applications in defense, aerospace, and industrial automation industries, which require more processing power, increased storage capacity, and improved connectivity choices. Crystal Group and similar companies have met this demand by incorporating advanced Intel Xeon processors and large-capacity SSDs into their durable server products, guaranteeing dependable performance in crucial tasks. Emphasizing hardware innovation involves meeting durability needs and ensuring servers can support complex software applications in industries.
Need any customization research on Rugged Servers Market - Enquiry Now
By Type
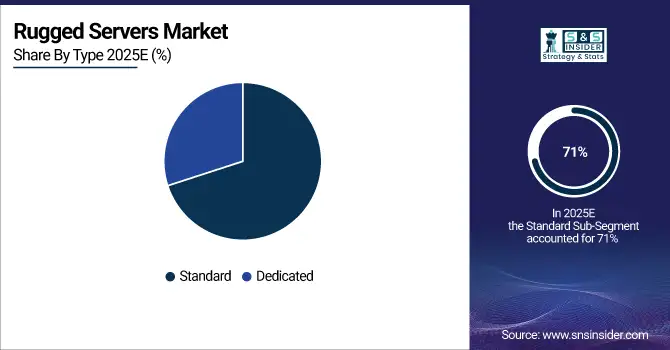
Based on Type, Standard is captured the largest share in Rugged Servers Market with 71% of share in 2023. This prevalent of these servers is due to their adaptability and wide range of uses in various industries, such as industrial automation, transportation, telecommunications, and others. Regular durable servers are created to provide a well-rounded mix of toughness and versatile functionality, making them perfect for a variety of uses needing strong performance and flexibility to different operating conditions. The rising need for trustworthy computer systems able to withstand tough environmental elements like extreme temperatures, vibrations, dust, and moisture has greatly fueled the expansion of this sector. Companies such as Cisco Systems have been leading the way in innovation by introducing new Rugged Servers that adhere to strict industrial and military standards while providing improved processing power and connectivity choices. For example, Cisco's UCS E-Series servers are designed to function effectively in difficult conditions while delivering the necessary computing power for essential applications. In the same way, HPE has launched the HPE Edge line EL8000 Converged Edge System, blending durability with powerful computing, ideal for edge installations in challenging environments like distant oil and gas sites or military facilities. These servers have sophisticated thermal management systems and sturdy components that make them reliable in challenging environments.
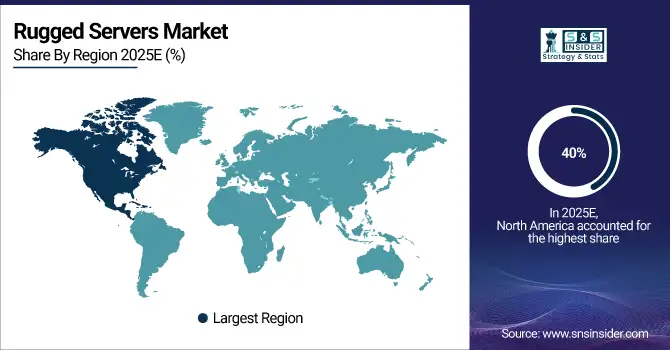
North America held the largest portion of revenue in the Rugged Servers market in 2023, accounting for 40% of the market share. Primarily fueled by growing demand from the defense and aerospace industries. Investments in ruggedized computing solutions have increased due to the U.S. government's emphasis on modernizing military infrastructure and improving cyber defense capabilities. The U.S. Department of Defense is making substantial investments in upgrading command and control systems, incorporating advanced technologies like artificial intelligence and machine learning into defense operations. These efforts play a crucial role in driving the demand for robust and dependable servers in the area, as they need servers that can endure harsh conditions and still deliver top performance. Moreover, the increased use of IoT and Industry 4.0 technologies in industries like manufacturing, oil and gas, and transportation is driving the need for durable servers that can function effectively in tough conditions. Many top companies in North America are leading the way in innovation within this industry. One instance is the introduction of Dell Technologies' durable server line, which includes the Dell EMC PowerEdge XR2 model, built to adhere to military standards for shock, vibration, and extreme temperatures. This server is commonly utilized in defense and industries requiring dependable operation in challenging environments. In the same vein, Cisco Systems has introduced toughened models of its UCS server lineup, designed specifically for use in tough conditions such as remote industrial locations and military missions. In terms of countries, the United States is at the forefront in the region, thanks to robust government efforts to strengthen national security and enhance emergency response capabilities. The rise in occurrence of natural disasters like hurricanes and wildfires in North America has led to an increased demand for resilient infrastructure, driving the need for tough servers that can operate continuously during emergencies. The Rugged Servers market is predicted to experience substantial growth in North America from 2024 to 2032 due to the region's focus on technological advancement and infrastructure resilience.
The Rugged Servers market in Europe & Asia-Pacific is growing significantly at a CAGR of 5.5% from 2024 to 2032. The growth of the market in Europe is driven by the rising need for reliable and secure computer solutions in defense and critical infrastructure sectors. European nations are making investments in cutting-edge military technologies and strengthening their defense capabilities, such as the deployment of durable servers. Moreover, the growth of smart city initiatives and implementation of digital transformation strategies in different sectors offer new possibilities for rugged server deployments. In Asia-Pacific, market growth is being driven by quick industrialization and substantial investments in defense. Nations such as China, India, and Japan are updating their military capabilities and improving their industrial automation processes, leading to a growing need for durable computing solutions. The varied weather and tough working conditions in the area demand durable servers to guarantee dependable performance.
The key players in the rugged servers market are Dell Technologies, Siemens AG, Crystal Group Inc., Core Systems, CP Technologies, Portwell, Inc., Symmatrix, Mercury Systems, Trenton Systems, One Stop Systems & Other Players.
In April 2024, Advantech Co., Ltd., a leader in industrial computing, unveiled a new range of industrial solutions and servers utilizing the 14th Generation Intel Core processors. This series includes the ASMB-610V3, ASMB-788, ASMB-588, and the Edge Accelerator Server HPC-6120 + ASMB-610V3. These servers are created to greatly improve industrial and edge computing applications.
In May 2024, Crystal Group Inc., a company that designs and produces durable high-performance edge computing solutions, signed a multi-million dollar deal with an important defense contractor to provide durable, cybersecurity-enabled servers for use in advanced radar systems by the U.S. Army.
In February 2023: GETAC introduced enhancements to its X600 mobile workstation line by unveiling the X600 Pro-PCI and X600 Server models. These servers are tailored to meet the specific requirements of professionals operating in challenging environments, including those in the oil & gas, manufacturing, and defense sectors.
Report Attributes | Details |
---|---|
Market Size in 2023 | USD 614.3 Million |
Market Size by 2032 | USD 994.6 Million |
CAGR | CAGR of 5.5% From 2024 to 2032 |
Base Year | 2023 |
Forecast Period | 2024-2032 |
Historical Data | 2020-2022 |
Report Scope & Coverage | Market Size, Segments Analysis, Competitive Landscape, Regional Analysis, DROC & SWOT Analysis, Forecast Outlook |
Key Segments | • By Offering (Hardware, Software, Services) • By Type (Standard, Dedicated) • By Memory Size (<256>512 GB−1 TB, >1TB) • By Application (Military And Aerospace, Industrial, Marine, IT And Telecommunication, Energy & Power, Others) |
Regional Analysis/Coverage | North America (US, Canada, Mexico), Europe (Eastern Europe [Poland, Romania, Hungary, Turkey, Rest of Eastern Europe] Western Europe] Germany, France, UK, Italy, Spain, Netherlands, Switzerland, Austria, Rest of Western Europe]), Asia-Pacific (China, India, Japan, South Korea, Vietnam, Singapore, Australia, Rest of Asia-Pacific), Middle East & Africa (Middle East [UAE, Egypt, Saudi Arabia, Qatar, Rest of Middle East], Africa [Nigeria, South Africa, Rest of Africa], Latin America (Brazil, Argentina, Colombia, Rest of Latin America) |
Company Profiles | Dell Technologies, Siemens AG, Crystal Group Inc., Core Systems, CP Technologies, Portwell, Inc., Symmatrix, Mercury Systems, Trenton Systems and One Stop Systems. |
Key Drivers |
• Increased safety and adherence to regulations are fueling the growth of the rugged server market. • Rugged Servers Market Growth Driven by Advanced Military Certifications |
Restraints |
• Privacy and Security Issues for Robust Servers in Distant Areas |
The Rugged Servers Market was valued at USD 614.3 million in 2023.
The key players in the rugged servers market are Dell Technologies, Siemens AG, Crystal Group Inc., Core Systems, CP Technologies, Portwell, Inc., Symmatrix, Mercury Systems, Trenton Systems and One Stop Systems.
Rugged servers are becoming increasingly important in the military, industrial, and power sectors and Various industries have stringent regulatory requirements.
Yes, and they are Raw material vendors, Distributors/traders/wholesalers/suppliers, Regulatory authorities, including government agencies and NGO, Commercial research & development (R&D) institutions, Importers and exporters, Government organizations, research organizations, and consulting firms, Trade/Industrial associations, End-use industries.
Ans: The Rugged Servers Market is growing at a CAGR of 5.5% over the forecast period 2024-2032
Table of Content
1. Introduction
1.1 Market Definition
1.2 Scope (Inclusion and Exclusions)
1.3 Research Assumptions
2. Executive Summary
2.1 Market Overview
2.2 Regional Synopsis
2.3 Competitive Summary
3. Research Methodology
3.1 Top-Down Approach
3.2 Bottom-up Approach
3.3. Data Validation
3.4 Primary Interviews
4. Market Dynamics Impact Analysis
4.1 Market Driving Factors Analysis
4.1.1 Drivers
4.1.2 Restraints
4.1.3 Opportunities
4.1.4 Challenges
4.2 PESTLE Analysis
4.3 Porter’s Five Forces Model
5. Statistical Insights and Trends Reporting
5.1 Key Vendors and Feature Analysis, 2023
5.2 Performance Benchmarks, 2023
5.3 Integration Capabilities, by Software
5.4 Usage Statistics, 2023
6. Competitive Landscape
6.1 List of Major Companies, By Region
6.2 Market Share Analysis, By Region
6.3 Product Benchmarking
6.3.1 Product specifications and features
6.3.2 Pricing
6.4 Strategic Initiatives
6.4.1 Marketing and promotional activities
6.4.2 Distribution and supply chain strategies
6.4.3 Expansion plans and new product launches
6.4.4 Strategic partnerships and collaborations
6.5 Technological Advancements
6.6 Market Positioning and Branding
7. Rugged Servers Market Segmentation, by Offering
7.1 Chapter Overview
7.2 Hardware
7.2.1 Hardware Market Trends Analysis (2020-2032)
7.2.2 Hardware Market Size Estimates and Forecasts to 2032 (USD Million)
7.3 Software
7.3.1 Software Market Trends Analysis (2020-2032)
7.3.2 Software Market Size Estimates and Forecasts to 2032 (USD Million)
7.4 Services
7.4.1 Services Market Trends Analysis (2020-2032)
7.4.2 Services Market Size Estimates and Forecasts to 2032 (USD Million)
8. Rugged Servers Market Segmentation, by Type
8.1 Chapter Overview
8.2 Standard
8.2.1 Standard Market Trends Analysis (2020-2032)
8.2.2 Standard Market Size Estimates and Forecasts to 2032 (USD Million)
8.3 Dedicated
8.3.1 Dedicated Market Trends Analysis (2020-2032)
8.3.2 Dedicated Market Size Estimates and Forecasts to 2032 (USD Million)
9. Rugged Servers Market Segmentation, by Memory Size
9.1 Chapter Overview
9.2 <256 GB
9.2.1 <256 GB Market Trends Analysis (2020-2032)
9.2.2 <256 GB Market Size Estimates and Forecasts to 2032 (USD Million)
9.3 256 GB−512 GB
9.3.1 256 GB−512 GB Market Trends Analysis (2020-2032)
9.3.2 256 GB−512 GB Market Size Estimates and Forecasts to 2032 (USD Million)
9.4 >512 GB−1 TB
9.4.1 >512 GB−1 TB Market Trends Analysis (2020-2032)
9.4.2 >512 GB−1 TB Market Size Estimates and Forecasts to 2032 (USD Million)
9.5 >1TB
9.5.1 >1TB Market Trends Analysis (2020-2032)
9.5.2 >1TB Market Size Estimates and Forecasts to 2032 (USD Million)
10. Rugged Servers Market Segmentation, by Application
10.1 Chapter Overview
10.2 Military and Aerospace
10.2.1 Military and Aerospace Market Trends Analysis (2020-2032)
10.2.2 Military and Aerospace Market Size Estimates and Forecasts to 2032 (USD Million)
10.3 Industrial
10.3.1 Industrial Market Trends Analysis (2020-2032)
10.3.2 Industrial Market Size Estimates and Forecasts to 2032 (USD Million)
10.4 Marine
10.4.1 Marine Market Trends Analysis (2020-2032)
10.4.2 Marine Market Size Estimates and Forecasts to 2032 (USD Million)
10.5 IT and Telecommunication
10.5.1 IT and Telecommunication Market Trends Analysis (2020-2032)
10.5.2 IT and Telecommunication Market Size Estimates and Forecasts to 2032 (USD Million)
10.6 Energy & Power
10.6.1 Energy & Power Market Trends Analysis (2020-2032)
10.6.2 Energy & Power Market Size Estimates and Forecasts to 2032 (USD Million)
10.7 Others
10.7.1 Others Market Trends Analysis (2020-2032)
10.7.2 Others Market Size Estimates and Forecasts to 2032 (USD Million)
11. Regional Analysis
11.1 Chapter Overview
11.2 North America
11.2.1 Trends Analysis
11.2.2 North America Rugged Servers Market Estimates and Forecasts, by Country (2020-2032) (USD Million)
11.2.3 North America Rugged Servers Market Estimates and Forecasts, by Offering (2020-2032) (USD Million)
11.2.4 North America Rugged Servers Market Estimates and Forecasts, by Type (2020-2032) (USD Million)
11.2.5 North America Rugged Servers Market Estimates and Forecasts, by Memory Size (2020-2032) (USD Million)
11.2.6 North America Rugged Servers Market Estimates and Forecasts, by Application (2020-2032) (USD Million)
11.2.7 USA
11.2.7.1 USA Rugged Servers Market Estimates and Forecasts, by Offering (2020-2032) (USD Million)
11.2.7.2 USA Rugged Servers Market Estimates and Forecasts, by Type (2020-2032) (USD Million)
11.2.7.3 USA Rugged Servers Market Estimates and Forecasts, by Memory Size (2020-2032) (USD Million)
11.2.7.4 USA Rugged Servers Market Estimates and Forecasts, by Application (2020-2032) (USD Million)
11.2.8 Canada
11.2.8.1 Canada Rugged Servers Market Estimates and Forecasts, by Offering (2020-2032) (USD Million)
11.2.8.2 Canada Rugged Servers Market Estimates and Forecasts, by Type (2020-2032) (USD Million)
11.2.8.3 Canada Rugged Servers Market Estimates and Forecasts, by Memory Size (2020-2032) (USD Million)
11.2.8.4 Canada Rugged Servers Market Estimates and Forecasts, by Application (2020-2032) (USD Million)
11.2.9 Mexico
11.2.9.1 Mexico Rugged Servers Market Estimates and Forecasts, by Offering (2020-2032) (USD Million)
11.2.9.2 Mexico Rugged Servers Market Estimates and Forecasts, by Type (2020-2032) (USD Million)
11.2.9.3 Mexico Rugged Servers Market Estimates and Forecasts, by Memory Size (2020-2032) (USD Million)
11.2.9.4 Mexico Rugged Servers Market Estimates and Forecasts, by Application (2020-2032) (USD Million)
11.3 Europe
11.3.1 Eastern Europe
11.3.1.1 Trends Analysis
11.3.1.2 Eastern Europe Rugged Servers Market Estimates and Forecasts, by Country (2020-2032) (USD Million)
11.3.1.3 Eastern Europe Rugged Servers Market Estimates and Forecasts, by Offering (2020-2032) (USD Million)
11.3.1.4 Eastern Europe Rugged Servers Market Estimates and Forecasts, by Type (2020-2032) (USD Million)
11.3.1.5 Eastern Europe Rugged Servers Market Estimates and Forecasts, by Memory Size (2020-2032) (USD Million)
11.3.1.6 Eastern Europe Rugged Servers Market Estimates and Forecasts, by Application (2020-2032) (USD Million)
11.3.1.7 Poland
11.3.1.7.1 Poland Rugged Servers Market Estimates and Forecasts, by Offering (2020-2032) (USD Million)
11.3.1.7.2 Poland Rugged Servers Market Estimates and Forecasts, by Type (2020-2032) (USD Million)
11.3.1.7.3 Poland Rugged Servers Market Estimates and Forecasts, by Memory Size (2020-2032) (USD Million)
11.3.1.7.4 Poland Rugged Servers Market Estimates and Forecasts, by Application (2020-2032) (USD Million)
11.3.1.8 Romania
11.3.1.8.1 Romania Rugged Servers Market Estimates and Forecasts, by Offering (2020-2032) (USD Million)
11.3.1.8.2 Romania Rugged Servers Market Estimates and Forecasts, by Type (2020-2032) (USD Million)
11.3.1.8.3 Romania Rugged Servers Market Estimates and Forecasts, by Memory Size (2020-2032) (USD Million)
11.3.1.8.4 Romania Rugged Servers Market Estimates and Forecasts, by Application (2020-2032) (USD Million)
11.3.1.9 Hungary
11.3.1.9.1 Hungary Rugged Servers Market Estimates and Forecasts, by Offering (2020-2032) (USD Million)
11.3.1.9.2 Hungary Rugged Servers Market Estimates and Forecasts, by Type (2020-2032) (USD Million)
11.3.1.9.3 Hungary Rugged Servers Market Estimates and Forecasts, by Memory Size (2020-2032) (USD Million)
11.3.1.9.4 Hungary Rugged Servers Market Estimates and Forecasts, by Application (2020-2032) (USD Million)
11.3.1.10 Turkey
11.3.1.10.1 Turkey Rugged Servers Market Estimates and Forecasts, by Offering (2020-2032) (USD Million)
11.3.1.10.2 Turkey Rugged Servers Market Estimates and Forecasts, by Type (2020-2032) (USD Million)
11.3.1.10.3 Turkey Rugged Servers Market Estimates and Forecasts, by Memory Size (2020-2032) (USD Million)
11.3.1.10.4 Turkey Rugged Servers Market Estimates and Forecasts, by Application (2020-2032) (USD Million)
11.3.1.11 Rest of Eastern Europe
11.3.1.11.1 Rest of Eastern Europe Rugged Servers Market Estimates and Forecasts, by Offering (2020-2032) (USD Million)
11.3.1.11.2 Rest of Eastern Europe Rugged Servers Market Estimates and Forecasts, by Type (2020-2032) (USD Million)
11.3.1.11.3 Rest of Eastern Europe Rugged Servers Market Estimates and Forecasts, by Memory Size (2020-2032) (USD Million)
11.3.1.11.4 Rest of Eastern Europe Rugged Servers Market Estimates and Forecasts, by Application (2020-2032) (USD Million)
11.3.2 Western Europe
11.3.2.1 Trends Analysis
11.3.2.2 Western Europe Rugged Servers Market Estimates and Forecasts, by Country (2020-2032) (USD Million)
11.3.2.3 Western Europe Rugged Servers Market Estimates and Forecasts, by Offering (2020-2032) (USD Million)
11.3.2.4 Western Europe Rugged Servers Market Estimates and Forecasts, by Type (2020-2032) (USD Million)
11.3.2.5 Western Europe Rugged Servers Market Estimates and Forecasts, by Memory Size (2020-2032) (USD Million)
11.3.2.6 Western Europe Rugged Servers Market Estimates and Forecasts, by Application (2020-2032) (USD Million)
11.3.2.7 Germany
11.3.2.7.1 Germany Rugged Servers Market Estimates and Forecasts, by Offering (2020-2032) (USD Million)
11.3.2.7.2 Germany Rugged Servers Market Estimates and Forecasts, by Type (2020-2032) (USD Million)
11.3.2.7.3 Germany Rugged Servers Market Estimates and Forecasts, by Memory Size (2020-2032) (USD Million)
11.3.2.7.4 Germany Rugged Servers Market Estimates and Forecasts, by Application (2020-2032) (USD Million)
11.3.2.8 France
11.3.2.8.1 France Rugged Servers Market Estimates and Forecasts, by Offering (2020-2032) (USD Million)
11.3.2.8.2 France Rugged Servers Market Estimates and Forecasts, by Type (2020-2032) (USD Million)
11.3.2.8.3 France Rugged Servers Market Estimates and Forecasts, by Memory Size (2020-2032) (USD Million)
11.3.2.8.4 France Rugged Servers Market Estimates and Forecasts, by Application (2020-2032) (USD Million)
11.3.2.9 UK
11.3.2.9.1 UK Rugged Servers Market Estimates and Forecasts, by Offering (2020-2032) (USD Million)
11.3.2.9.2 UK Rugged Servers Market Estimates and Forecasts, by Type (2020-2032) (USD Million)
11.3.2.9.3 UK Rugged Servers Market Estimates and Forecasts, by Memory Size (2020-2032) (USD Million)
11.3.2.9.4 UK Rugged Servers Market Estimates and Forecasts, by Application (2020-2032) (USD Million)
11.3.2.10 Italy
11.3.2.10.1 Italy Rugged Servers Market Estimates and Forecasts, by Offering (2020-2032) (USD Million)
11.3.2.10.2 Italy Rugged Servers Market Estimates and Forecasts, by Type (2020-2032) (USD Million)
11.3.2.10.3 Italy Rugged Servers Market Estimates and Forecasts, by Memory Size (2020-2032) (USD Million)
11.3.2.10.4 Italy Rugged Servers Market Estimates and Forecasts, by Application (2020-2032) (USD Million)
11.3.2.11 Spain
11.3.2.11.1 Spain Rugged Servers Market Estimates and Forecasts, by Offering (2020-2032) (USD Million)
11.3.2.11.2 Spain Rugged Servers Market Estimates and Forecasts, by Type (2020-2032) (USD Million)
11.3.2.11.3 Spain Rugged Servers Market Estimates and Forecasts, by Memory Size (2020-2032) (USD Million)
11.3.2.11.4 Spain Rugged Servers Market Estimates and Forecasts, by Application (2020-2032) (USD Million)
11.3.2.12 Netherlands
11.3.2.12.1 Netherlands Rugged Servers Market Estimates and Forecasts, by Offering (2020-2032) (USD Million)
11.3.2.12.2 Netherlands Rugged Servers Market Estimates and Forecasts, by Type (2020-2032) (USD Million)
11.3.2.12.3 Netherlands Rugged Servers Market Estimates and Forecasts, by Memory Size (2020-2032) (USD Million)
11.3.2.12.4 Netherlands Rugged Servers Market Estimates and Forecasts, by Application (2020-2032) (USD Million)
11.3.2.13 Switzerland
11.3.2.13.1 Switzerland Rugged Servers Market Estimates and Forecasts, by Offering (2020-2032) (USD Million)
11.3.2.13.2 Switzerland Rugged Servers Market Estimates and Forecasts, by Type (2020-2032) (USD Million)
11.3.2.13.3 Switzerland Rugged Servers Market Estimates and Forecasts, by Memory Size (2020-2032) (USD Million)
11.3.2.13.4 Switzerland Rugged Servers Market Estimates and Forecasts, by Application (2020-2032) (USD Million)
11.3.2.14 Austria
11.3.2.14.1 Austria Rugged Servers Market Estimates and Forecasts, by Offering (2020-2032) (USD Million)
11.3.2.14.2 Austria Rugged Servers Market Estimates and Forecasts, by Type (2020-2032) (USD Million)
11.3.2.14.3 Austria Rugged Servers Market Estimates and Forecasts, by Memory Size (2020-2032) (USD Million)
11.3.2.14.4 Austria Rugged Servers Market Estimates and Forecasts, by Application (2020-2032) (USD Million)
11.3.2.15 Rest of Western Europe
11.3.2.15.1 Rest of Western Europe Rugged Servers Market Estimates and Forecasts, by Offering (2020-2032) (USD Million)
11.3.2.15.2 Rest of Western Europe Rugged Servers Market Estimates and Forecasts, by Type (2020-2032) (USD Million)
11.3.2.15.3 Rest of Western Europe Rugged Servers Market Estimates and Forecasts, by Memory Size (2020-2032) (USD Million)
11.3.2.15.4 Rest of Western Europe Rugged Servers Market Estimates and Forecasts, by Application (2020-2032) (USD Million)
11.4 Asia-Pacific
11.4.1 Trends Analysis
11.4.2 Asia-Pacific Rugged Servers Market Estimates and Forecasts, by Country (2020-2032) (USD Million)
11.4.3 Asia-Pacific Rugged Servers Market Estimates and Forecasts, by Offering (2020-2032) (USD Million)
11.4.4 Asia-Pacific Rugged Servers Market Estimates and Forecasts, by Type (2020-2032) (USD Million)
11.4.5 Asia-Pacific Rugged Servers Market Estimates and Forecasts, by Memory Size (2020-2032) (USD Million)
11.4.6 Asia-Pacific Rugged Servers Market Estimates and Forecasts, by Application (2020-2032) (USD Million)
11.4.7 China
11.4.7.1 China Rugged Servers Market Estimates and Forecasts, by Offering (2020-2032) (USD Million)
11.4.7.2 China Rugged Servers Market Estimates and Forecasts, by Type (2020-2032) (USD Million)
11.4.7.3 China Rugged Servers Market Estimates and Forecasts, by Memory Size (2020-2032) (USD Million)
11.4.7.4 China Rugged Servers Market Estimates and Forecasts, by Application (2020-2032) (USD Million)
11.4.8 India
11.4.8.1 India Rugged Servers Market Estimates and Forecasts, by Offering (2020-2032) (USD Million)
11.4.8.2 India Rugged Servers Market Estimates and Forecasts, by Type (2020-2032) (USD Million)
11.4.8.3 India Rugged Servers Market Estimates and Forecasts, by Memory Size (2020-2032) (USD Million)
11.4.8.4 India Rugged Servers Market Estimates and Forecasts, by Application (2020-2032) (USD Million)
11.4.9 Japan
11.4.9.1 Japan Rugged Servers Market Estimates and Forecasts, by Offering (2020-2032) (USD Million)
11.4.9.2 Japan Rugged Servers Market Estimates and Forecasts, by Type (2020-2032) (USD Million)
11.4.9.3 Japan Rugged Servers Market Estimates and Forecasts, by Memory Size (2020-2032) (USD Million)
11.4.9.4 Japan Rugged Servers Market Estimates and Forecasts, by Application (2020-2032) (USD Million)
11.4.10 South Korea
11.4.10.1 South Korea Rugged Servers Market Estimates and Forecasts, by Offering (2020-2032) (USD Million)
11.4.10.2 South Korea Rugged Servers Market Estimates and Forecasts, by Type (2020-2032) (USD Million)
11.4.10.3 South Korea Rugged Servers Market Estimates and Forecasts, by Memory Size (2020-2032) (USD Million)
11.4.10.4 South Korea Rugged Servers Market Estimates and Forecasts, by Application (2020-2032) (USD Million)
11.4.11 Vietnam
11.4.11.1 Vietnam Rugged Servers Market Estimates and Forecasts, by Offering (2020-2032) (USD Million)
11.4.11.2 Vietnam Rugged Servers Market Estimates and Forecasts, by Type (2020-2032) (USD Million)
11.4.11.3 Vietnam Rugged Servers Market Estimates and Forecasts, by Memory Size (2020-2032) (USD Million)
11.4.11.4 Vietnam Rugged Servers Market Estimates and Forecasts, by Application (2020-2032) (USD Million)
11.4.12 Singapore
11.4.12.1 Singapore Rugged Servers Market Estimates and Forecasts, by Offering (2020-2032) (USD Million)
11.4.12.2 Singapore Rugged Servers Market Estimates and Forecasts, by Type (2020-2032) (USD Million)
11.4.12.3 Singapore Rugged Servers Market Estimates and Forecasts, by Memory Size (2020-2032) (USD Million)
11.4.12.4 Singapore Rugged Servers Market Estimates and Forecasts, by Application (2020-2032) (USD Million)
11.4.13 Australia
11.4.13.1 Australia Rugged Servers Market Estimates and Forecasts, by Offering (2020-2032) (USD Million)
11.4.13.2 Australia Rugged Servers Market Estimates and Forecasts, by Type (2020-2032) (USD Million)
11.4.13.3 Australia Rugged Servers Market Estimates and Forecasts, by Memory Size (2020-2032) (USD Million)
11.4.13.4 Australia Rugged Servers Market Estimates and Forecasts, by Application (2020-2032) (USD Million)
11.4.14 Rest of Asia-Pacific
11.4.14.1 Rest of Asia-Pacific Rugged Servers Market Estimates and Forecasts, by Offering (2020-2032) (USD Million)
11.4.14.2 Rest of Asia-Pacific Rugged Servers Market Estimates and Forecasts, by Type (2020-2032) (USD Million)
11.4.14.3 Rest of Asia-Pacific Rugged Servers Market Estimates and Forecasts, by Memory Size (2020-2032) (USD Million)
11.4.14.4 Rest of Asia -acific Rugged Servers Market Estimates and Forecasts, by Application (2020-2032) (USD Million)
11.5 Middle East and Africa
11.5.1 Middle East
11.5.1.1 Trends Analysis
11.5.1.2 Middle East Rugged Servers Market Estimates and Forecasts, by Country (2020-2032) (USD Million)
11.5.1.3 Middle East Rugged Servers Market Estimates and Forecasts, by Offering (2020-2032) (USD Million)
11.5.1.4 Middle East Rugged Servers Market Estimates and Forecasts, by Type (2020-2032) (USD Million)
11.5.1.5 Middle East Rugged Servers Market Estimates and Forecasts, by Memory Size (2020-2032) (USD Million)
11.5.1.6 Middle East Rugged Servers Market Estimates and Forecasts, by Application (2020-2032) (USD Million)
11.5.1.7 UAE
11.5.1.7.1 UAE Rugged Servers Market Estimates and Forecasts, by Offering (2020-2032) (USD Million)
11.5.1.7.2 UAE Rugged Servers Market Estimates and Forecasts, by Type (2020-2032) (USD Million)
11.5.1.7.3 UAE Rugged Servers Market Estimates and Forecasts, by Memory Size (2020-2032) (USD Million)
11.5.1.7.4 UAE Rugged Servers Market Estimates and Forecasts, by Application (2020-2032) (USD Million)
11.5.1.8 Egypt
11.5.1.8.1 Egypt Rugged Servers Market Estimates and Forecasts, by Offering (2020-2032) (USD Million)
11.5.1.8.2 Egypt Rugged Servers Market Estimates and Forecasts, by Type (2020-2032) (USD Million)
11.5.1.8.3 Egypt Rugged Servers Market Estimates and Forecasts, by Memory Size (2020-2032) (USD Million)
11.5.1.8.4 Egypt Rugged Servers Market Estimates and Forecasts, by Application (2020-2032) (USD Million)
11.5.1.9 Saudi Arabia
11.5.1.9.1 Saudi Arabia Rugged Servers Market Estimates and Forecasts, by Offering (2020-2032) (USD Million)
11.5.1.9.2 Saudi Arabia Rugged Servers Market Estimates and Forecasts, by Type (2020-2032) (USD Million)
11.5.1.9.3 Saudi Arabia Rugged Servers Market Estimates and Forecasts, by Memory Size (2020-2032) (USD Million)
11.5.1.9.4 Saudi Arabia Rugged Servers Market Estimates and Forecasts, by Application (2020-2032) (USD Million)
11.5.1.10 Qatar
11.5.1.10.1 Qatar Rugged Servers Market Estimates and Forecasts, by Offering (2020-2032) (USD Million)
11.5.1.10.2 Qatar Rugged Servers Market Estimates and Forecasts, by Type (2020-2032) (USD Million)
11.5.1.10.3 Qatar Rugged Servers Market Estimates and Forecasts, by Memory Size (2020-2032) (USD Million)
11.5.1.10.4 Qatar Rugged Servers Market Estimates and Forecasts, by Application (2020-2032) (USD Million)
11.5.1.11 Rest of Middle East
11.5.1.11.1 Rest of Middle East Rugged Servers Market Estimates and Forecasts, by Offering (2020-2032) (USD Million)
11.5.1.11.2 Rest of Middle East Rugged Servers Market Estimates and Forecasts, by Type (2020-2032) (USD Million)
11.5.1.11.3 Rest of Middle East Rugged Servers Market Estimates and Forecasts, by Memory Size (2020-2032) (USD Million)
11.5.1.11.4 Rest of Middle East Rugged Servers Market Estimates and Forecasts, by Application (2020-2032) (USD Million)
11.5.2 Africa
11.5.2.1 Trends Analysis
11.5.2.2 Africa Rugged Servers Market Estimates and Forecasts, by Country (2020-2032) (USD Million)
11.5.2.3 Africa Rugged Servers Market Estimates and Forecasts, by Offering (2020-2032) (USD Million)
11.5.2.4 Africa Rugged Servers Market Estimates and Forecasts, by Type (2020-2032) (USD Million)
11.5.2.5 Africa Rugged Servers Market Estimates and Forecasts, by Memory Size (2020-2032) (USD Million)
11.5.2.6 Africa Rugged Servers Market Estimates and Forecasts, by Application (2020-2032) (USD Million)
11.5.2.7 South Africa
11.5.2.7.1 South Africa Rugged Servers Market Estimates and Forecasts, by Offering (2020-2032) (USD Million)
11.5.2.7.2 South Africa Rugged Servers Market Estimates and Forecasts, by Type (2020-2032) (USD Million)
11.5.2.7.3 South Africa Rugged Servers Market Estimates and Forecasts, by Memory Size (2020-2032) (USD Million)
11.5.2.7.4 South Africa Rugged Servers Market Estimates and Forecasts, by Application (2020-2032) (USD Million)
11.5.2.8 Nigeria
11.5.2.8.1 Nigeria Rugged Servers Market Estimates and Forecasts, by Offering (2020-2032) (USD Million)
11.5.2.8.2 Nigeria Rugged Servers Market Estimates and Forecasts, by Type (2020-2032) (USD Million)
11.5.2.8.3 Nigeria Rugged Servers Market Estimates and Forecasts, by Memory Size (2020-2032) (USD Million)
11.5.2.8.4 Nigeria Rugged Servers Market Estimates and Forecasts, by Application (2020-2032) (USD Million)
11.5.2.9 Rest of Africa
11.5.2.9.1 Rest of Africa Rugged Servers Market Estimates and Forecasts, by Offering (2020-2032) (USD Million)
11.5.2.9.2 Rest of Africa Rugged Servers Market Estimates and Forecasts, by Type (2020-2032) (USD Million)
11.5.2.9.3 Rest of Africa Rugged Servers Market Estimates and Forecasts, by Memory Size (2020-2032) (USD Million)
11.5.2.9.4 Rest of Africa Rugged Servers Market Estimates and Forecasts, by Application (2020-2032) (USD Million)
11.6 Latin America
11.6.1 Trends Analysis
11.6.2 Latin America Rugged Servers Market Estimates and Forecasts, by Country (2020-2032) (USD Million)
11.6.3 Latin America Rugged Servers Market Estimates and Forecasts, by Offering (2020-2032) (USD Million)
11.6.4 Latin America Rugged Servers Market Estimates and Forecasts, by Type (2020-2032) (USD Million)
11.6.5 Latin America Rugged Servers Market Estimates and Forecasts, by Memory Size (2020-2032) (USD Million)
11.6.6 Latin America Rugged Servers Market Estimates and Forecasts, by Application (2020-2032) (USD Million)
11.6.7 Brazil
11.6.7.1 Brazil Rugged Servers Market Estimates and Forecasts, by Offering (2020-2032) (USD Million)
11.6.7.2 Brazil Rugged Servers Market Estimates and Forecasts, by Type (2020-2032) (USD Million)
11.6.7.3 Brazil Rugged Servers Market Estimates and Forecasts, by Memory Size (2020-2032) (USD Million)
11.6.7.4 Brazil Rugged Servers Market Estimates and Forecasts, by Application (2020-2032) (USD Million)
11.6.8 Argentina
11.6.8.1 Argentina Rugged Servers Market Estimates and Forecasts, by Offering (2020-2032) (USD Million)
11.6.8.2 Argentina Rugged Servers Market Estimates and Forecasts, by Type (2020-2032) (USD Million)
11.6.8.3 Argentina Rugged Servers Market Estimates and Forecasts, by Memory Size (2020-2032) (USD Million)
11.6.8.4 Argentina Rugged Servers Market Estimates and Forecasts, by Application (2020-2032) (USD Million)
11.6.9 Colombia
11.6.9.1 Colombia Rugged Servers Market Estimates and Forecasts, by Offering (2020-2032) (USD Million)
11.6.9.2 Colombia Rugged Servers Market Estimates and Forecasts, by Type (2020-2032) (USD Million)
11.6.9.3 Colombia Rugged Servers Market Estimates and Forecasts, by Memory Size (2020-2032) (USD Million)
11.6.9.4 Colombia Rugged Servers Market Estimates and Forecasts, by Application (2020-2032) (USD Million)
11.6.10 Rest of Latin America
11.6.10.1 Rest of Latin America Rugged Servers Market Estimates and Forecasts, by Offering (2020-2032) (USD Million)
11.6.10.2 Rest of Latin America Rugged Servers Market Estimates and Forecasts, by Type (2020-2032) (USD Million)
11.6.10.3 Rest of Latin America Rugged Servers Market Estimates and Forecasts, by Memory Size (2020-2032) (USD Million)
11.6.10.4 Rest of Latin America Rugged Servers Market Estimates and Forecasts, by Application (2020-2032) (USD Million)
12. Company Profiles
12.1 Dell Technologies
12.1.1 Company Overview
12.1.2 Financial
12.1.3 Products/ Services Offered
12.1.4 SWOT Analysis
12.2 Siemens AG
12.2.1 Company Overview
12.2.2 Financial
12.2.3 Products/ Services Offered
12.2.4 SWOT Analysis
12.3 Crystal Group Inc.
12.3.1 Company Overview
12.3.2 Financial
12.3.3 Products/ Services Offered
12.3.4 SWOT Analysis
12.4 Core Systems
12.4.1 Company Overview
12.4.2 Financial
12.4.3 Products/ Services Offered
12.4.4 SWOT Analysis
12.5 CP Technologies
12.5.1 Company Overview
12.5.2 Financial
12.5.3 Products/ Services Offered
12.5.4 SWOT Analysis
12.6 Portwell, Inc.
12.6.1 Company Overview
12.6.2 Financial
12.6.3 Products/ Services Offered
12.6.4 SWOT Analysis
12.7 Symmatrix
12.7.1 Company Overview
12.7.2 Financial
12.7.3 Products/ Services Offered
12.7.4 SWOT Analysis
12.8 Mercury Systems
12.8.1 Company Overview
12.8.2 Financial
12.8.3 Products/ Services Offered
12.8.4 SWOT Analysis
12.9 Trenton Systems
12.9.1 Company Overview
12.9.2 Financial
12.9.3 Products/ Services Offered
12.9.4 SWOT Analysis
12.10 One Stop Systems
12.10.1 Company Overview
12.10.2 Financial
12.10.3 Products/ Services Offered
12.10.4 SWOT Analysis
13. Use Cases and Best Practices
14. Conclusion
An accurate research report requires proper strategizing as well as implementation. There are multiple factors involved in the completion of good and accurate research report and selecting the best methodology to compete the research is the toughest part. Since the research reports we provide play a crucial role in any company’s decision-making process, therefore we at SNS Insider always believe that we should choose the best method which gives us results closer to reality. This allows us to reach at a stage wherein we can provide our clients best and accurate investment to output ratio.
Each report that we prepare takes a timeframe of 350-400 business hours for production. Starting from the selection of titles through a couple of in-depth brain storming session to the final QC process before uploading our titles on our website we dedicate around 350 working hours. The titles are selected based on their current market cap and the foreseen CAGR and growth.
The 5 steps process:
Step 1: Secondary Research:
Secondary Research or Desk Research is as the name suggests is a research process wherein, we collect data through the readily available information. In this process we use various paid and unpaid databases which our team has access to and gather data through the same. This includes examining of listed companies’ annual reports, Journals, SEC filling etc. Apart from this our team has access to various associations across the globe across different industries. Lastly, we have exchange relationships with various university as well as individual libraries.
Step 2: Primary Research
When we talk about primary research, it is a type of study in which the researchers collect relevant data samples directly, rather than relying on previously collected data. This type of research is focused on gaining content specific facts that can be sued to solve specific problems. Since the collected data is fresh and first hand therefore it makes the study more accurate and genuine.
We at SNS Insider have divided Primary Research into 2 parts.
Part 1 wherein we interview the KOLs of major players as well as the upcoming ones across various geographic regions. This allows us to have their view over the market scenario and acts as an important tool to come closer to the accurate market numbers. As many as 45 paid and unpaid primary interviews are taken from both the demand and supply side of the industry to make sure we land at an accurate judgement and analysis of the market.
This step involves the triangulation of data wherein our team analyses the interview transcripts, online survey responses and observation of on filed participants. The below mentioned chart should give a better understanding of the part 1 of the primary interview.
Part 2: In this part of primary research the data collected via secondary research and the part 1 of the primary research is validated with the interviews from individual consultants and subject matter experts.
Consultants are those set of people who have at least 12 years of experience and expertise within the industry whereas Subject Matter Experts are those with at least 15 years of experience behind their back within the same space. The data with the help of two main processes i.e., FGDs (Focused Group Discussions) and IDs (Individual Discussions). This gives us a 3rd party nonbiased primary view of the market scenario making it a more dependable one while collation of the data pointers.
Step 3: Data Bank Validation
Once all the information is collected via primary and secondary sources, we run that information for data validation. At our intelligence centre our research heads track a lot of information related to the market which includes the quarterly reports, the daily stock prices, and other relevant information. Our data bank server gets updated every fortnight and that is how the information which we collected using our primary and secondary information is revalidated in real time.
Step 4: QA/QC Process
After all the data collection and validation our team does a final level of quality check and quality assurance to get rid of any unwanted or undesired mistakes. This might include but not limited to getting rid of the any typos, duplication of numbers or missing of any important information. The people involved in this process include technical content writers, research heads and graphics people. Once this process is completed the title gets uploader on our platform for our clients to read it.
Step 5: Final QC/QA Process:
This is the last process and comes when the client has ordered the study. In this process a final QA/QC is done before the study is emailed to the client. Since we believe in giving our clients a good experience of our research studies, therefore, to make sure that we do not lack at our end in any way humanly possible we do a final round of quality check and then dispatch the study to the client.
Key Segments:
By Offering
Hardware
Software
Services
By Type
Standard
Dedicated
By Memory Size
<256 GB
256 GB−512 GB
>512 GB−1 TB
>1TB
By Application
Military and Aerospace
Industrial
Marine
IT and Telecommunication
Energy & Power
Others
Request for Segment Customization as per your Business Requirement: Segment Customization Request
REGIONAL COVERAGE:
North America
US
Canada
Mexico
Europe
Eastern Europe
Poland
Romania
Hungary
Turkey
Rest of Eastern Europe
Western Europe
Germany
France
UK
Italy
Spain
Netherlands
Switzerland
Austria
Rest of Western Europe
Asia-Pacific
China
India
Japan
South Korea
Vietnam
Singapore
Australia
Rest of Asia-Pacific
Middle East & Africa
UAE
Egypt
Saudi Arabia
Qatar
Rest of the Middle East
Nigeria
South Africa
Rest of Africa
Latin America
Brazil
Argentina
Colombia
Request for Country Level Research Report: Country Level Customization Request
Available Customization
With the given market data, SNS Insider offers customization as per the company’s specific needs. The following customization options are available for the report:
Product Analysis
Criss-Cross segment analysis (e.g. Product X Application)
Product Matrix which gives a detailed comparison of the product portfolio of each company
Geographic Analysis
Additional countries in any of the regions
Company Information
Detailed analysis and profiling of additional market players (Up to five)
Mid Wave Infrared MWIR Sensors Market size was valued at USD 236.8 billion in 2022 and is expected to grow to USD 553.63 billion by 2030 and grow at a CAGR of 11.2% over the forecast period of 2023-2030.
The Passive and Interconnecting Electronic Components Market Size was valued at USD 187.65 billion in 2023 and is expected to reach USD 297.42 billion by 2032 and grow at a CAGR of 5.28% over the forecast period 2024-2032.
The Thyristor Market was valued at USD 1.60 billion in 2023 and is projected to reach USD 2.31 billion by 2032, growing at a CAGR of 4.21% during the forecast period of 2024-2032.
The Static VAR Compensator Market size was valued at USD 883.39 million in 2023 and is expected to grow to USD 1246.51 million by 2032and grow at a CAGR of 3.9 % over the forecast period of 2024-2032.
The Piezoelectric devices market size was valued at USD 32.96 billion in 2023 and is expected to grow to USD 60.05 billion by 2032 and grow at a CAGR Of 6.89 % over the forecast period of 2024-2032.
The Energy Management Systems Market size was valued at USD 39.47 Billion in 2023. It is estimated to reach USD 129.22 Billion by 2032, growing at a CAGR of 14.11% during 2024-2032.
Hi! Click one of our member below to chat on Phone