Smart Contact Lenses Market Size & Overview:
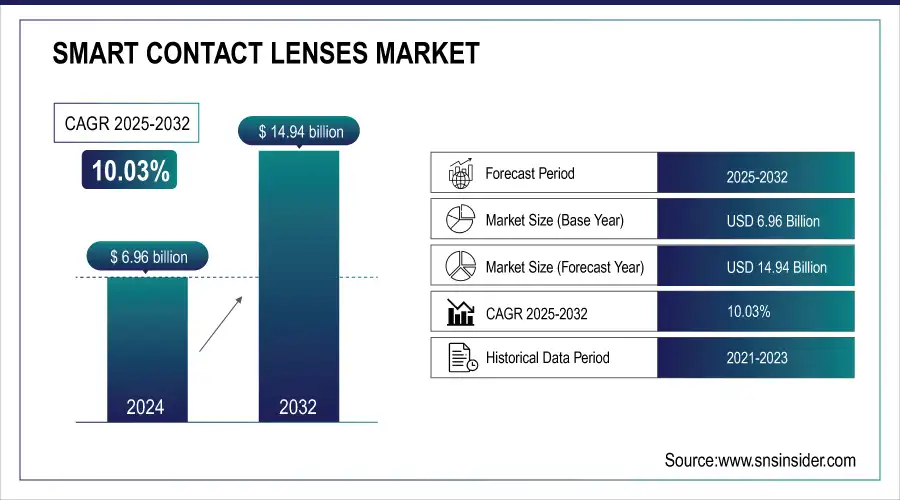
The Smart Contact Lenses Market was valued at USD 6.96 billion in 2024 and is expected to reach USD 14.94 billion by 2032, growing at a CAGR of 10.03% from 2025-2032.
The Smart Contact Lenses Market is experiencing robust growth due to the rising adoption of wearable technology and increasing demand for advanced healthcare solutions. Innovations in miniaturized sensors and drug delivery systems enhance vision monitoring, glucose tracking, and ocular health management, attracting tech-savvy and health-conscious consumers. Growing prevalence of diabetes, eye disorders, and chronic conditions drives the need for non-invasive, continuous monitoring devices. Additionally, investments by tech and healthcare companies in R&D, combined with supportive regulatory frameworks, are accelerating product development. Consumer preference for convenient, real-time health tracking solutions further propels market expansion during the forecast period.

Get More Information on Smart Contact Lenses Market - Request Sample Report
Smart Contact Lenses Market Trends
-
Advancements in wearable technology and miniaturized sensors are driving smart contact lens adoption.
-
Applications in healthcare, including glucose monitoring and ocular diagnostics, are expanding market opportunities.
-
Integration with AR/VR and IoT platforms is enhancing functionality and user experience.
-
Rising demand for vision correction combined with digital features is boosting growth.
-
Increasing R&D investments in biocompatible materials and flexible electronics are enabling innovation.
-
Collaborations between tech companies, medical device firms, and research institutions are accelerating development.
-
Growing consumer interest in futuristic wearable devices is fostering market awareness and adoption.

Smart Contact Lenses Market Growth Drivers
-
The smart contact lenses market is driven by increasing demand for health-monitoring solutions.
Technological progress in sensor integration and augmented reality (AR) has greatly contributed to the increased functionality of smart contact lenses including real-time health monitoring, vision correction, and AR interfaces. For example, Sensimed's Triggerfish, a contact lens with a sensor, facilitates continuous intraocular pressure monitoring and is therefore critical for glaucoma treatment. Moreover, growing health awareness and the rising incidence of chronic diseases like diabetes and glaucoma have fueled the demand for intelligent contact lenses that can monitor glucose levels and eye health. The rise in AR adoption across consumer electronics, gaming, and business applications also provides further impetus to the creation of smart lenses with display capabilities.
Smart Contact Lenses Market Restraints
-
The high costs and regulatory hurdles act as significant restraints to market growth.
The sophisticated manufacturing process needed for embedding sensors in lenses and microelectronic integration involves high production expenses, making such lenses comparatively pricey. For example, the Mojo Vision AR smart lenses are costly, with varying prices that narrow down the pool of potential consumers for mass appeal. In addition, the approval process for medical-grade smart lenses is complex, with challenges in obtaining FDA and CE mark certifications. These long approval cycles slow product launches, hindering growth. Furthermore, the potential for negative effects on eye health after extended use of smart lenses can draw severe regulations. The sophistication involved in handling digital health data through smart lenses also triggers concerns about privacy, with regulatory authorities likely to tighten data protection regulations, which would further slow down market growth.
Smart Contact Lenses Market Opportunities
-
The growing demand for non-invasive health monitoring and consumer electronics offers substantial growth opportunities for smart contact lenses.
Smart lenses with healthcare monitoring functions are moving into glucose monitoring for diabetic care, intraocular pressure (IOP) monitoring for patients with glaucoma, and tear fluid analysis for the detection of systemic illnesses at an early stage. For example, InWith Corporation and other companies are creating smart lenses that can track different health indicators. The accelerating development of augmented reality (AR) technologies offers another major opportunity, especially in gaming, fitness tracking, and navigation. Mojo Vision's AR glasses, for instance, give users an immersive and interactive experience. The increased trend of blue light exposure and digital eye strain is also forcing consumers to demand lenses that relieve visual discomfort stemming from long-term screen use. With more and more people adopting wearable technology, the market demand for multi-featured smart glasses is bound to increase, hence further product innovation and market expansion.
Smart Contact Lenses Market Segment Analysis
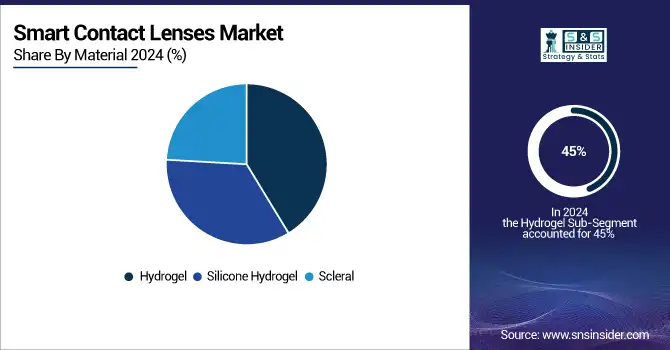
By Material: Hydrogel-based lenses dominated while Scleral lenses are expected to grow fastest
Hydrogel-based smart contact lenses commanded 45% of the market because of their high water content, high oxygen permeability, and increased comfort, hence suitable for extended wear. The lenses are extensively applied in vision correction and medical uses, especially for myopia, presbyopia, and astigmatism. Their biocompatibility guarantees lowered eye irritation, thus becoming an excellent option for users with dry eye syndrome. Besides, hydrogel lenses are inexpensive as compared to other materials, a factor that has also seen them become universally adopted. The coupling of biosensors and microelectronics in hydrogel lenses has, in the last few years, greatly developed their use in monitoring health, e.g., ongoing glucose monitoring and intraocular pressure measurement for patients with glaucoma. Continuing innovations in nanotechnology and smart coatings are bolstering their performance, keeping them as the top option in the smart contact lenses market.
Scleral lenses are witnessing strong growth because they excel with their superior moisture storage, stability, and fitting characteristics for irregular corneas. Their larger size forms a reservoir of fluid that delivers comfort and therapeutic advantages to patients suffering from severe dry eye, keratoconus, and post-operational corneal conditions. Increased demand for biosensor-integrated scleral lenses for glaucoma treatment and persistent intraocular pressure monitoring is fueling adoption. Technological advancements in wireless microelectronics and flexible sensor technology are increasingly finding applications in ophthalmology and personalized medicine and are the most rapidly growing material in the market.

By Technology: Sensor-embedded lenses led while Display technology is projected to grow fastest
Sensor Embedded held 40% of the market because they could offer real-time medical diagnostics and health monitoring. These lenses have biosensors and microfluidic systems to track glucose levels, intraocular pressure, and tear biomarkers continuously without needing to perform invasive tests. The rising incidents of diabetes, glaucoma, and dry eye syndrome have fueled demand for these lenses, especially among patients who need ongoing health monitoring. Firms are developing wireless communication and AI-based analytics, enhancing their effectiveness in early disease detection and telemedicine use cases further. With increasing emphasis on non-invasive wearable healthcare, sensor-integrated lenses have become the leading technology in the market.
Display technology is anticipated to be the fastest growing with the use of augmented reality (AR) and real-time visual overlays. Micro-LED, holographic projection and transparent optical components provide hands-free digital displays, which make smart lenses extremely valuable in navigation, gaming, and business applications. The growing demand for metaverse-compatible wearable technology and immersive digital experiences is driving this segment's fast growth. Developments in self-sustaining micro-displays and adaptive optics are improving AR-enabled lenses, making them the most rapidly growing technology in smart contact lenses.
By Functionality: Vision correction dominated while Health-monitoring lenses are expected to grow fastest
Vision correction was still the leading capability, with a 50% market share, due to rising incidences of myopia, hyperopia, and presbyopia. Auto-focus smart lenses, variable focus length, and adaptive vision as well as dynamics have improved their clarity, for which they have become very appealing for people who suffer from progressing vision loss. Blue-light block lenses and computer eye strain solutions have also contributed to the ubiquity of smart vision-correcting lenses. Continuous innovations in light-sensitive optics, liquid crystals, and real-time prescription adjustment have further solidified their leadership in the market. These lenses are not just correcting vision but are also being used as platforms for embedding AR displays as well as health monitoring capabilities, and hence are a central part of the smart lens industry.
Health-monitoring smart lenses are becoming increasingly popular as non-invasive diagnostic devices for glucose tracking, intraocular pressure monitoring, and tear-fluid biomarker detection. The increased need for constant, real-time health information has spurred investments in biosensor-enabled lenses, enabling patients to track chronic diseases without constant hospitalization. The added capabilities of AI-based analytics and telemedicine support are further increasing their uptake. With healthcare moving towards remote patient monitoring and digital therapeutics, health-monitoring smart lenses are the fastest-growing segment.
By Application: Medical sector led while Sports applications are projected to grow fastest
The medical sector captured 55% of the market, as smart contact lenses are commonly employed for vision correction, disease control, and real-time monitoring of ocular health. The growing incidence of glaucoma, diabetic retinopathy, and age-related vision diseases has fueled demand for biosensor-based lenses that provide continuous intraocular pressure monitoring and glucose sensing. Medical-grade smart lenses offer a non-invasive solution to repeated hospital visits, greatly enhancing patient compliance and convenience. Increased adoption of digital health solutions and investment in wearable medical devices have entrenched the supremacy of the medical application segment.
Sports applications are seeing exponential expansion as athletes and fitness users embrace smart lenses for biometric monitoring and augmented perception. The lenses provide real-time performance data analysis, hydration status, and contrasted visual clarity, which provides a competitive advantage to the athletes. Heads-up displays, motion monitoring, and endurance-tracking capabilities are pushing their usage in professional sports. As more people seek wearable performance-augmentation technology, sports-specific smart lenses are fast catching up.
Smart Contact Lenses Market Regional Analysis
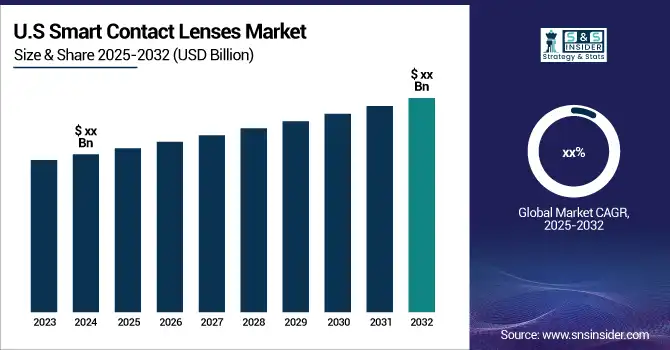
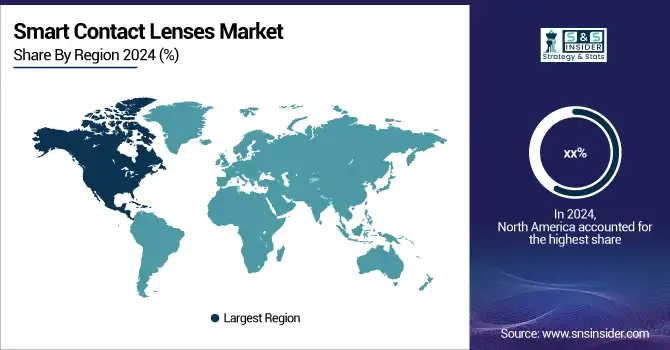
North America Smart Contact Lenses Market Insights
North America dominated the market with the highest share, due to the presence of top companies such as Mojo Vision, Johnson & Johnson, and Sensimed, as well as strong healthcare infrastructure. The region is supported by rising demand for health-monitoring smart lenses, especially in the treatment and management of glaucoma, diabetes, and age-related vision loss. High healthcare expenditure and developments in AR-enabled lenses also support North America's leadership.

Need any customization research on Smart Contact Lenses Market - Enquiry Now
Europe Smart Contact Lenses Market Insights
Europe is also a significant player in the global market for smart contact lenses. The region is marked by increasing demand for augmented reality use cases and eye-health monitoring products. Germany, France, and the UK are witnessing swift innovation in smart lens technology, fueled by high levels of R&D and healthcare investment. Germany and Switzerland are the leaders in creating sensor-integrated lenses for diabetes care and ocular disease diagnosis.
Asia Pacific Smart Contact Lenses Market Insights
The Asia Pacific market, particularly China and Japan, is becoming an important market for smart contact lenses. Increasing eye health awareness, digital eye strain, and rising investments in smart eyewear are driving the growth of the market. With rising disposable incomes and an emphasis on innovation in health technology, the APAC region will witness swift adoption of AR and health-monitoring smart lenses.
Middle East & Africa and Latin America Market Insights
The Middle East & Africa and Latin America regions are witnessing steady growth in the Smart Contact Lenses Market due to increasing healthcare awareness, rising prevalence of eye-related disorders, and growing adoption of wearable medical devices. Improving healthcare infrastructure, technological advancements, and rising disposable incomes are driving demand. Although market penetration is lower compared to developed regions, emerging investments and collaborations are expected to accelerate adoption and contribute to regional market expansion during the forecast period.
Smart Contact Lenses Market Competitive Landscape
Mojo Vision
Mojo Vision, a California-based company, is pioneering the development of augmented reality (AR) smart contact lenses. Their flagship product, the Mojo Lens, integrates a micro-LED display, eye-tracking sensors, and wireless connectivity into a scleral contact lens. This design allows users to access real-time information, such as navigation aids and health metrics, directly in their line of sight. While the company has made significant strides, including FDA Breakthrough Device designation, it has recently shifted focus towards advancing its micro-LED display technology, pausing further development of the Mojo Lens.
-
In 2024, Mojo Vision demonstrated the industry’s smallest and densest full-color RGB micro-LED display for smart lenses using quantum-dot technology at CES 2024, marking a step toward miniaturized AR displays.
-
In 2025, the company continued pivoting away from AR contact lenses, focusing on micro-LED technology, and showcased breakthroughs in micro-LED prototypes at SPIE AR/VR/MR events as part of this new direction.
Alcon
Alcon, a global leader in eye care, is actively engaged in the smart contact lenses market. The company has entered into an agreement with Google to license its "smart lens" technology, aiming to develop lenses capable of measuring tear fluid and wirelessly transmitting data to mobile devices. Additionally, Alcon has launched the PRECISION7 one-week replacement contact lens, featuring the innovative ACTIV-FLO system designed to provide 16 hours of comfort and precise vision. These initiatives underscore Alcon's commitment to advancing ocular health through innovative contact lens technologies.
-
In 2025, Alcon showcased FDA-approved TRYPTYR TRPM8 for dry eye, new SYSTANE PRO PF drops, and expanded MARLO digital tools, emphasizing advanced, technology-driven ocular care and patient management.
Key Players in Smart Contact Lenses Market
-
Sensimed AG
-
Alcon
-
Johnson & Johnson Vision Care
-
Novartis AG
-
CooperVision
-
Bausch & Lomb
-
Google LLC
-
Samsung Electronics Co., Ltd.
-
Sony Corporation
-
XPANCEO
-
Azalea Vision
-
Cylensee Inc.
-
BVS Sight Inc.
-
PHI BIOMED
-
EP Global Communications, Inc.
-
Liner Technologies
-
MediPrint Ophthalmic
Report Attributes | Details |
Market Size in 2024 | USD 6.96 billion |
Market Size by 2032 | USD 14.94 Billion |
CAGR | CAGR of 10.03% From 2024 to 2032 |
Base Year | 2024 |
Forecast Period | 2025-2032 |
Historical Data | 2021-2022 |
Report Scope & Coverage | Market Size, Segments Analysis, Competitive Landscape, Regional Analysis, DROC & SWOT Analysis, Forecast Outlook |
Key Segments | • By Material [Hydrogel, Silicone Hydrogel, Scleral] • By Technology [Sensor Embedded, Display Technology, Microbattery Technology] • By Functionality [Health Monitoring, Augmented Reality, Vision Correction] • By Application [Medical, Sports, Consumer Electronics, Military] |
Regional Analysis/Coverage | North America (US, Canada, Mexico), Europe (Eastern Europe [Poland, Romania, Hungary, Turkey, Rest of Eastern Europe] Western Europe] Germany, France, UK, Italy, Spain, Netherlands, Switzerland, Austria, Rest of Western Europe]), Asia Pacific (China, India, Japan, South Korea, Vietnam, Singapore, Australia, Rest of Asia Pacific), Middle East & Africa (Middle East [UAE, Egypt, Saudi Arabia, Qatar, Rest of Middle East], Africa [Nigeria, South Africa, Rest of Africa], Latin America (Brazil, Argentina, Colombia, Rest of Latin America) |
Company Profiles | Alcon, Johnson & Johnson Vision Care, Novartis AG, CooperVision, Bausch & Lomb, Sensimed AG, Mojo Vision, Innovega Inc., Google LLC, Samsung Electronics Co., Ltd., Sony Corporation, XPANCEO, Azalea Vision, InWith Corp, Cylensee Inc., BVS Sight Inc., PHI BIOMED, EP Global Communications, Inc., Liner Technologies, MediPrint Ophthalmic |
Table Of Contents
1. Introduction
1.1 Market Definition & Scope
1.2 Research Assumptions & Abbreviations
1.3 Research Methodology
2. Executive Summary
2.1 Market Snapshot
2.2 Market Absolute $ Opportunity Assessment & Y-o-Y Analysis, 2021–2032
2.3 Market Size & Forecast, By Segmentation, 2021–2032
2.3.1 Market Size By Material
2.3.2 Market Size By Application
2.3.3 Market Size By Technology
2.3.4 Market Size By Functionality
2.4 Market Share & Bps Analysis By Region, 2024
2.5 Industry Growth Scenarios – Conservative, Likely & Optimistic
2.6 Industry CxO’s Perspective
3. Market Overview
3.1 Market Dynamics
3.1.1 Drivers
3.1.2 Restraints
3.1.3 Opportunities
3.1.4 Key Market Trends
3.2 Industry PESTLE Analysis
3.3 Key Industry Forces (Porter’s) Impacting Market Growth
3.4 Industry Supply Chain Analysis
3.4.1 Raw Material Suppliers
3.4.2 Manufacturers
3.4.3 Distributors/Suppliers
3.4.4 Customers/End-Users
3.5 Industry Life Cycle Assessment
3.6 Parent Market Overview
3.7 Market Risk Assessment
4. Statistical Insights & Trends Reporting
4.1 Pricing & Cost Analysis
4.1.1 Average Price per Smart Contact Lens
4.1.2 Regional Pricing Variations
4.1.3 Cost per Consumer per Month / Year
4.1.4 Pricing Trends for Advanced Features
4.1.5 Insurance Coverage and Out-of-Pocket Expense Analysis
4.2 Device Usage & Consumer Metrics
4.2.1 % Adoption among Diabetic, Vision Correction, and AR/VR Users
4.2.2 Average Wearing Duration per Day
4.2.3 Consumer Demographics (Age, Gender, Region)
4.2.4 Compliance & Replacement Rate (%)
4.2.5 Satisfaction and Comfort Ratings
4.3 Clinical & Performance Metrics
4.3.1 Accuracy of Biosensing / Glucose Monitoring (%)
4.3.2 Response Time for Alerts and Feedback
4.3.3 Adverse Event Rate (%) (Eye Irritation, Infection, Device Malfunction)
4.3.4 Comparative Performance: Smart vs. Conventional Lenses
4.3.5 Patient / User Satisfaction and Quality-of-Life Scores
4.4 Technology & Innovation Metrics
4.4.1 % Adoption of Embedded Sensors, AR/VR Modules, Drug-Delivery Systems
4.4.2 Integration Rate with Mobile Apps, IoT, and Health Platforms (%)
4.4.3 R&D Investment Trends in Materials, Miniaturization, and Connectivity
4.4.4 Patent Filing Trends in Smart Lens Technologies
4.4.5 Emerging Technology Adoption Rate in Key Global Markets
4.5 Regulatory & Compliance Metrics
4.5.1 % Devices Approved by FDA, EMA, PMDA, and Other Authorities
4.5.2 Regional Regulatory Approval Timelines
4.5.3 Compliance with Safety, Optical Standards, and Biocompatibility Guidelines
4.5.4 Post-Market Surveillance and Adverse Event Reporting
4.5.5 Guidelines for Prescription, Marketing, and Consumer Education
5. Smart Contact Lenses Market Segmental Analysis & Forecast, By Material, 2021 – 2032, Value (Usd Billion)
5.1 Introduction
5.2 Hydrogel
5.2.1 Key Trends
5.2.2 Market Size & Forecast, 2021 – 2032
5.3 Silicone Hydrogel
5.3.1 Key Trends
5.3.2 Market Size & Forecast, 2021 – 2032
5.4 Scleral
5.4.1 Key Trends
5.4.2 Market Size & Forecast, 2021 – 2032
6. Smart Contact Lenses Market Segmental Analysis & Forecast, By Application, 2021 – 2032, Value (Usd Billion)
6.1 Introduction
6.2 Medical
6.2.1 Key Trends
6.2.2 Market Size & Forecast, 2021 – 2032
6.3 Sports
6.3.1 Key Trends
6.3.2 Market Size & Forecast, 2021 – 2032
6.4 Consumer Electronics
6.4.1 Key Trends
6.4.2 Market Size & Forecast, 2021 – 2032
6.5 Military
6.5.1 Key Trends
6.5.2 Market Size & Forecast, 2021 – 2032
7. Smart Contact Lenses Market Segmental Analysis & Forecast, By Technology, 2021 – 2032, Value (Usd Billion)
7.1 Introduction
7.2 Sensor Embedded
7.2.1 Key Trends
7.2.2 Market Size & Forecast, 2021 – 2032
7.3 Display Technology
7.3.1 Key Trends
7.3.2 Market Size & Forecast, 2021 – 2032
7.4 Microbattery Technology
7.4.1 Key Trends
7.4.2 Market Size & Forecast, 2021 – 2032
8. Smart Contact Lenses Market Segmental Analysis & Forecast, By Functionality, 2021 – 2032, Value (Usd Billion)
8.1 Introduction
8.2 Health Monitoring
8.2.1 Key Trends
8.2.2 Market Size & Forecast, 2021 – 2032
8.3 Health Monitoring
8.3.1 Key Trends
8.3.2 Market Size & Forecast, 2021 – 2032
8.4 Vision Correction
8.4.1 Key Trends
8.4.2 Market Size & Forecast, 2021 – 2032
9. Smart Contact Lenses Market Segmental Analysis & Forecast By Region, 2021 – 2025, Value (Usd Billion)
9.1 Introduction
9.2 North America
9.2.1 Key Trends
9.2.2 Smart Contact Lenses Market Size & Forecast, By Material, 2021 – 2032
9.2.3 Smart Contact Lenses Market Size & Forecast, By Application, 2021 – 2032
9.2.4 Smart Contact Lenses Market Size & Forecast, By Technology, 2021 – 2032
9.2.5 Smart Contact Lenses Market Size & Forecast, By Functionality, 2021 – 2032
9.2.6 Smart Contact Lenses Market Size & Forecast, By Country, 2021 – 2032
9.2.6.1 USA
9.2.6.1.1 Smart Contact Lenses Market Size & Forecast, By Material, 2021 – 2032
9.2.6.1.2 Smart Contact Lenses Market Size & Forecast, By Application, 2021 – 2032
9.2.6.1.3 Smart Contact Lenses Market Size & Forecast, By Technology, 2021 – 2032
9.2.6.1.4 Smart Contact Lenses Market Size & Forecast, By Functionality, 2021 – 2032
9.2.6.2 Canada
9.2.6.2.1 Smart Contact Lenses Market Size & Forecast, By Material, 2021 – 2032
9.2.6.2.2 Smart Contact Lenses Market Size & Forecast, By Application, 2021 – 2032
9.2.6.2.3 Smart Contact Lenses Market Size & Forecast, By Technology, 2021 – 2032
9.2.6.2.4 Smart Contact Lenses Market Size & Forecast, By Functionality, 2021 – 2032
9.3 Europe
9.3.1 Key Trends
9.3.2 Smart Contact Lenses Market Size & Forecast, By Material, 2021 – 2032
9.3.3 Smart Contact Lenses Market Size & Forecast, By Application, 2021 – 2032
9.3.4 Smart Contact Lenses Market Size & Forecast, By Technology, 2021 – 2032
9.3.5 Smart Contact Lenses Market Size & Forecast, By Functionality, 2021 – 2032
9.3.6 Smart Contact Lenses Market Size & Forecast, By Country, 2021 – 2032
9.3.6.1 Germany
9.3.6.1.1 Smart Contact Lenses Market Size & Forecast, By Material, 2021 – 2032
9.3.6.1.2 Smart Contact Lenses Market Size & Forecast, By Application, 2021 – 2032
9.3.6.1.3 Smart Contact Lenses Market Size & Forecast, By Technology, 2021 – 2032
9.3.6.1.4 Smart Contact Lenses Market Size & Forecast, By Functionality, 2021 – 2032
9.3.6.2 UK
9.3.6.2.1 Smart Contact Lenses Market Size & Forecast, By Material, 2021 – 2032
9.3.6.2.2 Smart Contact Lenses Market Size & Forecast, By Application, 2021 – 2032
9.3.6.2.3 Smart Contact Lenses Market Size & Forecast, By Technology, 2021 – 2032
9.3.6.2.4 Smart Contact Lenses Market Size & Forecast, By Functionality, 2021 – 2032
9.3.6.3 France
9.3.6.3.1 Smart Contact Lenses Market Size & Forecast, By Material, 2021 – 2032
9.3.6.3.2 Smart Contact Lenses Market Size & Forecast, By Application, 2021 – 2032
9.3.6.3.3 Smart Contact Lenses Market Size & Forecast, By Technology, 2021 – 2032
9.3.6.3.4 Smart Contact Lenses Market Size & Forecast, By Functionality, 2021 – 2032
9.3.6.4 Italy
9.3.6.4.1 Smart Contact Lenses Market Size & Forecast, By Material, 2021 – 2032
9.3.6.4.2 Smart Contact Lenses Market Size & Forecast, By Application, 2021 – 2032
9.3.6.4.3 Smart Contact Lenses Market Size & Forecast, By Technology, 2021 – 2032
9.3.6.4.4 Smart Contact Lenses Market Size & Forecast, By Functionality, 2021 – 2032
9.3.6.5 Spain
9.3.6.5.1 Smart Contact Lenses Market Size & Forecast, By Material, 2021 – 2032
9.3.6.5.2 Smart Contact Lenses Market Size & Forecast, By Application, 2021 – 2032
9.3.6.5.3 Smart Contact Lenses Market Size & Forecast, By Technology, 2021 – 2032
9.3.6.5.4 Smart Contact Lenses Market Size & Forecast, By Functionality, 2021 – 2032
9.3.6.6 Russia
9.3.6.6.1 Smart Contact Lenses Market Size & Forecast, By Material, 2021 – 2032
9.3.6.6.2 Smart Contact Lenses Market Size & Forecast, By Application, 2021 – 2032
9.3.6.6.3 Smart Contact Lenses Market Size & Forecast, By Technology, 2021 – 2032
9.3.6.6.4 Smart Contact Lenses Market Size & Forecast, By Functionality, 2021 – 2032
9.3.6.7 Poland
9.3.6.7.1 Smart Contact Lenses Market Size & Forecast, By Material, 2021 – 2032
9.3.6.7.2 Smart Contact Lenses Market Size & Forecast, By Application, 2021 – 2032
9.3.6.7.3 Smart Contact Lenses Market Size & Forecast, By Technology, 2021 – 2032
9.3.6.7.4 Smart Contact Lenses Market Size & Forecast, By Functionality, 2021 – 2032
9.3.6.8 Rest of Europe
9.3.6.8.1 Smart Contact Lenses Market Size & Forecast, By Material, 2021 – 2032
9.3.6.8.2 Smart Contact Lenses Market Size & Forecast, By Application, 2021 – 2032
9.3.6.8.3 Smart Contact Lenses Market Size & Forecast, By Technology, 2021 – 2032
9.3.6.8.4 Smart Contact Lenses Market Size & Forecast, By Functionality, 2021 – 2032
9.4 Asia-Pacific
9.4.1 Key Trends
9.4.2 Smart Contact Lenses Market Size & Forecast, By Material, 2021 – 2032
9.4.3 Smart Contact Lenses Market Size & Forecast, By Application, 2021 – 2032
9.4.4 Smart Contact Lenses Market Size & Forecast, By Technology, 2021 – 2032
9.4.5 Smart Contact Lenses Market Size & Forecast, By Functionality, 2021 – 2032
9.4.6 Smart Contact Lenses Market Size & Forecast, By Country, 2021 – 2032
9.4.6.1 China
9.4.6.1.1 Smart Contact Lenses Market Size & Forecast, By Material, 2021 – 2032
9.4.6.1.2 Smart Contact Lenses Market Size & Forecast, By Application, 2021 – 2032
9.4.6.1.3 Smart Contact Lenses Market Size & Forecast, By Technology, 2021 – 2032
9.4.6.1.4 Smart Contact Lenses Market Size & Forecast, By Functionality, 2021 – 2032
9.4.6.2 India
9.4.6.2.1 Smart Contact Lenses Market Size & Forecast, By Material, 2021 – 2032
9.4.6.2.2 Smart Contact Lenses Market Size & Forecast, By Application, 2021 – 2032
9.4.6.2.3 Smart Contact Lenses Market Size & Forecast, By Technology, 2021 – 2032
9.4.6.2.4 Smart Contact Lenses Market Size & Forecast, By Functionality, 2021 – 2032
9.4.6.3 Japan
9.4.6.3.1 Smart Contact Lenses Market Size & Forecast, By Material, 2021 – 2032
9.4.6.3.2 Smart Contact Lenses Market Size & Forecast, By Application, 2021 – 2032
9.4.6.3.3 Smart Contact Lenses Market Size & Forecast, By Technology, 2021 – 2032
9.4.6.3.4 Smart Contact Lenses Market Size & Forecast, By Functionality, 2021 – 2032
9.4.6.4 South Korea
9.4.6.4.1 Smart Contact Lenses Market Size & Forecast, By Material, 2021 – 2032
9.4.6.4.2 Smart Contact Lenses Market Size & Forecast, By Application, 2021 – 2032
9.4.6.4.3 Smart Contact Lenses Market Size & Forecast, By Technology, 2021 – 2032
9.4.6.4.4 Smart Contact Lenses Market Size & Forecast, By Functionality, 2021 – 2032
9.4.6.5 Australia
9.4.6.5.1 Smart Contact Lenses Market Size & Forecast, By Material, 2021 – 2032
9.4.6.5.2 Smart Contact Lenses Market Size & Forecast, By Application, 2021 – 2032
9.4.6.5.3 Smart Contact Lenses Market Size & Forecast, By Technology, 2021 – 2032
9.4.6.5.4 Smart Contact Lenses Market Size & Forecast, By Functionality, 2021 – 2032
9.4.6.6 ASEAN Countries
9.4.6.6.1 Smart Contact Lenses Market Size & Forecast, By Material, 2021 – 2032
9.4.6.6.2 Smart Contact Lenses Market Size & Forecast, By Application, 2021 – 2032
9.4.6.6.3 Smart Contact Lenses Market Size & Forecast, By Technology, 2021 – 2032
9.4.6.6.4 Smart Contact Lenses Market Size & Forecast, By Functionality, 2021 – 2032
9.4.6.7 Rest of Asia-Pacific
9.4.6.7.1 Smart Contact Lenses Market Size & Forecast, By Material, 2021 – 2032
9.4.6.7.2 Smart Contact Lenses Market Size & Forecast, By Application, 2021 – 2032
9.4.6.7.3 Smart Contact Lenses Market Size & Forecast, By Technology, 2021 – 2032
9.4.6.7.4 Smart Contact Lenses Market Size & Forecast, By Functionality, 2021 – 2032
9.5 Latin America
9.5.1 Key Trends
9.5.2 Smart Contact Lenses Market Size & Forecast, By Material, 2021 – 2032
9.5.3 Smart Contact Lenses Market Size & Forecast, By Application, 2021 – 2032
9.5.4 Smart Contact Lenses Market Size & Forecast, By Technology, 2021 – 2032
9.5.5 Smart Contact Lenses Market Size & Forecast, By Functionality, 2021 – 2032
9.5.6 Smart Contact Lenses Market Size & Forecast, By Country, 2021 – 2032
9.5.6.1 Brazil
9.5.6.1.1 Smart Contact Lenses Market Size & Forecast, By Material, 2021 – 2032
9.5.6.1.2 Smart Contact Lenses Market Size & Forecast, By Application, 2021 – 2032
9.5.6.1.3 Smart Contact Lenses Market Size & Forecast, By Technology, 2021 – 2032
9.5.6.1.4 Smart Contact Lenses Market Size & Forecast, By Functionality, 2021 – 2032
9.5.6.2 Argentina
9.5.6.2.1 Smart Contact Lenses Market Size & Forecast, By Material, 2021 – 2032
9.5.6.2.2 Smart Contact Lenses Market Size & Forecast, By Application, 2021 – 2032
9.5.6.2.3 Smart Contact Lenses Market Size & Forecast, By Technology, 2021 – 2032
9.5.6.2.4 Smart Contact Lenses Market Size & Forecast, By Functionality, 2021 – 2032
9.5.6.3 Mexico
9.5.6.3.1 Smart Contact Lenses Market Size & Forecast, By Material, 2021 – 2032
9.5.6.3.2 Smart Contact Lenses Market Size & Forecast, By Application, 2021 – 2032
9.5.6.3.3 Smart Contact Lenses Market Size & Forecast, By Technology, 2021 – 2032
9.5.6.3.4 Smart Contact Lenses Market Size & Forecast, By Functionality, 2021 – 2032
9.5.6.4 Colombia
9.5.6.4.1 Smart Contact Lenses Market Size & Forecast, By Material, 2021 – 2032
9.5.6.4.2 Smart Contact Lenses Market Size & Forecast, By Application, 2021 – 2032
9.5.6.4.3 Smart Contact Lenses Market Size & Forecast, By Technology, 2021 – 2032
9.5.6.4.4 Smart Contact Lenses Market Size & Forecast, By Functionality, 2021 – 2032
9.5.6.5 Rest of Latin America
9.5.6.5.1 Smart Contact Lenses Market Size & Forecast, By Material, 2021 – 2032
9.5.6.5.2 Smart Contact Lenses Market Size & Forecast, By Application, 2021 – 2032
9.5.6.5.3 Smart Contact Lenses Market Size & Forecast, By Technology, 2021 – 2032
9.5.6.5.4 Smart Contact Lenses Market Size & Forecast, By Functionality, 2021 – 2032
9.6 Middle East & Africa
9.6.1 Key Trends
9.6.2 Smart Contact Lenses Market Size & Forecast, By Material, 2021 – 2032
9.6.3 Smart Contact Lenses Market Size & Forecast, By Application, 2021 – 2032
9.6.4 Smart Contact Lenses Market Size & Forecast, By Technology, 2021 – 2032
9.6.5 Smart Contact Lenses Market Size & Forecast, By Functionality, 2021 – 2032
9.6.6 Smart Contact Lenses Market Size & Forecast, By Country, 2021 – 2032
9.6.6.1 UAE
9.6.6.1.1 Smart Contact Lenses Market Size & Forecast, By Material, 2021 – 2032
9.6.6.1.2 Smart Contact Lenses Market Size & Forecast, By Application, 2021 – 2032
9.6.6.1.3 Smart Contact Lenses Market Size & Forecast, By Technology, 2021 – 2032
9.6.6.1.4 Smart Contact Lenses Market Size & Forecast, By Functionality, 2021 – 2032
9.6.6.2 Saudi Arabia
9.6.6.2.1 Smart Contact Lenses Market Size & Forecast, By Material, 2021 – 2032
9.6.6.2.2 Smart Contact Lenses Market Size & Forecast, By Application, 2021 – 2032
9.6.6.2.3 Smart Contact Lenses Market Size & Forecast, By Technology, 2021 – 2032
9.6.6.2.4 Smart Contact Lenses Market Size & Forecast, By Functionality, 2021 – 2032
9.6.6.3 Qatar
9.6.6.3.1 Smart Contact Lenses Market Size & Forecast, By Material, 2021 – 2032
9.6.6.3.2 Smart Contact Lenses Market Size & Forecast, By Application, 2021 – 2032
9.6.6.3.3 Smart Contact Lenses Market Size & Forecast, By Technology, 2021 – 2032
9.6.6.3.4 Smart Contact Lenses Market Size & Forecast, By Functionality, 2021 – 2032
9.6.6.4 Egypt
9.6.6.4.1 Smart Contact Lenses Market Size & Forecast, By Material, 2021 – 2032
9.6.6.4.2 Smart Contact Lenses Market Size & Forecast, By Application, 2021 – 2032
9.6.6.4.3 Smart Contact Lenses Market Size & Forecast, By Technology, 2021 – 2032
9.6.6.4.4 Smart Contact Lenses Market Size & Forecast, By Functionality, 2021 – 2032
9.6.6.5 South Africa
9.6.6.5.1 Smart Contact Lenses Market Size & Forecast, By Material, 2021 – 2032
9.6.6.5.2 Smart Contact Lenses Market Size & Forecast, By Application, 2021 – 2032
9.6.6.5.3 Smart Contact Lenses Market Size & Forecast, By Technology, 2021 – 2032
9.6.6.5.4 Smart Contact Lenses Market Size & Forecast, By Functionality, 2021 – 2032
9.6.6.6 Rest of Middle East & Africa
9.6.6.6.1 Smart Contact Lenses Market Size & Forecast, By Material, 2021 – 2032
9.6.6.6.2 Smart Contact Lenses Market Size & Forecast, By Application, 2021 – 2032
9.6.6.6.3 Smart Contact Lenses Market Size & Forecast, By Technology, 2021 – 2032
9.6.6.6.4 Smart Contact Lenses Market Size & Forecast, By Functionality, 2021 – 2032
10. Competitive Landscape
10.1 Key Players' Positioning
10.2 Competitive Developments
10.2.1 Key Strategies Adopted (%), By Key Players, 2024
10.2.2 Year-Wise Strategies & Development, 2021 – 2025
10.2.3 Number Of Strategies Adopted By Key Players, 2024
10.3 Market Share Analysis, 2024
10.4 Product/Service & Application Benchmarking
10.4.1 Product/Service Specifications & Features By Key Players
10.4.2 Product/Service Heatmap By Key Players
10.4.3 Application Heatmap By Key Players
10.5 Industry Start-Up & Innovation Landscape
10.6 Key Company Profiles
10.6.1 Alcon
10.6.1.1 Company Overview & Snapshot
10.6.1.2 Product/Service Portfolio
10.6.1.3 Key Company Financials
10.6.1.4 SWOT Analysis
10.6.2 Johnson & Johnson Vision Care
10.6.2.1 Company Overview & Snapshot
10.6.2.2 Product/Service Portfolio
10.6.2.3 Key Company Financials
10.6.2.4 SWOT Analysis
10.6.3 Novartis AG
10.6.3.1 Company Overview & Snapshot
10.6.3.2 Product/Service Portfolio
10.6.3.3 Key Company Financials
10.6.3.4 SWOT Analysis
10.6.4 CooperVision
10.6.4.1 Company Overview & Snapshot
10.6.4.2 Product/Service Portfolio
10.6.4.3 Key Company Financials
10.6.4.4 SWOT Analysis
10.6.5 Bausch & Lomb
10.6.5.1 Company Overview & Snapshot
10.6.5.2 Product/Service Portfolio
10.6.5.3 Key Company Financials
10.6.5.4 SWOT Analysis
10.6.6 Sensimed AG
10.6.6.1 Company Overview & Snapshot
10.6.6.2 Product/Service Portfolio
10.6.6.3 Key Company Financials
10.6.6.4 SWOT Analysis
10.6.7 Mojo Vision
10.6.7.1 Company Overview & Snapshot
10.6.7.2 Product/Service Portfolio
10.6.7.3 Key Company Financials
10.6.7.4 SWOT Analysis
10.6.8 Innovega Inc.
10.6.8.1 Company Overview & Snapshot
10.6.8.2 Product/Service Portfolio
10.6.8.3 Key Company Financials
10.6.8.4 SWOT Analysis
10.6.9 Google LLC
10.6.9.1 Company Overview & Snapshot
10.6.9.2 Product/Service Portfolio
10.6.9.3 Key Company Financials
10.6.9.4 SWOT Analysis
10.6.10 Samsung Electronics Co., Ltd.
10.6.10.1 Company Overview & Snapshot
10.6.10.2 Product/Service Portfolio
10.6.10.3 Key Company Financials
10.6.10.4 SWOT Analysis
10.6.11 Sony Corporation
10.6.11.1 Company Overview & Snapshot
10.6.11.2 Product/Service Portfolio
10.6.11.3 Key Company Financials
10.6.11.4 SWOT Analysis
10.6.12 XPANCEO
10.6.12.1 Company Overview & Snapshot
10.6.12.2 Product/Service Portfolio
10.6.12.3 Key Company Financials
10.6.12.4 SWOT Analysis
10.6.13 Azalea Vision
10.6.13.1 Company Overview & Snapshot
10.6.13.2 Product/Service Portfolio
10.6.13.3 Key Company Financials
10.6.13.4 SWOT Analysis
10.6.14 InWith Corp
10.6.14.1 Company Overview & Snapshot
10.6.14.2 Product/Service Portfolio
10.6.14.3 Key Company Financials
10.6.14.4 SWOT Analysis
10.6.15 Cylensee Inc.
10.6.15.1 Company Overview & Snapshot
10.6.15.2 Product/Service Portfolio
10.6.15.3 Key Company Financials
10.6.15.4 SWOT Analysis
10.6.16 BVS Sight Inc.
10.6.16.1 Company Overview & Snapshot
10.6.16.2 Product/Service Portfolio
10.6.16.3 Key Company Financials
10.6.16.4 SWOT Analysis
10.6.17 PHI BIOMED
10.6.17.1 Company Overview & Snapshot
10.6.17.2 Product/Service Portfolio
10.6.17.3 Key Company Financials
10.6.17.4 SWOT Analysis
10.6.18 EP Global Communications, Inc.
10.6.18.1 Company Overview & Snapshot
10.6.18.2 Product/Service Portfolio
10.6.18.3 Key Company Financials
10.6.18.4 SWOT Analysis
10.6.19 Liner Technologies
10.6.19.1 Company Overview & Snapshot
10.6.19.2 Product/Service Portfolio
10.6.19.3 Key Company Financials
10.6.19.4 SWOT Analysis
10.6.20 MediPrint Ophthalmic
10.6.20.1 Company Overview & Snapshot
10.6.20.2 Product/Service Portfolio
10.6.20.3 Key Company Financials
10.6.20.4 SWOT Analysis
11. Analyst Recommendations
11.1 SNS Insider Opportunity Map
11.2 Industry Low-Hanging Fruit Assessment
11.3 Market Entry & Growth Strategy
11.4 Analyst Viewpoint & Suggestions On Market Growth
12. Assumptions
13. Disclaimer
14. Appendix
14.1 List Of Tables
14.2 List Of Figures
Key Market Segments
By Material
-
Hydrogel
-
Silicone Hydrogel
-
Scleral
By Technology
-
Sensor Embedded
-
Display Technology
-
Microbattery Technology
By Functionality
-
Health Monitoring
-
Augmented Reality
-
Vision Correction
By Application
-
Medical
-
Sports
-
Consumer Electronics
-
Military
Request for Segment Customization as per your Business Requirement: Segment Customization Request
Regional Coverage:
North America
-
US
-
Canada
-
Mexico
Europe
-
Eastern Europe
-
Poland
-
Romania
-
Hungary
-
Turkey
-
Rest of Eastern Europe
-
-
Western Europe
-
Germany
-
France
-
UK
-
Italy
-
Spain
-
Netherlands
-
Switzerland
-
Austria
-
Rest of Western Europe
-
Asia Pacific
-
China
-
India
-
Japan
-
South Korea
-
Vietnam
-
Singapore
-
Australia
-
Rest of Asia Pacific
Middle East & Africa
-
Middle East
-
UAE
-
Egypt
-
Saudi Arabia
-
Qatar
-
Rest of Middle East
-
-
Africa
-
Nigeria
-
South Africa
-
Rest of Africa
-
Latin America
-
Brazil
-
Argentina
-
Colombia
-
Rest of Latin America
Request for Country Level Research Report: Country Level Customization Request
Available Customization
With the given market data, SNS Insider offers customization as per the company’s specific needs. The following customization options are available for the report:
-
Detailed Volume Analysis
-
Criss-Cross segment analysis (e.g. Product X Application)
-
Competitive Product Benchmarking
-
Geographic Analysis
-
Additional countries in any of the regions
-
Customized Data Representation
-
Detailed analysis and profiling of additional market players
An accurate research report requires proper strategizing as well as implementation. There are multiple factors involved in the completion of good and accurate research report and selecting the best methodology to compete the research is the toughest part. Since the research reports we provide play a crucial role in any company’s decision-making process, therefore we at SNS Insider always believe that we should choose the best method which gives us results closer to reality. This allows us to reach at a stage wherein we can provide our clients best and accurate investment to output ratio.
Each report that we prepare takes a timeframe of 350-400 business hours for production. Starting from the selection of titles through a couple of in-depth brain storming session to the final QC process before uploading our titles on our website we dedicate around 350 working hours. The titles are selected based on their current market cap and the foreseen CAGR and growth.
The 5 steps process:
Step 1: Secondary Research:
Secondary Research or Desk Research is as the name suggests is a research process wherein, we collect data through the readily available information. In this process we use various paid and unpaid databases which our team has access to and gather data through the same. This includes examining of listed companies’ annual reports, Journals, SEC filling etc. Apart from this our team has access to various associations across the globe across different industries. Lastly, we have exchange relationships with various university as well as individual libraries.

Step 2: Primary Research
When we talk about primary research, it is a type of study in which the researchers collect relevant data samples directly, rather than relying on previously collected data. This type of research is focused on gaining content specific facts that can be sued to solve specific problems. Since the collected data is fresh and first hand therefore it makes the study more accurate and genuine.
We at SNS Insider have divided Primary Research into 2 parts.
Part 1 wherein we interview the KOLs of major players as well as the upcoming ones across various geographic regions. This allows us to have their view over the market scenario and acts as an important tool to come closer to the accurate market numbers. As many as 45 paid and unpaid primary interviews are taken from both the demand and supply side of the industry to make sure we land at an accurate judgement and analysis of the market.
This step involves the triangulation of data wherein our team analyses the interview transcripts, online survey responses and observation of on filed participants. The below mentioned chart should give a better understanding of the part 1 of the primary interview.

Part 2: In this part of primary research the data collected via secondary research and the part 1 of the primary research is validated with the interviews from individual consultants and subject matter experts.
Consultants are those set of people who have at least 12 years of experience and expertise within the industry whereas Subject Matter Experts are those with at least 15 years of experience behind their back within the same space. The data with the help of two main processes i.e., FGDs (Focused Group Discussions) and IDs (Individual Discussions). This gives us a 3rd party nonbiased primary view of the market scenario making it a more dependable one while collation of the data pointers.
Step 3: Data Bank Validation
Once all the information is collected via primary and secondary sources, we run that information for data validation. At our intelligence centre our research heads track a lot of information related to the market which includes the quarterly reports, the daily stock prices, and other relevant information. Our data bank server gets updated every fortnight and that is how the information which we collected using our primary and secondary information is revalidated in real time.

Step 4: QA/QC Process
After all the data collection and validation our team does a final level of quality check and quality assurance to get rid of any unwanted or undesired mistakes. This might include but not limited to getting rid of the any typos, duplication of numbers or missing of any important information. The people involved in this process include technical content writers, research heads and graphics people. Once this process is completed the title gets uploader on our platform for our clients to read it.
Step 5: Final QC/QA Process:
This is the last process and comes when the client has ordered the study. In this process a final QA/QC is done before the study is emailed to the client. Since we believe in giving our clients a good experience of our research studies, therefore, to make sure that we do not lack at our end in any way humanly possible we do a final round of quality check and then dispatch the study to the client.