Smart Road Market Report Scope & Overview:
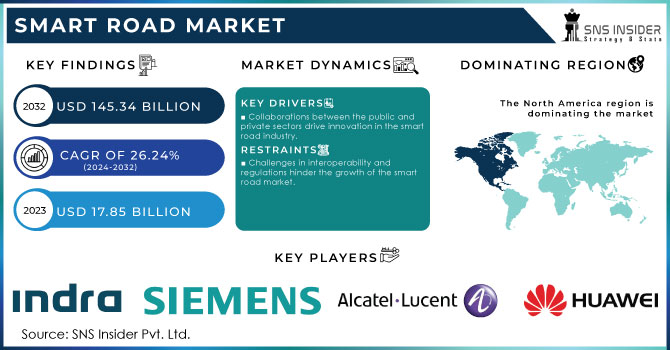
The Smart Road Market size was valued at USD 22.53 billion in 2024. It is estimated to hit USD 145.34 billion by 2032 and grow at a CAGR of 26.24% over the forecast period of 2025-2032.

Get E-PDF Sample Report on Smart Road Market - Request Sample Report
The growth of the electric vehicle industry, from nearly nonexistent in 2010 to 13 million sales in 2023, and the increase in on-demand, intelligent transportation systems are driving this market. There has been a surge in construction activity in the industry, with more than 1,000 new road construction firms appearing in the last five years. On average, each company has hired 58 employees and secured USD 21.8 million in funding per cycle.
The Smart Road Market is growing quickly because of the rise in urbanization and escalating worries about road safety. As urban areas grow increasingly crowded, the need for smart transportation solutions increases. Intelligent highways, with live traffic information, smart traffic control systems, and automated toll payment, present a feasible answer. The market growth is boosted by the emergence of connected and autonomous vehicles (CAVs), which depend on intelligent road infrastructure for smooth communication and navigation. The alarming statistics on road incidents in India in 2022, which involve 4, 61,312 accidents, 1, 68,491 fatalities, and 4, 43,366 injuries, underscore the urgent need for enhanced road facilities. Developments such as a system that can accurately locate vehicles within 1.3 meters at distances of up to 500 meters, created by combining high-definition cameras and millimeter-wave radar, present hopeful answers. Industry leaders in Chicago, Honolulu, and Austin have shown that the United States is leading the way in adopting smart infrastructure to transform public transportation. These efforts together push the Smart Road Market ahead, ensuring transportation systems that are safer, more efficient, and sustainable.
Market Size and Forecast:
-
Market Size in 2024 USD 22.53 Billion
-
Market Size by 2032 USD 145.34 Billion
-
CAGR of 26.24% From 2025 to 2032
-
Base Year 2024
-
Forecast Period 2025-2032
-
Historical Data 2021-2023
Smart Road Market Trends:
-
Increasing adoption of Public-Private Partnerships (P3s) to fund and implement advanced smart road infrastructure.
-
Growing integration of connected and autonomous vehicle technologies with smart road networks to improve safety and traffic management.
-
Utilization of high-tech corridors and smart city initiatives to enhance mobility and urban transportation efficiency.
-
Rising focus on environmental sustainability through innovative projects like solar-powered infrastructure integrated with smart roads.
-
Challenges in standardization and interoperability due to inconsistent regulations and fragmented technology ecosystems, limiting market growth.
Smart Road Market Growth Drivers:
-
Collaborations between the public and private sectors drive innovation in the smart road industry.
The tale of the Lincoln Highway, the first transcontinental highway in America, showcases the effectiveness of Public-Private Partnerships (P3s) in promoting infrastructure progress. Supported by private investors and promoted by the Lincoln Highway Association, this groundbreaking initiative paved the path for contemporary road transportation. In the same way, the Smart Road Market benefits from P3 partnerships. Government budgets stretched thin frequently do not have enough resources to invest in advanced infrastructure beyond basic necessities. Here, P3s close the divide, promoting creativity through uniting various parties. The potential of P3s is highlighted by the I-95 Express Lanes in Virginia. Utilizing information from more than 2,000 points per mile, this extended reversible road in the US, known as a high-tech corridor, allows for safe lane reversals. This project improves traffic flow while also acting as a test area for connected and autonomous vehicles, where Level 4 self-driving cars communicate directly with the infrastructure to increase safety. The WMATA collaborated with a private company to set up a major community solar project on top of carports near the I-95 Express Lanes, showcasing the environmental advantages possible with P3s. P3s extend further than simply constructing infrastructure. In 2016, Columbus, Ohio utilized a USD 50 million Smart Cities Challenge grant to utilize private-sector knowledge in creating a technologically advanced, interconnected city. This project included developing a specialized Technology for improved mobility, investigating self-driving transportation alternatives, and integrating power-producing facilities.
-
The Smart Road Market is being propelled by the merging of connectivity and autonomy.
The fast development of connected and autonomous vehicles (CAVs) is transforming the transportation sector, fueling the expansion of the Smart Road Market. By 2030, it is estimated that 95% of new vehicles will be linked, in contrast to the current 50% rate. The increase in connectivity, along with improvements in 5G technology and C-V2X communication, is setting the groundwork for intelligent transportation systems (ITS). Integrating ITS with CAVs offers the potential to improve road safety, streamline traffic, and alleviate congestion. There is a notable shift happening in the automotive sector, with more connected cars entering the market. The Future Vehicles 2030 report predicts that by 2030, more than 80% of new vehicles in Australia will be linked, with a significant focus on C-ITS and car maker cloud connectivity. This change involves moving from conventional fiber optic-based ITS systems to CV-based ITS systems. The second option uses data from connected vehicles to offer instant traffic updates and alerts to drivers, which helps to minimize the requirement for costly infrastructure and maintenance. With the transportation system advancing towards a more linked and self-governing future, the Smart Road Market is set to experience substantial growth, fueled by the merging of technology and infrastructure.
Smart Road Market Restraints:
-
Challenges in interoperability and regulations hinder the growth of the smart road market.
The Smart Road Market is hindered by the lack of consistent regulations and compatibility between different systems. The divided ecosystem, consisting of government agencies, private companies, and technology providers, functions with different standards and protocols, impeding the development of a cohesive smart road network. The challenges are worsened by issues with interoperability, which involve different systems communicating and sharing data seamlessly. As attempts are being made to deal with these issues, like the revised ITS Directive of November 2023 which aims to make data sharing and crucial safety services easier, and the support provided by ISO 14813-1:2015 in encouraging unity and standard data definitions, achieving a fully interconnected smart road network is still difficult. These obstacles, both regulatory and technical, significantly limit the market's expansion by hindering the effective implementation and use of smart road technologies.
-
The Smart City Challenge: Driving Innovation and Equality in the Smart Road Industry.
The Smart City Challenge by the U.S. Department of Transportation encouraged innovation and competition in American cities, receiving an impressive 78 Technologies. This effort was focused on restructuring city transportation by tackling key issues like inequity, ease of use, and differences in technology. The Smart City Challenge played a crucial role in shaping the Smart Road Market by inspiring cities to create innovative solutions that meet the needs of all residents. This competition emphasized how the market can promote positive social and economic change, showcasing the importance of inclusive and fair development of smart cities.
Smart Road Market Segment Analysis:
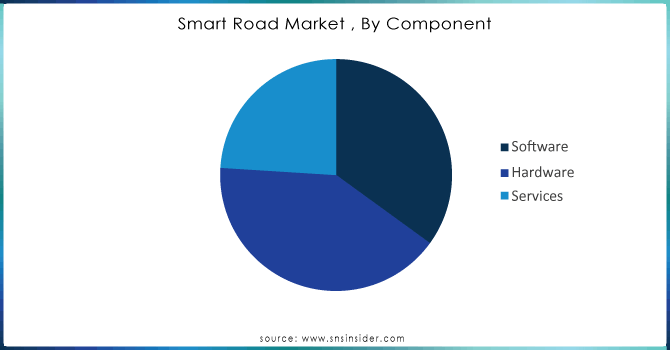
By Component
In 2024, hardware components dominated the Smart Road Market, accounting for 41% of the market share. This highlights the crucial role that physical infrastructure plays in the advancement and functioning of intelligent road systems. For smart roads to operate effectively in tough conditions and heavy traffic, road sensors, traffic cameras, variable message signs, and toll collection systems are necessary. Sensors located in the road or on the pavement track traffic patterns, speed of vehicles, and road surface conditions. These sensors collect crucial real-time data that is necessary for controlling traffic and ensuring safety. Kapsch TrafficCom and Sensys Networks stress the vital role of reliable physical infrastructure in enhancing intelligent transportation systems. Sophisticated road sensors, traffic cameras, variable message signs, and toll collection systems are necessary components for enabling the efficient operation of intelligent roadways.
Based on Technology, Intelligent Transportation Management System dominated the Smart Road Market with 28% of share in 2024. TMS's significance stems from their critical role in enhancing traffic conditions by utilizing advanced data analysis and real-time decision-making. By utilizing information from different sources, ITMS allow authorities to make educated choices regarding signal timing, lane configurations, and variable speed limits, ultimately improving traffic flow and road safety. Top companies such as Kapsch TrafficCom, Sensys Networks, TransCore, and Siemens Mobility are leading the way in this market by offering cutting-edge ITMS solutions that are shaping the development of intelligent road infrastructure.

Get Customized Report as Per Your Business Requirement - Request For Customized Report
Smart Road Market Regional Analysis:
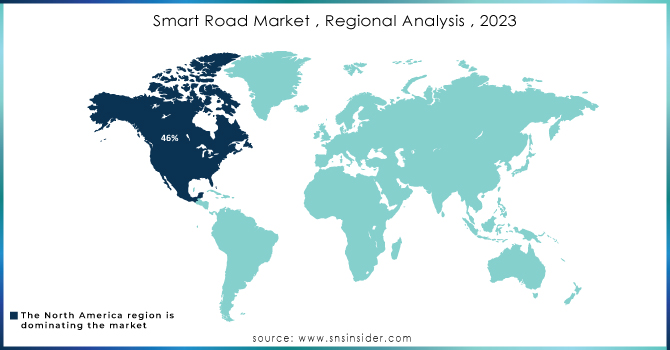
North America Smart Road Market Insights
North America dominated the Smart Road market with 46% of share in 2024. The reason for this dominance is credited to the region's strong infrastructure and its proactive stance on technological progress. Effective transportation systems along with a commitment to innovation have allowed North America to quickly embrace and incorporate smart road technologies. Moreover, the region's market growth is being driven by the growing need for effective transportation solutions as traffic congestion continues to rise. The well-developed transportation infrastructure in North America, comprising highways, bridges, and urban roads, offers a strong base for integrating smart road technologies. Government initiatives like the U.S. Department of Transportation's Smart City Challenge and the Canadian Smart Cities Challenge promote the advancement of smart transportation solutions.
Asia Pacific Smart Road Market Insights
Asia Pacific is the fastest growing in Smart Road market with 21 % of share in 2024. Rapid urbanization and population growth are driving significant demand for efficient transportation systems. Smart roads, with their capabilities in improving traffic management, alleviating congestion, and enhancing safety, present a compelling solution to these challenges. This demand positions Asia Pacific as a major growth driver in the coming years. Key companies contributing to this market include Kapsch TrafficCom, which offers intelligent transportation systems, and Siemens Mobility, known for its advanced traffic management solutions. Additionally, TransCore’s extensive range of smart transportation solutions further supports the region's market growth. These companies' innovative technologies are essential in meeting the evolving transportation needs of the rapidly urbanizing Asia Pacific, ensuring better traffic flow and improved road safety.
Europe Smart Road Market Insights
The Europe smart road market is witnessing steady growth, driven by rising government investments, smart city initiatives, and adoption of connected and autonomous vehicle technologies. Strong emphasis on sustainable infrastructure and energy-efficient solutions, combined with supportive regulations, is accelerating deployment. Collaborative projects between public and private sectors further enhance traffic management, safety, and technological innovation across the region.
Latin America (LATAM) and Middle East & Africa (MEA) Smart Road Market Insights
The smart road market in LATAM and MEA is expanding due to increasing urbanization, growing traffic congestion, and rising investments in intelligent transportation systems. Governments are promoting infrastructure modernization and public-private collaborations to improve mobility, safety, and energy efficiency. Emerging adoption of connected vehicle technologies and smart city initiatives is creating opportunities for market growth across both regions.

Smart Road Market Key Players:
Indra Sistemas, Huawei, Siemens AG, Alcatel Lucent, LG CNS, Cisco, Kapsch TrafficCom, Xerox Corporation, Schneider Electric SE, International Business Machines Corporation (IBM)
Recent Development
-
May 2023, Italy launches a Smart Roads 4.0 system in Taormina, aiming to link vehicles using advanced technology for improved traffic management.
-
January 2023, China unveils its first fully smart highway, a 157-kilometer stretch equipped with smart pillars that gather road data and alert drivers to traffic issues.
-
May 2022, U.K. government upgrades technology on England’s smart highways to better detect breakdowns and maintain traffic flow.
-
May 2024, Siemens Mobility launches Smart Train Lease Concept in Rolling Stock Market
Report Attributes | Details |
Market Size in 2024 | USD 22.53 Billion |
Market Size by 2032 | USD 145.34 Billion |
CAGR | CAGR of 26.24% From 2025 to 2032 |
Base Year | 2024 |
Forecast Period | 2025-2032 |
Historical Data | 2021-2023 |
Report Scope & Coverage | Market Size, Segments Analysis, Competitive Landscape, Regional Analysis, DROC & SWOT Analysis, Forecast Outlook |
Key Segments | • By Technology (Monitoring System, Intelligent Management System, Intelligent Transportation Management System, Communication System, and Others) • By Component (Software, Hardware, and Services) • By Deployment Mode (Cloud and On-Premise) |
Regional Analysis/Coverage | North America (US, Canada, Mexico), Europe (Eastern Europe [Poland, Romania, Hungary, Turkey, Rest of Eastern Europe] Western Europe] Germany, France, UK, Italy, Spain, Netherlands, Switzerland, Austria, Rest of Western Europe]). Asia Pacific (China, India, Japan, South Korea, Vietnam, Singapore, Australia, Rest of Asia Pacific), Middle East & Africa (Middle East [UAE, Egypt, Saudi Arabia, Qatar, Rest of Middle East], Africa [Nigeria, South Africa, Rest of Africa], Latin America (Brazil, Argentina, Colombia Rest of Latin America) |
Company Profiles | Sistemas, Huawei, Siemens AG, Alcatel Lucent, Kapsch AG, S.A., LG CNS, Cisco, Kapsch TrafficCom, Xerox Corporation |
Table Of Contents
1. Introduction
1.1 Market Definition & Scope
1.2 Research Assumptions & Abbreviations
1.3 Research Methodology
2. Executive Summary
2.1 Market Snapshot
2.2 Market Absolute $ Opportunity Assessment & Y-o-Y Analysis, 2021–2032
2.3 Market Size & Forecast, By Segmentation, 2021–2032
2.3.1 Market Size By Component
2.3.2 Market Size By Technology
2.3.3 Market Size By Deployment Mode
2.4 Market Share & Bps Analysis By Region, 2024
2.5 Industry Growth Scenarios – Conservative, Likely & Optimistic
2.6 Industry CxO’s Perspective
3. Market Overview
3.1 Market Dynamics
3.1.1 Drivers
3.1.2 Restraints
3.1.3 Opportunities
3.1.4 Key Market Trends
3.2 Industry PESTLE Analysis
3.3 Key Industry Forces (Porter’s) Impacting Market Growth
3.4 Industry Supply Chain Analysis
3.4.1 Raw Material Suppliers
3.4.2 Manufacturers
3.4.3 Distributors/Suppliers
3.4.4 Customers/End-Users
3.5 Industry Life Cycle Assessment
3.6 Parent Market Overview
3.7 Market Risk Assessment
4. Statistical Insights & Trends Reporting
4.1 Efficiency & Performance Metrics
4.1.1 Average reduction (%) in traffic congestion through smart road management systems
4.1.2 Improvement (%) in vehicle flow efficiency enabled by IoT-based traffic sensors
4.1.3 Reduction (%) in average travel time due to adaptive traffic signals and smart routing
4.2 Adoption & Application Trends
4.2.1 Share of smart road projects by application (intelligent traffic systems, smart lighting, EV charging lanes, solar roads, communication infrastructure) (%)
4.2.2 Growth (%) in adoption of Vehicle-to-Infrastructure (V2I) communication technologies
4.2.3 Market penetration (%) of renewable energy-integrated roadways (solar panels, piezoelectric surfaces)
4.3 Technology & Innovation Metrics
4.3.1 Average increase (%) in road safety from AI-driven monitoring & accident detection
4.3.2 Growth (%) in investment in autonomous vehicle-ready smart road infrastructure
4.3.3 Share of smart roads equipped with real-time environmental & weather monitoring (%)
4.4 Cost & Accessibility Benchmarks
4.4.1 Average project cost (USD million per km) for smart road deployments across regions
4.4.2 Average cost savings (%) from reduced accidents, traffic delays, and maintenance using predictive analytics
4.4.3 Share of public-private partnerships (PPPs) in global smart road funding (%)
5. Smart Road Market Segmental Analysis & Forecast, By Component, 2021 – 2032, Value (USD Billion)
5.1 Introduction
5.2 Software
5.2.1 Key Trends
5.2.2 Market Size & Forecast, 2021 – 2032
5.3 Hardware
5.4 Services
6. Smart Road Market Segmental Analysis & Forecast, By Technology, 2021 – 2032, Value (USD Billion)
6.1 Introduction
6.2 Monitoring System
6.2.1 Key Trends
6.2.2 Market Size & Forecast, 2021 – 2032
6.3 Intelligent Management System
6.4 Intelligent Transportation Management System
6.5 Communication System
6.6 Others
7. Smart Road Market Segmental Analysis & Forecast, By Deployment Mode, 2021 – 2032, Value (USD Billion)
7.1 Introduction
7.2 Cloud
7.2.1 Key Trends
7.2.2 Market Size & Forecast, 2021 – 2032
7.3 On-Premise
8. Smart Road Market Segmental Analysis & Forecast By Region, 2021 – 2025, Value (USD Billion)
8.1 Introduction
8.2 North America
8.2.1 Key Trends
8.2.2 Smart Road Market Size & Forecast, By Component, 2021 – 2032
8.2.3 Smart Road Market Size & Forecast, By Technology, 2021 – 2032
8.2.4 Smart Road Market Size & Forecast, By Deployment Mode, 2021 – 2032
8.2.5 Smart Road Market Size & Forecast, By Country, 2021 – 2032
8.2.5.1 USA
8.2.5.1.1 Smart Road Market Size & Forecast, By Component, 2021 – 2032
8.2.5.1.2 Smart Road Market Size & Forecast, By Technology, 2021 – 2032
8.2.5.1.3 Smart Road Market Size & Forecast, By Deployment Mode, 2021 – 2032
8.2.5.2 Canada
8.2.5.2.1 Smart Road Market Size & Forecast, By Component, 2021 – 2032
8.2.5.2.2 Smart Road Market Size & Forecast, By Technology, 2021 – 2032
8.2.5.2.3 Smart Road Market Size & Forecast, By Deployment Mode, 2021 – 2032
8.3 Europe
8.3.1 Key Trends
8.3.2 Smart Road Market Size & Forecast, By Component, 2021 – 2032
8.3.3 Smart Road Market Size & Forecast, By Technology, 2021 – 2032
8.3.4 Smart Road Market Size & Forecast, By Deployment Mode, 2021 – 2032
8.3.5 Smart Road Market Size & Forecast, By Country, 2021 – 2032
8.3.5.1 Germany
8.3.5.1.1 Smart Road Market Size & Forecast, By Component, 2021 – 2032
8.3.5.1.2 Smart Road Market Size & Forecast, By Technology, 2021 – 2032
8.3.5.1.3 Smart Road Market Size & Forecast, By Deployment Mode, 2021 – 2032
8.3.5.2 UK
8.3.5.2.1 Smart Road Market Size & Forecast, By Component, 2021 – 2032
8.3.5.2.2 Smart Road Market Size & Forecast, By Technology, 2021 – 2032
8.3.5.2.3 Smart Road Market Size & Forecast, By Deployment Mode, 2021 – 2032
8.3.5.3 France
8.3.5.3.1 Smart Road Market Size & Forecast, By Component, 2021 – 2032
8.3.5.3.2 Smart Road Market Size & Forecast, By Technology, 2021 – 2032
8.3.5.3.3 Smart Road Market Size & Forecast, By Deployment Mode, 2021 – 2032
8.3.5.4 Italy
8.3.5.4.1 Smart Road Market Size & Forecast, By Component, 2021 – 2032
8.3.5.4.2 Smart Road Market Size & Forecast, By Technology, 2021 – 2032
8.3.5.4.3 Smart Road Market Size & Forecast, By Deployment Mode, 2021 – 2032
8.3.5.5 Spain
8.3.5.5.1 Smart Road Market Size & Forecast, By Component, 2021 – 2032
8.3.5.5.2 Smart Road Market Size & Forecast, By Technology, 2021 – 2032
8.3.5.5.3 Smart Road Market Size & Forecast, By Deployment Mode, 2021 – 2032
8.3.5.6 Russia
8.3.5.6.1 Smart Road Market Size & Forecast, By Component, 2021 – 2032
8.3.5.6.2 Smart Road Market Size & Forecast, By Technology, 2021 – 2032
8.3.5.6.3 Smart Road Market Size & Forecast, By Deployment Mode, 2021 – 2032
8.3.5.7 Poland
8.3.5.7.1 Smart Road Market Size & Forecast, By Component, 2021 – 2032
8.3.5.7.2 Smart Road Market Size & Forecast, By Technology, 2021 – 2032
8.3.5.7.3 Smart Road Market Size & Forecast, By Deployment Mode, 2021 – 2032
8.3.5.8 Rest of Europe
8.3.5.8.1 Smart Road Market Size & Forecast, By Component, 2021 – 2032
8.3.5.8.2 Smart Road Market Size & Forecast, By Technology, 2021 – 2032
8.3.5.8.3 Smart Road Market Size & Forecast, By Deployment Mode, 2021 – 2032
8.4 Asia-Pacific
8.4.1 Key Trends
8.4.2 Smart Road Market Size & Forecast, By Component, 2021 – 2032
8.4.3 Smart Road Market Size & Forecast, By Technology, 2021 – 2032
8.4.4 Smart Road Market Size & Forecast, By Deployment Mode, 2021 – 2032
8.4.5 Smart Road Market Size & Forecast, By Country, 2021 – 2032
8.4.5.1 China
8.4.5.1.1 Smart Road Market Size & Forecast, By Component, 2021 – 2032
8.4.5.1.2 Smart Road Market Size & Forecast, By Technology, 2021 – 2032
8.4.5.1.3 Smart Road Market Size & Forecast, By Deployment Mode, 2021 – 2032
8.4.5.2 India
8.4.5.2.1 Smart Road Market Size & Forecast, By Component, 2021 – 2032
8.4.5.2.2 Smart Road Market Size & Forecast, By Technology, 2021 – 2032
8.4.5.2.3 Smart Road Market Size & Forecast, By Deployment Mode, 2021 – 2032
8.4.5.3 Japan
8.4.5.3.1 Smart Road Market Size & Forecast, By Component, 2021 – 2032
8.4.5.3.2 Smart Road Market Size & Forecast, By Technology, 2021 – 2032
8.4.5.3.3 Smart Road Market Size & Forecast, By Deployment Mode, 2021 – 2032
8.4.5.4 South Korea
8.4.5.4.1 Smart Road Market Size & Forecast, By Component, 2021 – 2032
8.4.5.4.2 Smart Road Market Size & Forecast, By Technology, 2021 – 2032
8.4.5.4.3 Smart Road Market Size & Forecast, By Deployment Mode, 2021 – 2032
8.4.5.5 Australia
8.4.5.5.1 Smart Road Market Size & Forecast, By Component, 2021 – 2032
8.4.5.5.2 Smart Road Market Size & Forecast, By Technology, 2021 – 2032
8.4.5.5.3 Smart Road Market Size & Forecast, By Deployment Mode, 2021 – 2032
8.4.5.6 ASEAN Countries
8.4.5.6.1 Smart Road Market Size & Forecast, By Component, 2021 – 2032
8.4.5.6.2 Smart Road Market Size & Forecast, By Technology, 2021 – 2032
8.4.5.6.3 Smart Road Market Size & Forecast, By Deployment Mode, 2021 – 2032
8.4.5.7 Rest of Asia-Pacific
8.4.5.7.1 Smart Road Market Size & Forecast, By Component, 2021 – 2032
8.4.5.7.2 Smart Road Market Size & Forecast, By Technology, 2021 – 2032
8.4.5.7.3 Smart Road Market Size & Forecast, By Deployment Mode, 2021 – 2032
8.5 Latin America
8.5.1 Key Trends
8.5.2 Smart Road Market Size & Forecast, By Component, 2021 – 2032
8.5.3 Smart Road Market Size & Forecast, By Technology, 2021 – 2032
8.5.4 Smart Road Market Size & Forecast, By Deployment Mode, 2021 – 2032
8.5.5 Smart Road Market Size & Forecast, By Country, 2021 – 2032
8.5.5.1 Brazil
8.5.5.1.1 Smart Road Market Size & Forecast, By Component, 2021 – 2032
8.5.5.1.2 Smart Road Market Size & Forecast, By Technology, 2021 – 2032
8.5.5.1.3 Smart Road Market Size & Forecast, By Deployment Mode, 2021 – 2032
8.5.5.2 Argentina
8.5.5.2.1 Smart Road Market Size & Forecast, By Component, 2021 – 2032
8.5.5.2.2 Smart Road Market Size & Forecast, By Technology, 2021 – 2032
8.5.5.2.3 Smart Road Market Size & Forecast, By Deployment Mode, 2021 – 2032
8.5.5.3 Mexico
8.5.5.3.1 Smart Road Market Size & Forecast, By Component, 2021 – 2032
8.5.5.3.2 Smart Road Market Size & Forecast, By Technology, 2021 – 2032
8.5.5.3.3 Smart Road Market Size & Forecast, By Deployment Mode, 2021 – 2032
8.5.5.4 Colombia
8.5.5.4.1 Smart Road Market Size & Forecast, By Component, 2021 – 2032
8.5.5.4.2 Smart Road Market Size & Forecast, By Technology, 2021 – 2032
8.5.5.4.3 Smart Road Market Size & Forecast, By Deployment Mode, 2021 – 2032
8.5.5.5 Rest of Latin America
8.5.5.5.1 Smart Road Market Size & Forecast, By Component, 2021 – 2032
8.5.5.5.2 Smart Road Market Size & Forecast, By Technology, 2021 – 2032
8.5.5.5.3 Smart Road Market Size & Forecast, By Deployment Mode, 2021 – 2032
8.6 Middle East & Africa
8.6.1 Key Trends
8.6.2 Smart Road Market Size & Forecast, By Component, 2021 – 2032
8.6.3 Smart Road Market Size & Forecast, By Technology, 2021 – 2032
8.6.4 Smart Road Market Size & Forecast, By Deployment Mode, 2021 – 2032
8.6.5 Smart Road Market Size & Forecast, By Country, 2021 – 2032
8.6.5.1 UAE
8.6.5.1.1 Smart Road Market Size & Forecast, By Component, 2021 – 2032
8.6.5.1.2 Smart Road Market Size & Forecast, By Technology, 2021 – 2032
8.6.5.1.3 Smart Road Market Size & Forecast, By Deployment Mode, 2021 – 2032
8.6.5.2 Saudi Arabia
8.6.5.2.1 Smart Road Market Size & Forecast, By Component, 2021 – 2032
8.6.5.2.2 Smart Road Market Size & Forecast, By Technology, 2021 – 2032
8.6.5.2.3 Smart Road Market Size & Forecast, By Deployment Mode, 2021 – 2032
8.6.5.3 Qatar
8.6.5.3.1 Smart Road Market Size & Forecast, By Component, 2021 – 2032
8.6.5.3.2 Smart Road Market Size & Forecast, By Technology, 2021 – 2032
8.6.5.3.3 Smart Road Market Size & Forecast, By Deployment Mode, 2021 – 2032
8.6.5.4 Egypt
8.6.5.4.1 Smart Road Market Size & Forecast, By Component, 2021 – 2032
8.6.5.4.2 Smart Road Market Size & Forecast, By Technology, 2021 – 2032
8.6.5.4.3 Smart Road Market Size & Forecast, By Deployment Mode, 2021 – 2032
8.6.5.5 South Africa
8.6.5.5.1 Smart Road Market Size & Forecast, By Component, 2021 – 2032
8.6.5.5.2 Smart Road Market Size & Forecast, By Technology, 2021 – 2032
8.6.5.5.3 Smart Road Market Size & Forecast, By Deployment Mode, 2021 – 2032
8.6.5.6 Rest of Middle East & Africa
8.6.5.6.1 Smart Road Market Size & Forecast, By Component, 2021 – 2032
8.6.5.6.2 Smart Road Market Size & Forecast, By Technology, 2021 – 2032
8.6.5.6.3 Smart Road Market Size & Forecast, By Deployment Mode, 2021 – 2032
9. Competitive Landscape
9.1 Key Players' Positioning
9.2 Competitive Developments
9.2.1 Key Strategies Adopted (%), By Key Players, 2024
9.2.2 Year-Wise Strategies & Development, 2021 – 2025
9.2.3 Number Of Strategies Adopted By Key Players, 2024
9.3 Market Share Analysis, 2024
9.4 Product/Service & Application Benchmarking
9.4.1 Product/Service Specifications & Features By Key Players
9.4.2 Product/Service Heatmap By Key Players
9.4.3 Application Heatmap By Key Players
9.5 Industry Start-Up & Innovation Landscape
9.6 Key Company Profiles
9.6.1 Indra Sistemas S.A.
9.6.1.1 Company Overview & Snapshot
9.6.1.2 Product/Service Portfolio
9.6.1.3 Key Company Financials
9.6.1.4 SWOT Analysis
9.6.2 Huawei Technologies Co., Ltd.
9.6.3 Siemens AG
9.6.4 Alcatel-Lucent (Nokia)
9.6.5 LG CNS
9.6.6 Cisco Systems, Inc.
9.6.7 Kapsch TrafficCom AG
9.6.8 Xerox Corporation
9.6.9 Schneider Electric SE
9.6.10 IBM Corporation
9.6.11 Swarco Holding AG
9.6.12 ALE International
9.6.13 Motorola Solutions, Inc.
9.6.14 Verra Mobility
9.6.15 Teledyne FLIR
9.6.16 Honeywell International Inc.
9.6.17 SAP SE
9.6.18 Panasonic Corporation
9.6.19 AT&T Intellectual Property
9.6.20 Veniam
10. Analyst Recommendations
10.1 SNS Insider Opportunity Map
10.2 Industry Low-Hanging Fruit Assessment
10.3 Market Entry & Growth Strategy
10.4 Analyst Viewpoint & Suggestions On Market Growth
11. Assumptions
12. Disclaimer
13. Appendix
13.1 List Of Tables
13.2 List Of Figures
Key Segments:
By Component
-
Software
-
Hardware
-
Services
By Technology
-
Monitoring System
-
Intelligent Management System
-
Intelligent Transportation Management System
-
Communication System
-
Others
By Deployment Mode
-
Cloud
-
On-Premise
Request for Segment Customization as per your Business Requirement: Segment Customization Request
REGIONAL COVERAGE:
North America
-
US
-
Canada
-
Mexico
Europe
-
Eastern Europe
-
Poland
-
Romania
-
Hungary
-
Turkey
-
Rest of Eastern Europe
-
-
Western Europe
-
Germany
-
France
-
UK
-
Italy
-
Spain
-
Netherlands
-
Switzerland
-
Austria
-
Rest of Western Europe
-
Asia Pacific
-
China
-
India
-
Japan
-
South Korea
-
Vietnam
-
Singapore
-
Australia
-
Rest of Asia Pacific
Middle East & Africa
-
Middle East
-
UAE
-
Egypt
-
Saudi Arabia
-
Qatar
-
Rest of the Middle East
-
-
Africa
-
Nigeria
-
South Africa
-
Rest of Africa
-
Latin America
-
Brazil
-
Argentina
-
Colombia
Request for Country Level Research Report: Country Level Customization Request
Available Customization
With the given market data, SNS Insider offers customization as per the company’s specific needs. The following customization options are available for the report:
-
Product Analysis
-
Criss-Cross segment analysis (e.g. Product X Application)
-
Product Matrix which gives a detailed comparison of product portfolio of each company
-
Geographic Analysis
-
Additional countries in any of the regions
-
Company Information
-
Detailed analysis and profiling of additional market players (Up to five)
An accurate research report requires proper strategizing as well as implementation. There are multiple factors involved in the completion of good and accurate research report and selecting the best methodology to compete the research is the toughest part. Since the research reports we provide play a crucial role in any company’s decision-making process, therefore we at SNS Insider always believe that we should choose the best method which gives us results closer to reality. This allows us to reach at a stage wherein we can provide our clients best and accurate investment to output ratio.
Each report that we prepare takes a timeframe of 350-400 business hours for production. Starting from the selection of titles through a couple of in-depth brain storming session to the final QC process before uploading our titles on our website we dedicate around 350 working hours. The titles are selected based on their current market cap and the foreseen CAGR and growth.
The 5 steps process:
Step 1: Secondary Research:
Secondary Research or Desk Research is as the name suggests is a research process wherein, we collect data through the readily available information. In this process we use various paid and unpaid databases which our team has access to and gather data through the same. This includes examining of listed companies’ annual reports, Journals, SEC filling etc. Apart from this our team has access to various associations across the globe across different industries. Lastly, we have exchange relationships with various university as well as individual libraries.

Step 2: Primary Research
When we talk about primary research, it is a type of study in which the researchers collect relevant data samples directly, rather than relying on previously collected data. This type of research is focused on gaining content specific facts that can be sued to solve specific problems. Since the collected data is fresh and first hand therefore it makes the study more accurate and genuine.
We at SNS Insider have divided Primary Research into 2 parts.
Part 1 wherein we interview the KOLs of major players as well as the upcoming ones across various geographic regions. This allows us to have their view over the market scenario and acts as an important tool to come closer to the accurate market numbers. As many as 45 paid and unpaid primary interviews are taken from both the demand and supply side of the industry to make sure we land at an accurate judgement and analysis of the market.
This step involves the triangulation of data wherein our team analyses the interview transcripts, online survey responses and observation of on filed participants. The below mentioned chart should give a better understanding of the part 1 of the primary interview.

Part 2: In this part of primary research the data collected via secondary research and the part 1 of the primary research is validated with the interviews from individual consultants and subject matter experts.
Consultants are those set of people who have at least 12 years of experience and expertise within the industry whereas Subject Matter Experts are those with at least 15 years of experience behind their back within the same space. The data with the help of two main processes i.e., FGDs (Focused Group Discussions) and IDs (Individual Discussions). This gives us a 3rd party nonbiased primary view of the market scenario making it a more dependable one while collation of the data pointers.
Step 3: Data Bank Validation
Once all the information is collected via primary and secondary sources, we run that information for data validation. At our intelligence centre our research heads track a lot of information related to the market which includes the quarterly reports, the daily stock prices, and other relevant information. Our data bank server gets updated every fortnight and that is how the information which we collected using our primary and secondary information is revalidated in real time.

Step 4: QA/QC Process
After all the data collection and validation our team does a final level of quality check and quality assurance to get rid of any unwanted or undesired mistakes. This might include but not limited to getting rid of the any typos, duplication of numbers or missing of any important information. The people involved in this process include technical content writers, research heads and graphics people. Once this process is completed the title gets uploader on our platform for our clients to read it.
Step 5: Final QC/QA Process:
This is the last process and comes when the client has ordered the study. In this process a final QA/QC is done before the study is emailed to the client. Since we believe in giving our clients a good experience of our research studies, therefore, to make sure that we do not lack at our end in any way humanly possible we do a final round of quality check and then dispatch the study to the client.