Smart Therapeutic Devices Market Report Scope & Overview:
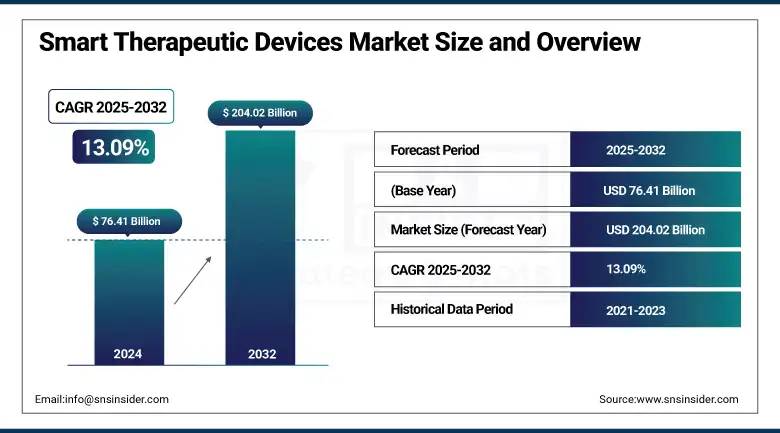
The Smart Therapeutic Devices Market size was valued at USD 76.41 billion in 2024 and is expected to reach USD 204.02 billion by 2032, growing at a CAGR of 13.09% over the forecast period of 2025-2032.
Rapid growth in the global smart therapeutic devices market is attributed to the rising prevalence of chronic disease, increasing awareness about health, and real-time, personalized treatment. The ability to deliver targeted treatment at home has been revolutionized by the advent of smart neurotechnological devices that embed IoT, AI, and wireless technology with current therapeutic devices to maximize efficacy, adherence, and device-free treatments. In addition, the smart therapeutic devices market growth of smart therapeutic devices is attributed to an increase in favorable home healthcare reimbursement policies and a rise in the adoption of remote monitoring.
To Get more information On Smart Therapeutic Devices Market - Request Free Sample Report
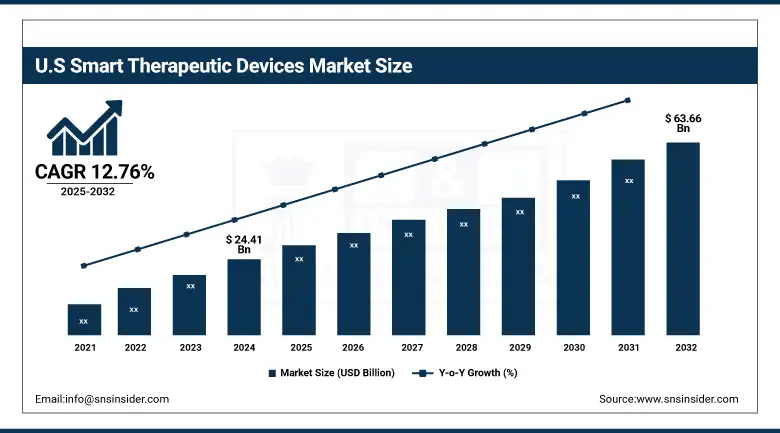
The U.S. smart therapeutic devices market size was valued at USD 24.41 billion in 2024 and is expected to reach USD 63.66 billion by 2032, growing at a CAGR of 12.76% over the forecast period of 2025-2032.
With a well-established healthcare infrastructure, a developed R&D ecosystem, and the presence of a number of leading med-tech players across the country, the U.S. dominated the smart therapeutic device market in North America. Coupled with great investment in healthcare, pro-innovation regulatory policies, and widespread adoption of connected therapeutic technologies through hospitals and home-care settings, this leadership is also augmented by continued investment.
The FDA (Dec 2024) announced new guidelines to accelerate the approval of AI-enabled medical devices by permitting manufacturers to update approved products without the need to submit full regulatory dossiers.
Smart Therapeutic Devices Market Dynamics:
Drivers:
-
Increasing Prevalence of Chronic Diseases is Driving the Market Growth
The global prevalence of chronic diseases, including cardiovascular conditions, diabetes, respiratory diseases, and neurological disorders, is on the rise, leading to increased demand for safe, effective, and efficient management options for prolonged periods.
Non-communicable diseases (NCDs), based on the World Health Organization (WHO) best estimates, contribute to around 74% of all global deaths, with 17.9 million people dying from cardiovascular diseases.
For instance, in the case of diabetes, the numbers are alarming, as the International Diabetes Federation (IDF) estimated that by 2024, more than 540 million people globally will be living with diabetes, and the numbers are staggering in the upcoming years.
Continuous monitoring and disease-specific therapy make smart therapeutic devices, such as insulin pumps, smart drug delivery systems, and neurostimulation devices, essential for optimal patient management. By individualizing therapy, automating dosing, and allowing for real-time monitoring of dosing and response, they may facilitate improvements in disease control while also lessening the burden on healthcare systems.
-
Advancements in Digital Health Technologies are Propelling the Market Growth
Therapeutic care is undergoing important changes due to technological innovation. Smart and connected therapeutic devices, empowered by technologies such as Internet of Things (IoT), Artificial Intelligence (AI), Bluetooth, and cloud computing, support real-time data tracking and remote access to devices. Smart drug delivery systems, for instance, can be programmed to autonomously adjust the quantity of medication released into the bloodstream using real-time physiological feedback, and wearable neurostimulation devices can be programmed with a mobile app to deliver user-specific therapy.
Remote patient monitoring (RPM) has seen increased uptake globally, and the American Medical Association conducted a survey in 2023 that found that over 70% of physicians across the U.S. were using some form of RPM to care for patients.
Moreover, clinical trials have found that sensor-equipped smart inhalers can enhance medication adherence by as much as 58%. Adjuncts to traditional inhalers. Another motivation is the increasing use of telehealth, together with various government policies encouraging the digital health infrastructure, particularly in the older demographics and marginalized areas.
The FDA approved 252 AI algorithms for digital healthcare, and the number of AI/ML-enabled digital health devices rose to approximately 801 in number by mid-2024.
Restraints
-
High Cost and Limited Accessibility of Advanced Devices, Particularly in Low- and Middle-Income Regions, are Restraining the Smart Therapeutic Devices Market Trends
A lot of smart therapeutic devices, from insulin pumps and neurostimulation systems to smart drug delivery platforms, incorporate or are embedded with state-of-the-art technologies, such as IoT, artificial intelligence (AI), and wireless communications. These advancements help with functionality and optimal usage, but they impose a substantially higher price tag on patients and the healthcare industry. In poorly developed healthcare infrastructure or where reimbursement frameworks are weak, affordability will be a significant impediment to adoption.
Smart insulin pumps are a good example, with annual costs running into thousands of dollars, and continuous glucose monitors (CGMs) may incur additional continuous costs, such as those related to sensors and software upgrades. Out-of-pocket expenses still represent a major barrier to adherence to chronic disease management in developed countries, and more so in populations that lack insurance or are underinsured, according to the U.S. CDC. Moreover, the absence of trained professionals to install, calibrate, and maintain these devices, coupled with other aspects, such as data privacy, cybersecurity concerns, and device interoperability, may impede widespread market penetration, especially in rural and resource-constrained settings.
Segmentation Analysis:
By Device Types
The smart therapeutic devices market is led by the smart drug delivery systems segment with a 49.28% market share in 2024, attributed to the rising applications of smart drug delivery systems being integrated into the chronic disease treatment regimens. These systems improve the accuracy of delivering medicines, which subsequently improves patient compliance with treatments and outcomes. This enables real-time tracking of dosage, timing, and physiological response, which can be extremely useful in the clinic and in at-home treatment. This shift toward personalization in drug administration has also contributed to an increase in their adoption rates, while the larger shift towards connected drug delivery platforms has ensured the long-term continued adoption of these devices.
The neurostimulation devices segment is anticipated to register the fastest growth throughout the forecast period. The rapid growth is mainly driven by the increasing number of neurological disorders, including Parkinson's disease, epilepsy, chronic pain, and an increasing preference toward non-pharmacological treatment options. Technological progress is progressing miniaturization, wireless communication, and the consequent linearity of performance-to-comfort payloads. Furthermore, growing research budgets and increasing indications and approvals for new applications are driving fast adoption in both developed and emerging markets.
By Distribution Channel
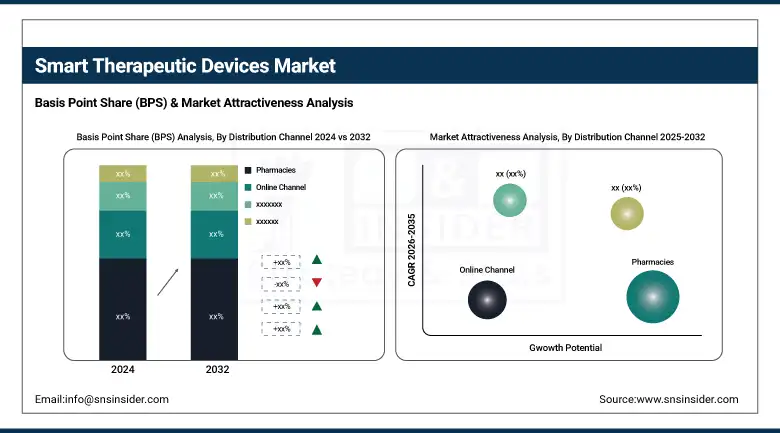
The pharmacies segment dominated the smart therapeutic devices market share with 38.60% in 2024, owing to the availability of these devices on a large scale and the high level of consumer trust in pharmacies as distributors and effective distribution channels. Pharmacies are still an important place where patients buy prescribed smart therapeutic devices, such as insulin pumps, smart inhalers, and drug delivery systems. This gives them a critical edge as the go-to distribution channel as they can provide in-person consultation, support with device use, and integration with insurance and reimbursement services. The dominance is further fueled by the partner developer to the device manufacturers, which are among the most prominent chains of supermarkets found in most countries.
The online channel segment is predicted to have the fastest growth over the forecast years, owing to rising convenience, home delivery, and a wider array of products and services preferred by the consumer. Booming e-commerce platforms, telehealth services, and direct-to-consumer models allow patients to acquire smart therapeutic devices remotely, particularly in countries where digital infrastructures have been growing. In addition to this, the COVID-19 pandemic fast-tracked the adoption of digital change in healthcare, and online platforms are increasingly accepted for medical device purchases. Better user interfaces, safe payment systems, and subscription models are also making online channels more attractive for consumers and providers alike.
By End-Use
The hospitals segment accounted for the largest share of the 2024 market with a 63.18% market share in the smart therapeutic devices market, due to the high number of such advanced treatment procedures and availability of specialists, and integration of advanced therapeutic technologies within hospitals. Hospitals are typically the first point at which chronic and acute conditions are diagnosed and managed, thereby making them early adopters of smart devices, including neurostimulation systems, drug delivery tools, and connected ventilators. Then there are the generous financial resources that hospitals can leverage, their established processes and procedures for getting these types of devices, and their long-standing infrastructure to manage the deployment and monitoring of these types of devices, all driving the hospital to the center of the market even further.
The home care segment is expected to be the fastest-growing end-use category during the forecast period due to the global movement towards decentralized healthcare and patient-centered treatment models. Demand for these smart therapeutic devices is being spurred due to growing preference for managing chronic conditions, diabetic patients, such as at home, including real-time monitoring and automatic dosing, and feedback of information collected to providers. Innovation of user-friendly, portable, app-attached solutions, together with the rising cost of care and an older population, is motivating patients and patient care to seek home-based solutions, which minimize hospitalization and improve the quality of life.
Regional Analysis:
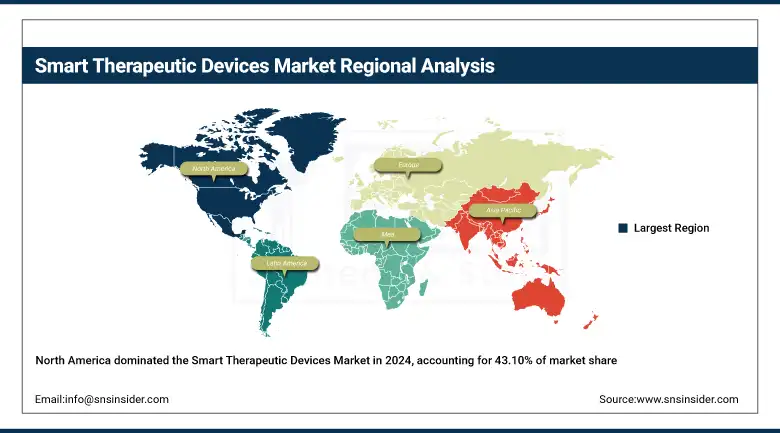
North America dominated the smart therapeutic devices market with a 43.10% market share in 2024, due to the sophisticated healthcare infrastructure it offers, a high presence of prominent medical technology companies, and the rising awareness of chronic diseases being managed from connected solutions across North America. The region offers the advantages of early uptake of digital health technologies, strong investment in research and development, and supportive reimbursement policies for smart devices, such as insulin pumps, neurostimulators, and wearables. In addition, in the U.S. and Canada, the rising burden of lifestyle-related disorders, including diabetes and cardiovascular disease, will continue to bolster demand for these technologies.
Get Customized Report as per Your Business Requirement - Enquiry Now
The smart therapeutic devices market is experiencing the fastest growth in Asia Pacific with a 13.71% CAGR over the forecast period due to the wellness field getting more investment as a better healthcare infrastructure is built on the increasing population and a higher incidence of chronic diseases. Investments in digital health, telemedicine, and mobile health technologies have been flowing into countries such as China, India, and Japan. In addition, the rising penetration of the internet and smartphones, coupled with government efforts to boost remote care access, is expected to propel demand for smart therapeutic devices. Moreover, the expansion of the region's middle class and increased awareness about healthcare are boosting the demand for low-cost and interconnected health solutions.
Europe’s enormous public investment in digital health is likely to contribute to considerable expansion of the smart therapeutic devices market, further bolstered by other healthcare modernization initiatives, such as the EU’s Digital Health and Care Strategy. More of the region's existing healthcare systems and reimbursement programs are beginning to accommodate remote monitoring technologies, such as continuous glucose monitors, smart inhalers, and neurostimulation devices. Moreover, stringent regulations and extensive digital infrastructure promote the integration of connected therapies within chronic disease management protocols, facilitating innovation and adoption across the European landscape.
The global smart therapeutic devices market is growing at a moderate pace in Latin America due to the rising awareness regarding chronic disease management and increasing inclination toward remote healthcare solutions. Various smart devices, such as insulin pumps and remote monitoring tools, are being incorporated into healthcare delivery in countries across the region, particularly in urban settings. The proliferation of supportive public health programs and increasing access to mobile health technologies are also driving the steady expansion of the market.
The MEA region is growing moderately, owing to all the ongoing investments in healthcare infrastructure and digital transformation. Chronic diseases, such as diabetes and cardiovascular disease, are on the rise, which is supporting growth in smart therapeutic devices to be used in clinical settings and also at home, with more and more healthcare systems focusing on patient-centered home care. Since the combination of governmental drives scaling telehealth and remote care, followed by internet penetration increments, the region is slowly embracing advanced therapeutic technologies.
Key Players:
Smart therapeutic devices companies are Abbott Laboratories, Medtronic plc, Koninklijke Philips N.V., Dexcom, Inc., Fitbit (Google), Johnson & Johnson, ResMed Inc., Boston Scientific, Omada Health, Pear Therapeutics, and other players.
Recent Developments:
-
June 2025 –Royal Philips, a global leader in health technology, released the CE marking of its SmartCT image reconstruction solution in June 2025. The solution is intended to support quicker and better-informed decision-making in the treatment of stroke and other neurovascular conditions. SmartCT is now available in Europe after previously being available in Japan and Canada. The innovation will be presented at LINNC Paris 2025 (June 2–4), a leading international congress in interventional neuroradiology.
-
In January 2024, Abbott launched a new chapter in its FreeStyle Libre system with the release of its newest continuous glucose monitoring (CGM) sensor. The product brings added value specifically to the U.S. insulin pump users, solidifying Abbott's leadership role in the diabetes care market.
-
August 2024, Medtronic plc announced FDA clearance for its Simplera continuous glucose monitor (CGM), the company's first all-in-one, disposable CGM. The new device, which is half the size of its predecessors, has a more discreet profile and does away with overtape, making both insertion and wear easier for users.
Smart Therapeutic Devices Market Report Scope:
Report Attributes Details Market Size in 2024 USD 77.12 Billion Market Size by 2032 USD 204.02 Billion CAGR CAGR of 13.09% From 2025 to 2032 Base Year 2024 Forecast Period 2025-2032 Historical Data 2021-2023 Report Scope & Coverage Market Size, Segments Analysis, Competitive Landscape, Regional Analysis, DROC & SWOT Analysis, Forecast Outlook Key Segments • By Device Type (Portable Oxygen Concentrators & Ventilators, Insulin Pumps, Hearing Aids, Neurostimulation Devices, Smart Inhalers, Smart Drug Delivery Systems)
• By Distribution Channel (Pharmacies, Online Channel, Direct-to-Consumer (DTC), Others [Hypermarkets, Specialty Retailers])
• By End Use (Hospitals, Clinics, Home Care, Others [Sports, Fitness Centers, Assisted Living])Regional Analysis/Coverage North America (US, Canada, Mexico), Europe (Germany, France, UK, Italy, Spain, Poland, Turkey, Rest of Europe), Asia Pacific (China, India, Japan, South Korea, Singapore, Australia, Rest of Asia Pacific), Middle East & Africa (UAE, Saudi Arabia, Qatar, South Africa, Rest of Middle East & Africa), Latin America (Brazil, Argentina, Rest of Latin America) Company Profiles Abbott Laboratories, Medtronic plc, Koninklijke Philips N.V., Dexcom, Inc., Fitbit (Google), Johnson & Johnson, ResMed Inc., Boston Scientific, Omada Health, Pear Therapeutics, and other players.
Frequently Asked Questions
Ans: North America dominated the Smart Therapeutic Devices Market in 2024.
Ans: The “Smart Drug Delivery Systems” segment dominated the Smart Therapeutic Devices Market.
Ans: Rising prevalence of chronic diseases is driving the market growth.
Ans: The Smart Therapeutic Devices Market was USD 76.41 billion in 2024 and is expected to reach USD 204.02 billion by 2032.
Ans: The Smart Therapeutic Devices Market is expected to grow at a CAGR of 13.09% from 2025 to 2032.
Get in Touch
