Get More Information on Transparent Plastic Market - Request Sample Report
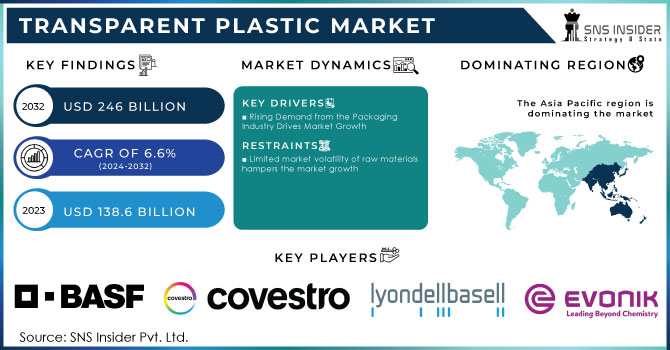
The Transparent Plastic Market Size was valued at USD 138.6 Billion in 2023. It is expected to grow to USD 246 Billion by 2032 and grow at a CAGR of 6.6% over the forecast period of 2024-2032.
Technological advancements in polymer production have led to accelerated growth of the use of transparent plastics not only as packaging materials but also in the automotive and electronic industries. Recent developments in polymer science have seen the manufacture of high-performance polymers that exhibit exceptional optical clarity, impact resistance, and UV stability, making them applicable in even more extreme applications. For instance, PC and PMMA are now used in more electronics including automotive, which increases the consumption and demand for the highly transparent versions.
Chemical recycling is the most breakthrough in this sphere. Unlike mechanical recycling, chemicals break the plastics on the molecular level. As a result, all types of plastic materials can be recycled almost endlessly, without losing their qualities. Moreover, IT made transparent plastics, that used to be less sustainable in terms of recycling, more sustainable and reusable. This advancement can also benefit high-end applications by making them more eco-friendly. For example, Covestro AG provided chemical recycling for the polycarbonate plastics applied in electronics and medical devices in 2021. The quality of these materials is held up, so they can be used again without any compromise.
These innovations benefited from government support through sustainability requirements. For instance, the European Union has initiated the Circular Economy Action Plan which requires EU states to recycle by 2030 more than 55 percent of plastics being put on the market. These efforts should employ advanced recycling technologies, among which categories are chemical. In line with that, California authorities have established a Recycled Content Law requiring plastic beverage containers to contain over 25 percent recycled material by 2025. This requirement pushed companies to adopt innovative recycling methods.
Biodegradable transparent plastics hold one of the significant growth attributed to the rapidly rising demand for sustainable materials in the packaging and agricultural sectors. The latter is especially topical in light of the high consumption rates of single-use plastics. When it comes to ecological analogs, be it have polylactic acid or bio-PET, for example, their property of being transparent and durable is particularly attractive to stakeholders, and the fact that they are biodegradable adds another value. Therefore, the growing popularity of such materials is a consequence of the ongoing trend of sustainable development and the pressing issues of the transitive economy. The adoption of these polymers is facilitated by the already established global commitment to becoming environmentally friendly, and in some regions, the process is fostered by the stringent requirements of environmental protection.
Government regulations are favorable for the demand for biodegradable transparent plastics. A recent example is the European Union’s Single-Use Plastics Directive. This directive requires a ban on single-use plastic items by 2021 and requires that all packaging be made from either recyclable or compostable materials by 2030. In the United States, there is an example of the state of California’s Plastic Pollution Prevention and Packaging Producer Responsibility Act. This act requires that packaging manufacturers increase the recycled and biodegradable content of their products to 75% by 2032. Mainly government initiatives drive the successful demand for biodegradable transparent plastics, and their presence creates a favorable environment for their growth.
Drivers
Rising Demand from the Packaging Industry Drives Market Growth
The packaging industry is expected to be a key source of growth for the transparent plastics market, with around 40% of overall market consumption by 2032. This usage spike is largely fuelled by the general trend toward clear and sturdy materials, especially polyethylene terephthalate. Various reports by the U.S. Plastics Industry Association attribute the surge in demand for PET to bring due to an increase in e-commerce and retail packaging formed to keep goods safe and lightweight. Leading companies have also been adopting and implementing new environment-friendly package design concepts, including the usage of recycled PET. The U.S. Environmental Protection Agency has collected comprehensive recycling data, confirming a positive trend, particularly recycling rate advances in PET bottles. Overall, these trends suggest that the packaging industry will continue to increase its consumption of transparent plastics. The leading forces behind these trends are a shift in the market toward convenience and environmental responsibility.
Restraint
Limited market volatility of raw materials hampers the market growth
The limited market volatility of raw materials can significantly hinder growth in the market of transparent plastics. When the costs of the most important raw materials, such as petroleum or natural gas, are low and remain predictable, manufacturers might perceive little incentive to improve their production by implementing new solutions or becoming more efficient. As a result, there will be limited investment in new technologies, innovation, or sustainability, as manufacturers will prioritize keeping their production rates at the same level.
By Type
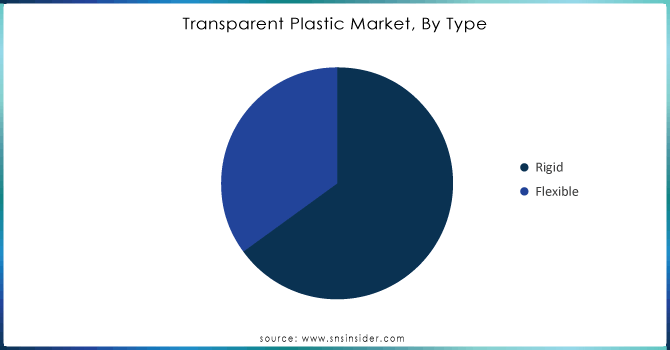
The rigid segment held the largest market share around 62% in 2023. Such applications as eyewear lenses provide users with a transparent experience and proper protection due to their high durability. Abstract transparent packaging allows customers to see the product, and rigid material is the best barrier to the environment. Such materials will also always be used in the automotive industry, in the form of windows and headlights on cars. Finally, these materials will play a huge role in sterile medical instruments, which must be transparent.
It can be strongly suggested that a flexible segment will grow much faster due to a larger number of available applications. They are used as expanded glass materials for electronic displays, flexible glass packing, and the arms of the eyewear, which should be easily replaced, leave packaging behind, and develop modern flexible cells with their help. They will also be used as a thin protective cover that does not weigh or standardize the car.
Need any customization research on Transparent Plastic Market - Enquiry Now
By Polymer
The Polyethylene Terephthalate segment held the largest market share in 2023. The PET polymer is used extensively in the production of transparent plastics and is the preferred material in the majority of end-use applications. It is primarily utilized for packaging because it allows the production of durable bottles & containers, for food & non-food products. The excellent barrier characteristics of PET are vital for preserving the color, aroma, taste, consistency, and vitamin and nutritive properties of the packaged contents. It is also preferred for this application because the material does not react with food or beverages stored. PET is also used to produce transparent sheets for thermoforming applications, which are subsequently transformed into different types of packaging. The design versatility and utility make PET the preferable material in a wide range of products.
By Application
The packaging segment held the largest share around 38% in 2023. The packaging segment is the most significant in the transparent plastics application segment. One of the key reasons is that packaging is used across all industries. For example, packages are in demand in the production of food and beverages, and non-food consumer goods such as cosmetics and clothing, pharmaceuticals, and other industries. Another reason for the significant size of this segment is that there has been a growing trend for the consumer segments in all industries. As well as the need for packaging, however, desirable clear plastic, as it provides good transparency, is resistant to mechanical stress, and is lightweight. With the development of e-commerce, the issue of proper packaging has become more important than ever. To maximally reduce the risk of product damage, the packaging product should be as clear as possible, so the proportion of transparent plastic packaging is also growing due to this trend. The sustainability trend can also affect this segment, as with time manufacturers can switch to recycled materials and encourage this trend by using eco-friendly or green packaging solutions.
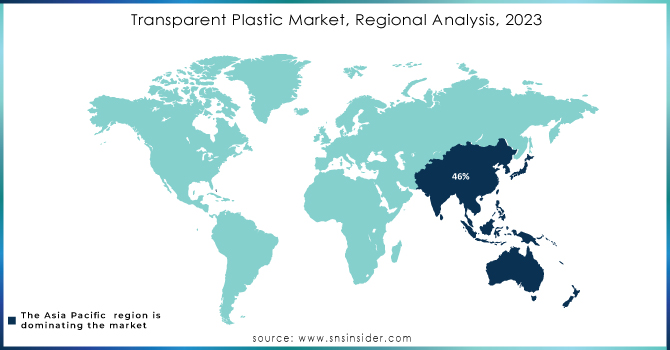
Asia Pacific held the largest share around 46% in 2023. The Asia-Pacific region is the most rapidly growing market for transparent plastics. The mounting industrialization and urbanization of the region, as well as the emerging middle class, are major factors driving the region’s market. The largest manufacturers and consumers in the region are India, China, and Japan, the former of which is the largest manufacturer and consumer worldwide. According to the National Bureau of Statistics of China, in 2022 the country created more than 77 million metric tons of plastic products. Packaging uses consume most of the plastics. In India, the launch of government projects aimed at enhancing the recycling industry and fostering sustainable materials is boosting regional growth.
North America is anticipated to register the fastest region over the forecast period. The United States significantly contributes to these statistics. The U.S. Department of Commerce claims that this industry has contributed around USD 37 billion to the economy. Advanced technologies, a well-developed packaging industry, and a constantly increasing demand for innovative and sustainable packaging are the key drivers. Moreover, government-oriented businesses will improve recycling options and develop the market for recycled transparent plastic.
BASF SE (Ultrason E Transparent)
SABIC (LEXAN Polycarbonate Resin)
Covestro AG (Makrolon Polycarbonate)
LyondellBasell Industries (Hostalen PP Transparent)
Eastman Chemical Company (Eastman Tritan Copolyester)
Evonik Industries AG (PLEXIGLAS)
Arkema S.A. (Altuglas Acrylic)
Dow Inc. (DOWLEX Polyethylene Resins)
Mitsubishi Chemical Corporation (DIAMIRON Transparent Resin)
Teijin Limited (Panlite Polycarbonate Resin)
Asahi Kasei Corporation (XYRON Transparent Grades)
Chi Mei Corporation (Acrylonitrile Styrene Acrylate (ASA) Transparent Grade)
LG Chem (Transparent ABS Resin)
DuPont de Nemours, Inc. (Surlyn Transparent Resin)
SABIC Innovative Plastics (VALOX Transparent Resin)
Plaskolite LLC (OPTIX Acrylic Sheet)
3M Company (3M Fluorinated Ethylene Propylene Film)
Trinseo S.A. (CALIBRE Polycarbonate Resin)
Sumitomo Chemical Co., Ltd. (SUMIPEX PMMA)
Toray Industries, Inc. (Amilan Transparent Nylon)
In 2023, Eastman Chemical Company has expanded of its Eastman Tritan™ copolyester production capacity to meet the increasing demand for durable and transparent plastics in the food and beverage packaging sector.
In 2023, BASF launched a new line of sustainable transparent plastic solutions, incorporating up to 30% recycled content in its PET products. This new launched helped the company’s commitment to sustainability and reducing carbon emissions.
In 2022, Dow Chemical Company has launched a new portfolio of transparent and sustainable materials for packaging applications, focusing on circular economy principles. This included innovations in recyclable flexible films aimed at reducing plastic waste.
Report Attributes | Details |
---|---|
Market Size in 2023 | US$ 138.6 billion |
Market Size by 2032 | US$ 246 Billion |
CAGR | CAGR of 6.6 % From 2024 to 2032 |
Base Year | 2023 |
Forecast Period | 2024-2032 |
Historical Data | 2020-2022 |
Report Scope & Coverage | Market Size, Segments Analysis, Competitive Landscape, Regional Analysis, DROC & SWOT Analysis, Forecast Outlook |
Key Segments | • By Type (Rigid, Flexible) • By Polymer (Polyethylene Terephthalate (PET), Polypropylene (PP), Polystyrene (PS), Polyvinyl Chloride (PVC), Polycarbonate (PC), Polymethyl Methacrylate (PMMA) and Others) • By Application (Packaging, Electrical & Electronics, Consumer Goods, Consumer Goods, Building & Construction, Automotive, Healthcare, Others) |
Regional Analysis/Coverage | North America (US, Canada, Mexico), Europe (Eastern Europe [Poland, Romania, Hungary, Turkey, Rest of Eastern Europe] Western Europe [Germany, France, UK, Italy, Spain, Netherlands, Switzerland, Austria, Rest of Western Europe]), Asia Pacific (China, India, Japan, South Korea, Vietnam, Singapore, Australia, Rest of Asia Pacific), Middle East & Africa (Middle East [UAE, Egypt, Saudi Arabia, Qatar, Rest of Middle East], Africa [Nigeria, South Africa, Rest of Africa], Latin America (Brazil, Argentina, Colombia, Rest of Latin America) |
Company Profiles | BASF SE, SABIC., Covestro AG, LyondellBasell Industries Inc., Eastman Chemical Company, Evonik Industries AG y, Arkema S.A., Dow Inc., Mitsubishi Chemical Corporation, Teijin Limited Asahi Kasei Corporation and others. |
Key Drivers | • Rising Demand from the Packaging Industry Drives the Market Growth. |
RESTRAINTS | • Limited market volatility of raw materials hampers the market growth |
Ans: The Transparent Plastic Market was valued at USD 138.6 billion in 2023.
Ans: The expected CAGR of the global Transparent Plastic Market during the forecast period is 6.6%.
Ans: The Packaging segment grow rapidly in the Transparent Plastic Market from 2024-2032.
Ans: Innovative Packaging Solutions will be the growth of the Transparent Plastic Market.
Ans: The U.S. led the Transparent Plastic Market in the North America region with the highest revenue share in 2023.
1. Introduction
1.1 Market Definition
1.2 Scope (Inclusion and Exclusions)
1.3 Research Assumptions
2. Executive Summary
2.1 Market Overview
2.2 Regional Synopsis
2.3 Competitive Summary
3. Research Methodology
3.1 Top-Down Approach
3.2 Bottom-up Approach
3.3. Data Validation
3.4 Primary Interviews
4. Market Dynamics Impact Analysis
4.1 Market Driving Factors Analysis
4.1.1 Drivers
4.1.2 Restraints
4.1.3 Opportunities
4.1.4 Challenges
4.2 PESTLE Analysis
4.3 Porter’s Five Forces Model
5. Statistical Insights and Trends Reporting
5.1 Production Capacity and Utilization, by Country, by Type, 2023
5.2 Feedstock Prices, by Country, by Type, 2023
5.3 Regulatory Impact, by l Country, by Type, 2023.
5.4 Environmental Metrics: Emissions Data, Waste Management Practices, and Sustainability Initiatives, by Region
5.5 Innovation and R&D, by Type, 2023
6. Competitive Landscape
6.1 List of Major Companies, By Region
6.2 Market Share Analysis, By Region
6.3 Product Benchmarking
6.3.1 Product specifications and features
6.3.2 Pricing
6.4 Strategic Initiatives
6.4.1 Marketing and promotional activities
6.4.2 Distribution and supply chain strategies
6.4.3 Expansion plans and new product launches
6.4.4 Strategic partnerships and collaborations
6.5 Technological Advancements
6.6 Market Positioning and Branding
7. Transparent Plastic Market Segmentation, by Type
7.1 Chapter Overview
7.2 Rigid
7.2.1 Rigid Market Trends Analysis (2020-2032)
7.2.2 Rigid Market Size Estimates and Forecasts to 2032 (USD Billion)
7.3 Flexible
7.3.1 Flexible Market Trends Analysis (2020-2032)
7.3. Flexible Market Size Estimates and Forecasts to 2032 (USD Billion)
8. Transparent Plastic Market Segmentation, by Polymer
8.1 Chapter Overview
8.2 Polyethylene Terephthalate (PET)
8.2.1 Polyethylene Terephthalate (PET) Market Trends Analysis (2020-2032)
8.2.2 Polyethylene Terephthalate (PET) Market Size Estimates and Forecasts to 2032 (USD Billion)
8.3 Polypropylene (PP)
8.3.1 Polypropylene (PP) Market Trends Analysis (2020-2032)
8.3.2 Polypropylene (PP) Market Size Estimates and Forecasts to 2032 (USD Billion)
8.4 Polystyrene (PS)
8.4.1 Polystyrene (PS) Market Trends Analysis (2020-2032)
8.4.2 Polystyrene (PS) Market Size Estimates and Forecasts to 2032 (USD Billion)
8.5 Polyvinyl Chloride (PVC)
8.5.1 Polyvinyl Chloride (PVC) Market Trends Analysis (2020-2032)
8.5.2 Polyvinyl Chloride (PVC) Market Size Estimates and Forecasts to 2032 (USD Billion)
8.6 Polycarbonate (PC)
8.6.1 Polycarbonate (PC) Market Trends Analysis (2020-2032)
8.7 Polymethyl Methacrylate (PMMA)
8.7.1 Polymethyl Methacrylate (PMMA)Market Trends Analysis (2020-2032)
8.7.2 Polymethyl Methacrylate (PMMA) Market Size Estimates and Forecasts to 2032 (USD Billion)
8.8 Others
8.8.1 Others Market Trends Analysis (2020-2032)
8.8.2 Others Market Size Estimates and Forecasts to 2032 (USD Billion)
9. Transparent Plastic Market Segmentation, by Application
9.1 Chapter Overview
9.2 Packaging
9.2.1 Packaging Market Trends Analysis (2020-2032)
9.2.2 Packaging Market Size Estimates and Forecasts to 2032 (USD Billion)
9.3 Electrical & Electronics
9.3.1 Electrical & Electronics Market Trends Analysis (2020-2032)
9.3.2 Electrical & Electronics Market Size Estimates and Forecasts to 2032 (USD Billion)
9.4 Consumer Goods
9.4.1 Consumer Goods Market Trends Analysis (2020-2032)
9.4.2 Consumer Goods Market Size Estimates and Forecasts to 2032 (USD Billion)
9.5 Building & Construction
9.5.1 Building & Construction Market Trends Analysis (2020-2032)
9.5.2 Building & Construction Market Size Estimates and Forecasts to 2032 (USD Billion)
9.6 Automotive
9.6.1 Automotive Market Trends Analysis (2020-2032)
9.6.2 Automotive Market Size Estimates and Forecasts to 2032 (USD Billion)
9.7 Healthcare
9.7.1 Healthcare Market Trends Analysis (2020-2032)
9.7.2 Healthcare Market Size Estimates and Forecasts to 2032 (USD Billion)
9.8 Others
9.8.1 Others Market Trends Analysis (2020-2032)
9.8.2 Others Market Size Estimates and Forecasts to 2032 (USD Billion)
10. Regional Analysis
10.1 Chapter Overview
10.2 North America
10.2.1 Trends Analysis
10.2.2 North America Transparent Plastic Market Estimates and Forecasts, by Country (2020-2032) (USD Billion)
10.2.3 North America Transparent Plastic Market Estimates and Forecasts, by Type (2020-2032) (USD Billion)
10.2.4 North America Transparent Plastic Market Estimates and Forecasts, by Polymer (2020-2032) (USD Billion)
10.2.5 North America Transparent Plastic Market Estimates and Forecasts, by Application (2020-2032) (USD Billion)
10.2.6 USA
10.2.6.1 USA Transparent Plastic Market Estimates and Forecasts, by Type (2020-2032) (USD Billion)
10.2.6.2 USA Transparent Plastic Market Estimates and Forecasts, by Polymer (2020-2032) (USD Billion)
10.2.6.3 USA Transparent Plastic Market Estimates and Forecasts, by Application (2020-2032) (USD Billion)
10.2.7 Canada
10.2.7.1 Canada Transparent Plastic Market Estimates and Forecasts, by Type (2020-2032) (USD Billion)
10.2.7.2 Canada Transparent Plastic Market Estimates and Forecasts, by Polymer (2020-2032) (USD Billion)
10.2.7.3 Canada Transparent Plastic Market Estimates and Forecasts, by Application (2020-2032) (USD Billion)
10.2.8 Mexico
10.2.8.1 Mexico Transparent Plastic Market Estimates and Forecasts, by Type (2020-2032) (USD Billion)
10.2.8.2 Mexico Transparent Plastic Market Estimates and Forecasts, by Polymer (2020-2032) (USD Billion)
10.2.8.3 Mexico Transparent Plastic Market Estimates and Forecasts, by Application (2020-2032) (USD Billion)
10.3 Europe
10.3.1 Eastern Europe
10.3.1.1 Trends Analysis
10.3.1.2 Eastern Europe Transparent Plastic Market Estimates and Forecasts, by Country (2020-2032) (USD Billion)
10.3.1.3 Eastern Europe Transparent Plastic Market Estimates and Forecasts, by Type (2020-2032) (USD Billion)
10.3.1.4 Eastern Europe Transparent Plastic Market Estimates and Forecasts, by Polymer (2020-2032) (USD Billion)
10.3.1.5 Eastern Europe Transparent Plastic Market Estimates and Forecasts, by Application (2020-2032) (USD Billion)
10.3.1.6 Poland
10.3.1.6.1 Poland Transparent Plastic Market Estimates and Forecasts, by Type (2020-2032) (USD Billion)
10.3.1.6.2 Poland Transparent Plastic Market Estimates and Forecasts, by Polymer (2020-2032) (USD Billion)
10.3.1.6.3 Poland Transparent Plastic Market Estimates and Forecasts, by Application (2020-2032) (USD Billion)
10.3.1.7 Romania
10.3.1.7.1 Romania Transparent Plastic Market Estimates and Forecasts, by Type (2020-2032) (USD Billion)
10.3.1.7.2 Romania Transparent Plastic Market Estimates and Forecasts, by Polymer (2020-2032) (USD Billion)
10.3.1.7.3 Romania Transparent Plastic Market Estimates and Forecasts, by Application (2020-2032) (USD Billion)
10.3.1.8 Hungary
10.3.1.8.1 Hungary Transparent Plastic Market Estimates and Forecasts, by Type (2020-2032) (USD Billion)
10.3.1.8.2 Hungary Transparent Plastic Market Estimates and Forecasts, by Polymer (2020-2032) (USD Billion)
10.3.1.8.3 Hungary Transparent Plastic Market Estimates and Forecasts, by Application (2020-2032) (USD Billion)
10.3.1.9 Turkey
10.3.1.9.1 Turkey Transparent Plastic Market Estimates and Forecasts, by Type (2020-2032) (USD Billion)
10.3.1.9.2 Turkey Transparent Plastic Market Estimates and Forecasts, by Polymer (2020-2032) (USD Billion)
10.3.1.9.3 Turkey Transparent Plastic Market Estimates and Forecasts, by Application (2020-2032) (USD Billion)
10.3.1.10 Rest of Eastern Europe
10.3.1.10.1 Rest of Eastern Europe Transparent Plastic Market Estimates and Forecasts, by Type (2020-2032) (USD Billion)
10.3.1.10.2 Rest of Eastern Europe Transparent Plastic Market Estimates and Forecasts, by Polymer (2020-2032) (USD Billion)
10.3.1.10.3 Rest of Eastern Europe Transparent Plastic Market Estimates and Forecasts, by Application (2020-2032) (USD Billion)
10.3.2 Western Europe
10.3.2.1 Trends Analysis
10.3.2.2 Western Europe Transparent Plastic Market Estimates and Forecasts, by Country (2020-2032) (USD Billion)
10.3.2.3 Western Europe Transparent Plastic Market Estimates and Forecasts, by Type (2020-2032) (USD Billion)
10.3.2.4 Western Europe Transparent Plastic Market Estimates and Forecasts, by Polymer (2020-2032) (USD Billion)
10.3.2.5 Western Europe Transparent Plastic Market Estimates and Forecasts, by Application (2020-2032) (USD Billion)
10.3.2.6 Germany
10.3.2.6.1 Germany Transparent Plastic Market Estimates and Forecasts, by Type (2020-2032) (USD Billion)
10.3.2.6.2 Germany Transparent Plastic Market Estimates and Forecasts, by Polymer (2020-2032) (USD Billion)
10.3.2.6.3 Germany Transparent Plastic Market Estimates and Forecasts, by Application (2020-2032) (USD Billion)
10.3.2.7 France
10.3.2.7.1 France Transparent Plastic Market Estimates and Forecasts, by Type (2020-2032) (USD Billion)
10.3.2.7.2 France Transparent Plastic Market Estimates and Forecasts, by Polymer (2020-2032) (USD Billion)
10.3.2.7.3 France Transparent Plastic Market Estimates and Forecasts, by Application (2020-2032) (USD Billion)
10.3.2.8 UK
10.3.2.8.1 UK Transparent Plastic Market Estimates and Forecasts, by Type (2020-2032) (USD Billion)
10.3.2.8.2 UK Transparent Plastic Market Estimates and Forecasts, by Polymer (2020-2032) (USD Billion)
10.3.2.8.3 UK Transparent Plastic Market Estimates and Forecasts, by Application (2020-2032) (USD Billion)
10.3.2.9 Italy
10.3.2.9.1 Italy Transparent Plastic Market Estimates and Forecasts, by Type (2020-2032) (USD Billion)
10.3.2.9.2 Italy Transparent Plastic Market Estimates and Forecasts, by Polymer (2020-2032) (USD Billion)
10.3.2.9.3 Italy Transparent Plastic Market Estimates and Forecasts, by Application (2020-2032) (USD Billion)
10.3.2.10 Spain
10.3.2.10.1 Spain Transparent Plastic Market Estimates and Forecasts, by Type (2020-2032) (USD Billion)
10.3.2.10.2 Spain Transparent Plastic Market Estimates and Forecasts, by Polymer (2020-2032) (USD Billion)
10.3.2.10.3 Spain Transparent Plastic Market Estimates and Forecasts, by Application (2020-2032) (USD Billion)
10.3.2.11 Netherlands
10.3.2.11.1 Netherlands Transparent Plastic Market Estimates and Forecasts, by Type (2020-2032) (USD Billion)
10.3.2.11.2 Netherlands Transparent Plastic Market Estimates and Forecasts, by Polymer (2020-2032) (USD Billion)
10.3.2.11.3 Netherlands Transparent Plastic Market Estimates and Forecasts, by Application (2020-2032) (USD Billion)
10.3.2.12 Switzerland
10.3.2.12.1 Switzerland Transparent Plastic Market Estimates and Forecasts, by Type (2020-2032) (USD Billion)
10.3.2.12.2 Switzerland Transparent Plastic Market Estimates and Forecasts, by Polymer (2020-2032) (USD Billion)
10.3.2.12.3 Switzerland Transparent Plastic Market Estimates and Forecasts, by Application (2020-2032) (USD Billion)
10.3.2.13 Austria
10.3.2.13.1 Austria Transparent Plastic Market Estimates and Forecasts, by Type (2020-2032) (USD Billion)
10.3.2.13.2 Austria Transparent Plastic Market Estimates and Forecasts, by Polymer (2020-2032) (USD Billion)
10.3.2.13.3 Austria Transparent Plastic Market Estimates and Forecasts, by Application (2020-2032) (USD Billion)
10.3.2.14 Rest of Western Europe
10.3.2.14.1 Rest of Western Europe Transparent Plastic Market Estimates and Forecasts, by Type (2020-2032) (USD Billion)
10.3.2.14.2 Rest of Western Europe Transparent Plastic Market Estimates and Forecasts, by Polymer (2020-2032) (USD Billion)
10.3.2.14.3 Rest of Western Europe Transparent Plastic Market Estimates and Forecasts, by Application (2020-2032) (USD Billion)
10.4 Asia Pacific
10.4.1 Trends Analysis
10.4.2 Asia Pacific Transparent Plastic Market Estimates and Forecasts, by Country (2020-2032) (USD Billion)
10.4.3 Asia Pacific Transparent Plastic Market Estimates and Forecasts, by Type (2020-2032) (USD Billion)
10.4.4 Asia Pacific Transparent Plastic Market Estimates and Forecasts, by Polymer (2020-2032) (USD Billion)
10.4.5 Asia Pacific Transparent Plastic Market Estimates and Forecasts, by Application (2020-2032) (USD Billion)
10.4.6 China
10.4.6.1 China Transparent Plastic Market Estimates and Forecasts, by Type (2020-2032) (USD Billion)
10.4.6.2 China Transparent Plastic Market Estimates and Forecasts, by Polymer (2020-2032) (USD Billion)
10.4.6.3 China Transparent Plastic Market Estimates and Forecasts, by Application (2020-2032) (USD Billion)
10.4.7 India
10.4.7.1 India Transparent Plastic Market Estimates and Forecasts, by Type (2020-2032) (USD Billion)
10.4.7.2 India Transparent Plastic Market Estimates and Forecasts, by Polymer (2020-2032) (USD Billion)
10.4.7.3 India Transparent Plastic Market Estimates and Forecasts, by Application (2020-2032) (USD Billion)
10.4.8 Japan
10.4.8.1 Japan Transparent Plastic Market Estimates and Forecasts, by Type (2020-2032) (USD Billion)
10.4.8.2 Japan Transparent Plastic Market Estimates and Forecasts, by Polymer (2020-2032) (USD Billion)
10.4.8.3 Japan Transparent Plastic Market Estimates and Forecasts, by Application (2020-2032) (USD Billion)
10.4.9 South Korea
10.4.9.1 South Korea Transparent Plastic Market Estimates and Forecasts, by Type (2020-2032) (USD Billion)
10.4.9.2 South Korea Transparent Plastic Market Estimates and Forecasts, by Polymer (2020-2032) (USD Billion)
10.4.9.3 South Korea Transparent Plastic Market Estimates and Forecasts, by Application (2020-2032) (USD Billion)
10.4.10 Vietnam
10.4.10.1 Vietnam Transparent Plastic Market Estimates and Forecasts, by Type (2020-2032) (USD Billion)
10.4.10.2 Vietnam Transparent Plastic Market Estimates and Forecasts, by Polymer (2020-2032) (USD Billion)
10.4.10.3 Vietnam Transparent Plastic Market Estimates and Forecasts, by Application (2020-2032) (USD Billion)
10.4.11 Singapore
10.4.11.1 Singapore Transparent Plastic Market Estimates and Forecasts, by Type (2020-2032) (USD Billion)
10.4.11.2 Singapore Transparent Plastic Market Estimates and Forecasts, by Polymer (2020-2032) (USD Billion)
10.4.11.3 Singapore Transparent Plastic Market Estimates and Forecasts, by Application (2020-2032) (USD Billion)
10.4.12 Australia
10.4.12.1 Australia Transparent Plastic Market Estimates and Forecasts, by Type (2020-2032) (USD Billion)
10.4.12.2 Australia Transparent Plastic Market Estimates and Forecasts, by Polymer (2020-2032) (USD Billion)
10.4.12.3 Australia Transparent Plastic Market Estimates and Forecasts, by Application (2020-2032) (USD Billion)
10.4.13 Rest of Asia Pacific
10.4.13.1 Rest of Asia Pacific Transparent Plastic Market Estimates and Forecasts, by Type (2020-2032) (USD Billion)
10.4.13.2 Rest of Asia Pacific Transparent Plastic Market Estimates and Forecasts, by Polymer (2020-2032) (USD Billion)
10.4.13.3 Rest of Asia Pacific Transparent Plastic Market Estimates and Forecasts, by Application (2020-2032) (USD Billion)
10.5 Middle East and Africa
10.5.1 Middle East
10.5.1.1 Trends Analysis
10.5.1.2 Middle East Transparent Plastic Market Estimates and Forecasts, by Country (2020-2032) (USD Billion)
10.5.1.3 Middle East Transparent Plastic Market Estimates and Forecasts, by Type (2020-2032) (USD Billion)
10.5.1.4 Middle East Transparent Plastic Market Estimates and Forecasts, by Polymer (2020-2032) (USD Billion)
10.5.1.5 Middle East Transparent Plastic Market Estimates and Forecasts, by Application (2020-2032) (USD Billion)
10.5.1.6 UAE
10.5.1.6.1 UAE Transparent Plastic Market Estimates and Forecasts, by Type (2020-2032) (USD Billion)
10.5.1.6.2 UAE Transparent Plastic Market Estimates and Forecasts, by Polymer (2020-2032) (USD Billion)
10.5.1.6.3 UAE Transparent Plastic Market Estimates and Forecasts, by Application (2020-2032) (USD Billion)
10.5.1.7 Egypt
10.5.1.7.1 Egypt Transparent Plastic Market Estimates and Forecasts, by Type (2020-2032) (USD Billion)
10.5.1.7.2 Egypt Transparent Plastic Market Estimates and Forecasts, by Polymer (2020-2032) (USD Billion)
10.5.1.7.3 Egypt Transparent Plastic Market Estimates and Forecasts, by Application (2020-2032) (USD Billion)
10.5.1.8 Saudi Arabia
10.5.1.8.1 Saudi Arabia Transparent Plastic Market Estimates and Forecasts, by Type (2020-2032) (USD Billion)
10.5.1.8.2 Saudi Arabia Transparent Plastic Market Estimates and Forecasts, by Polymer (2020-2032) (USD Billion)
10.5.1.8.3 Saudi Arabia Transparent Plastic Market Estimates and Forecasts, by Application (2020-2032) (USD Billion)
10.5.1.9 Qatar
10.5.1.9.1 Qatar Transparent Plastic Market Estimates and Forecasts, by Type (2020-2032) (USD Billion)
10.5.1.9.2 Qatar Transparent Plastic Market Estimates and Forecasts, by Polymer (2020-2032) (USD Billion)
10.5.1.9.3 Qatar Transparent Plastic Market Estimates and Forecasts, by Application (2020-2032) (USD Billion)
10.5.1.10 Rest of Middle East
10.5.1.10.1 Rest of Middle East Transparent Plastic Market Estimates and Forecasts, by Type (2020-2032) (USD Billion)
10.5.1.10.2 Rest of Middle East Transparent Plastic Market Estimates and Forecasts, by Polymer (2020-2032) (USD Billion)
10.5.1.10.3 Rest of Middle East Transparent Plastic Market Estimates and Forecasts, by Application (2020-2032) (USD Billion)
10.5.2 Africa
10.5.2.1 Trends Analysis
10.5.2.2 Africa Transparent Plastic Market Estimates and Forecasts, by Country (2020-2032) (USD Billion)
10.5.2.3 Africa Transparent Plastic Market Estimates and Forecasts, by Type (2020-2032) (USD Billion)
10.5.2.4 Africa Transparent Plastic Market Estimates and Forecasts, by Polymer (2020-2032) (USD Billion)
10.5.2.5 Africa Transparent Plastic Market Estimates and Forecasts, by Application (2020-2032) (USD Billion)
10.5.2.6 South Africa
10.5.2.6.1 South Africa Transparent Plastic Market Estimates and Forecasts, by Type (2020-2032) (USD Billion)
10.5.2.6.2 South Africa Transparent Plastic Market Estimates and Forecasts, by Polymer (2020-2032) (USD Billion)
10.5.2.6.3 South Africa Transparent Plastic Market Estimates and Forecasts, by Application (2020-2032) (USD Billion)
10.5.2.7 Nigeria
10.5.2.7.1 Nigeria Transparent Plastic Market Estimates and Forecasts, by Type (2020-2032) (USD Billion)
10.5.2.7.2 Nigeria Transparent Plastic Market Estimates and Forecasts, by Polymer (2020-2032) (USD Billion)
10.5.2.7.3 Nigeria Transparent Plastic Market Estimates and Forecasts, by Application (2020-2032) (USD Billion)
10.5.2.8 Rest of Africa
10.5.2.8.1 Rest of Africa Transparent Plastic Market Estimates and Forecasts, by Type (2020-2032) (USD Billion)
10.5.2.8.2 Rest of Africa Transparent Plastic Market Estimates and Forecasts, by Polymer (2020-2032) (USD Billion)
10.5.2.8.3 Rest of Africa Transparent Plastic Market Estimates and Forecasts, by Application (2020-2032) (USD Billion)
10.6 Latin America
10.6.1 Trends Analysis
10.6.2 Latin America Transparent Plastic Market Estimates and Forecasts, by Country (2020-2032) (USD Billion)
10.6.3 Latin America Transparent Plastic Market Estimates and Forecasts, by Type (2020-2032) (USD Billion)
10.6.4 Latin America Transparent Plastic Market Estimates and Forecasts, by Polymer (2020-2032) (USD Billion)
10.6.5 Latin America Transparent Plastic Market Estimates and Forecasts, by Application (2020-2032) (USD Billion)
10.6.6 Brazil
10.6.6.1 Brazil Transparent Plastic Market Estimates and Forecasts, by Type (2020-2032) (USD Billion)
10.6.6.2 Brazil Transparent Plastic Market Estimates and Forecasts, by Polymer (2020-2032) (USD Billion)
10.6.6.3 Brazil Transparent Plastic Market Estimates and Forecasts, by Application (2020-2032) (USD Billion)
10.6.7 Argentina
10.6.7.1 Argentina Transparent Plastic Market Estimates and Forecasts, by Type (2020-2032) (USD Billion)
10.6.7.2 Argentina Transparent Plastic Market Estimates and Forecasts, by Polymer (2020-2032) (USD Billion)
10.6.7.3 Argentina Transparent Plastic Market Estimates and Forecasts, by Application (2020-2032) (USD Billion)
10.6.8 Colombia
10.6.8.1 Colombia Transparent Plastic Market Estimates and Forecasts, by Type (2020-2032) (USD Billion)
10.6.8.2 Colombia Transparent Plastic Market Estimates and Forecasts, by Polymer (2020-2032) (USD Billion)
10.6.8.3 Colombia Transparent Plastic Market Estimates and Forecasts, by Application (2020-2032) (USD Billion)
10.6.9 Rest of Latin America
10.6.9.1 Rest of Latin America Transparent Plastic Market Estimates and Forecasts, by Type (2020-2032) (USD Billion)
10.6.9.2 Rest of Latin America Transparent Plastic Market Estimates and Forecasts, by Polymer (2020-2032) (USD Billion)
10.6.9.3 Rest of Latin America Transparent Plastic Market Estimates and Forecasts, by Application (2020-2032) (USD Billion)
11. Company Profiles
11.1 BASF SE
11.1.1 Company Overview
11.1.2 Financial
11.1.3 Products/ Services Offered
11.1.4 SWOT Analysis
11.2 SABIC
11.2.1 Company Overview
11.2.2 Financial
11.2.3 Products/ Services Offered
11.2.4 SWOT Analysis
11.3 Covestro AG
11.3.1 Company Overview
11.3.2 Financial
11.3.3 Products/ Services Offered
11.3.4 SWOT Analysis
11.4 LyondellBasell Industries
11.4.1 Company Overview
11.4.2 Financial
11.4.3 Products/ Services Offered
11.4.4 SWOT Analysis
11.5 Evonik Industries AG
11.5.1 Company Overview
11.5.2 Financial
11.5.3 Products/ Services Offered
11.5.4 SWOT Analysis
11.6 Arkema S.A.
11.6.1 Company Overview
11.6.2 Financial
11.6.3 Products/ Services Offered
11.6.4 SWOT Analysis
11.7 Dow Inc.
11.7.1 Company Overview
11.7.2 Financial
11.7.3 Products/ Services Offered
11.7.4 SWOT Analysis
11.8 Mitsubishi Chemical Corporation
11.8.1 Company Overview
11.8.2 Financial
11.8.3 Products/ Services Offered
11.8.4 SWOT Analysis
11.9 Teijin Limited
11.9.1 Company Overview
11.9.2 Financial
11.9.3 Products/ Services Offered
11.9.4 SWOT Analysis
11.10 Asahi Kasei Corporation
11.10.1 Company Overview
11.10.2 Financial
11.10.3 Products/ Services Offered
11.10.4 SWOT Analysis
12. Use Cases and Best Practices
13. Conclusio
An accurate research report requires proper strategizing as well as implementation. There are multiple factors involved in the completion of good and accurate research report and selecting the best methodology to compete the research is the toughest part. Since the research reports we provide play a crucial role in any company’s decision-making process, therefore we at SNS Insider always believe that we should choose the best method which gives us results closer to reality. This allows us to reach at a stage wherein we can provide our clients best and accurate investment to output ratio.
Each report that we prepare takes a timeframe of 350-400 business hours for production. Starting from the selection of titles through a couple of in-depth brain storming session to the final QC process before uploading our titles on our website we dedicate around 350 working hours. The titles are selected based on their current market cap and the foreseen CAGR and growth.
The 5 steps process:
Step 1: Secondary Research:
Secondary Research or Desk Research is as the name suggests is a research process wherein, we collect data through the readily available information. In this process we use various paid and unpaid databases which our team has access to and gather data through the same. This includes examining of listed companies’ annual reports, Journals, SEC filling etc. Apart from this our team has access to various associations across the globe across different industries. Lastly, we have exchange relationships with various university as well as individual libraries.
Step 2: Primary Research
When we talk about primary research, it is a type of study in which the researchers collect relevant data samples directly, rather than relying on previously collected data. This type of research is focused on gaining content specific facts that can be sued to solve specific problems. Since the collected data is fresh and first hand therefore it makes the study more accurate and genuine.
We at SNS Insider have divided Primary Research into 2 parts.
Part 1 wherein we interview the KOLs of major players as well as the upcoming ones across various geographic regions. This allows us to have their view over the market scenario and acts as an important tool to come closer to the accurate market numbers. As many as 45 paid and unpaid primary interviews are taken from both the demand and supply side of the industry to make sure we land at an accurate judgement and analysis of the market.
This step involves the triangulation of data wherein our team analyses the interview transcripts, online survey responses and observation of on filed participants. The below mentioned chart should give a better understanding of the part 1 of the primary interview.
Part 2: In this part of primary research the data collected via secondary research and the part 1 of the primary research is validated with the interviews from individual consultants and subject matter experts.
Consultants are those set of people who have at least 12 years of experience and expertise within the industry whereas Subject Matter Experts are those with at least 15 years of experience behind their back within the same space. The data with the help of two main processes i.e., FGDs (Focused Group Discussions) and IDs (Individual Discussions). This gives us a 3rd party nonbiased primary view of the market scenario making it a more dependable one while collation of the data pointers.
Step 3: Data Bank Validation
Once all the information is collected via primary and secondary sources, we run that information for data validation. At our intelligence centre our research heads track a lot of information related to the market which includes the quarterly reports, the daily stock prices, and other relevant information. Our data bank server gets updated every fortnight and that is how the information which we collected using our primary and secondary information is revalidated in real time.
Step 4: QA/QC Process
After all the data collection and validation our team does a final level of quality check and quality assurance to get rid of any unwanted or undesired mistakes. This might include but not limited to getting rid of the any typos, duplication of numbers or missing of any important information. The people involved in this process include technical content writers, research heads and graphics people. Once this process is completed the title gets uploader on our platform for our clients to read it.
Step 5: Final QC/QA Process:
This is the last process and comes when the client has ordered the study. In this process a final QA/QC is done before the study is emailed to the client. Since we believe in giving our clients a good experience of our research studies, therefore, to make sure that we do not lack at our end in any way humanly possible we do a final round of quality check and then dispatch the study to the client.
Key Segments:
By Type
Rigid
Flexible
By Polymer
Polyethylene Terephthalate (PET)
Polypropylene (PP)
Polystyrene (PS)
Polyvinyl Chloride (PVC)
Polycarbonate (PC)
Polymethyl Methacrylate (PMMA)
Others
By Application
Packaging
Electrical & Electronics
Consumer Goods
Building & Construction
Automotive
Healthcare
Others
Request for Segment Customization as per your Business Requirement: Segment Customization Request
Regional Coverage:
North America
US
Canada
Mexico
Europe
Eastern Europe
Poland
Romania
Hungary
Turkey
Rest of Eastern Europe
Western Europe
Germany
France
UK
Italy
Spain
Netherlands
Switzerland
Austria
Rest of Western Europe
Asia Pacific
China
India
Japan
South Korea
Vietnam
Singapore
Australia
Rest of Asia Pacific
Middle East & Africa
Middle East
UAE
Egypt
Saudi Arabia
Qatar
Rest of Middle East
Africa
Nigeria
South Africa
Rest of Africa
Latin America
Brazil
Argentina
Colombia
Rest of Latin America
Request for Country Level Research Report: Country Level Customization Request
Available Customization
With the given market data, SNS Insider offers customization as per the company’s specific needs. The following customization options are available for the report:
Product Analysis
Criss-Cross segment analysis (e.g. Product X Application)
Product Matrix which gives a detailed comparison of product portfolio of each company
Geographic Analysis
Additional countries in any of the regions
Company Information
Detailed analysis and profiling of additional market players (Up to five)
The Algae Biofuel Market Size was valued at USD 9.08 billion in 2023 and is expected to reach USD 18.66 billion by 2032 and grow at a CAGR of 9.58% over the forecast period 2024-2032.
The Ketones Market size was valued at USD 23.4 billion in 2023 It is estimated to hit USD 32.1 billion by 2032 and grow at a CAGR of 3.6% over the forecast period of 2024-2032.
Permanent Magnet Market Size was valued at USD 22.56 billion in 2023. It is projected to reach USD 47.01 billion by 2032 and grow at a CAGR of 8.5% over the forecast period 2024-2032.
The Agrochemicals Market size was USD 236.12 billion in 2023 and is expected to Reach USD 308.69 billion by 2031 and grow at a CAGR of 3.4% over the forecast period of 2024-2031.
The Maleic Anhydride Market Size was valued at expected to reach USD 4.30 billion by 2030, and USD 3.03 billion in 2022 and grow at a CAGR of 4.5% over the forecast period 2023-2030.
The Biogas Market Size was valued at USD 63.91 billion in 2023 and is expected to reach USD 95.80 billion by 2032, and grow at a CAGR of 5.01% over the forecast period 2024-2032.
Hi! Click one of our member below to chat on Phone