Type 2 Diabetes Market Report Scope & Overview:
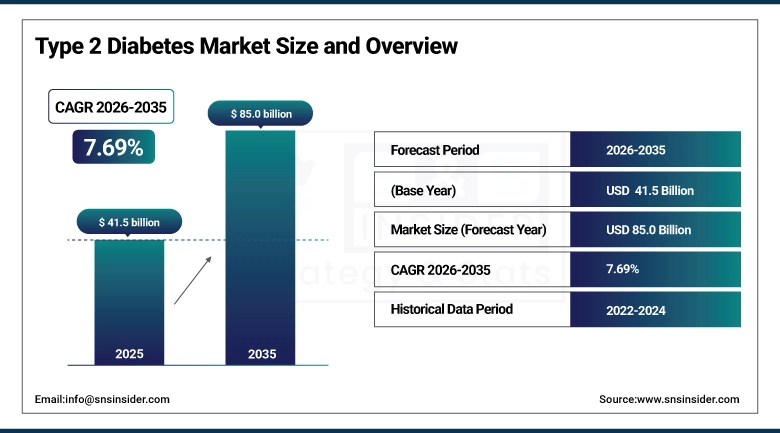
The Type 2 Diabetes Market was valued at USD 41.5 billion in 2025 and is expected to reach USD 85.0 billion by 2035, growing at a CAGR of 7.69% from 2026-2035.
Type 2 diabetes is simultaneously the world's most prevalent serious chronic disease and its most commercially productive pharmaceutical category a convergence that reflects the biology of insulin resistance meeting the commercial incentive of a patient population whose therapy is lifelong. The IDF Diabetes Atlas 2023 documents 537 million adults living with diabetes globally, with type 2 diabetes accounting for over 95% of cases, and projects this to reach 783 million by 2045 driven by population growth, aging, rising obesity prevalence, and sedentary lifestyle patterns that accelerate insulin resistance development. The pharmaceutical response to this epidemic has been extraordinary: from metformin's original approval in 1957 through the successive introductions of sulfonylureas, thiazolidinediones, DPP-4 inhibitors, GLP-1 receptor agonists, and SGLT-2 inhibitors, the treatment toolkit for type 2 diabetes has expanded from a single effective mechanism to seven distinct drug classes with complementary mechanisms, side effect profiles, and demonstrated cardiovascular and renal protection that extends diabetes treatment's clinical benefit well beyond glycemic control alone. The market's 7.69% CAGR reflects both the epidemic's relentless progression and the extraordinary commercial momentum of the GLP-1 and SGLT-2 drug classes whose clinical benefits in cardiovascular and weight outcomes have generated the fastest-growing pharmaceutical revenue in history.
The IDF Diabetes Atlas 2023 documents that diabetes healthcare expenditure reached USD 966 billion globally in 2023 representing 9% of total global adult healthcare expenditure with pharmaceutical therapy comprising the majority. Novo Nordisk's Ozempic (semaglutide) and Eli Lilly's Mounjaro (tirzepatide) collectively generated over USD 25 billion in revenue in 2023, making GLP-1 receptor agonists the fastest-growing drug class in pharmaceutical history by any commercial metric.
Type 2 Diabetes Market Size and Forecast
-
Market Size in 2025: USD 41.5 Billion
-
Market Size by 2035: USD 85.0 Billion
-
CAGR: 7.69% from 2026 to 2035
-
Base Year: 2025
-
Forecast Period: 2026-2035
-
Historical Data: 2022-2024
To Get more information on Type 2 Diabetes Market - Request Free Sample Report
Type 2 Diabetes Market Trends
-
GLP-1/GIP dual receptor agonism (tirzepatide) and triple agonism targeting GLP-1, GIP, and glucagon receptors simultaneously are demonstrating weight loss and glycemic control outcomes that exceed any prior diabetes pharmacology — establishing a new clinical benchmark that is reshaping treatment algorithms globally.
-
Oral GLP-1 receptor agonists semaglutide tablets (Rybelsus) and oral tirzepatide in development are expanding the GLP-1 patient population by offering the drug class's benefits without injectable administration, addressing the needle phobia and injection burden that previously limited GLP-1 adoption in subcutaneous injection-averse patients.
-
CGM-informed closed-loop insulin delivery combining continuous glucose monitoring with algorithm-driven automated insulin adjustment is achieving glycemic control quality in type 2 diabetes insulin users that was previously achievable only in optimal structured self-management programs.
-
Cardiovascular and renal outcome labeling for SGLT-2 inhibitors (empagliflozin, dapagliflozin, canagliflozin) is driving their adoption in cardiometabolic patients regardless of glycemic indication, expanding the prescribing base for this class beyond endocrinologists to cardiologists and nephrologists.
-
Biosimilar insulin competition following the 2020s patent expiration of major insulin products including glargine and aspart is reducing insulin costs globally, improving access in lower-income markets while compressing branded insulin revenue in markets with formulary biosimilar substitution policies.
-
Type 2 diabetes remission programs using intensive lifestyle intervention, very low calorie diets, and bariatric surgery are demonstrating durable disease remission that challenges the chronic disease management paradigm, creating both clinical innovation and market disruption potential.
-
AI-powered diabetes digital therapeutics combining CGM data, lifestyle coaching, medication adherence monitoring, and prescriber-facing dashboards are improving type 2 diabetes management outcomes at population scale in ways that clinic visits alone cannot achieve.
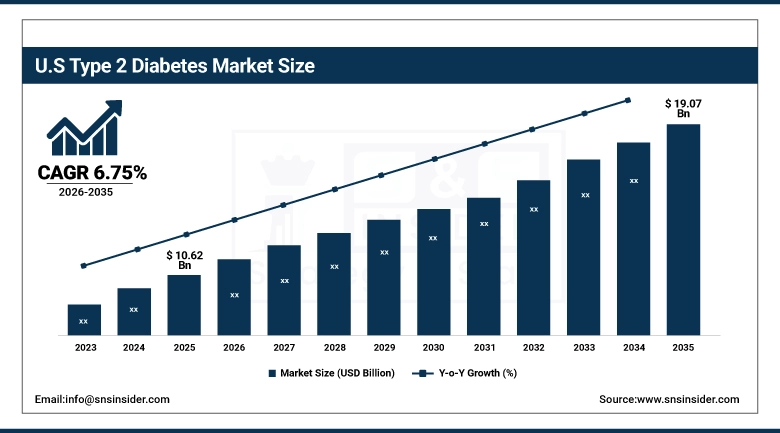
U.S. Type 2 Diabetes Market was valued at USD 10.62 billion in 2023 and is expected to reach USD 19.07 billion by 2032, growing at a CAGR of 6.75% from 2026-2035.
North America dominated the global Type 2 Diabetes Market, with the United States representing the world's largest national type 2 diabetes pharmaceutical market sustained by the highest absolute type 2 diabetes drug spend per patient globally, the most rapid adoption of premium-priced GLP-1 and SGLT-2 drug classes, and a pharmaceutical reimbursement infrastructure that covers the majority of working-age diabetic patients through commercial insurance and older patients through Medicare Part D. The U.S. market's extraordinary per-patient drug expenditure driven by branded GLP-1 and SGLT-2 pricing that substantially exceeds international reference prices creates commercial revenue scale that global market share comparisons understate relative to the U.S.'s proportional patient contribution. Medicare Part D's 2023 insulin price cap of USD 35/month per beneficiary has reduced insulin revenue in the U.S. while improving insulin access for the Medicare diabetic population — a policy impact that reshapes the drug class mix within the U.S. T2D market.
Eli Lilly's tirzepatide (Mounjaro/Zepbound) generated USD 5.2 billion in U.S. revenue in 2023 in its first full commercial year the fastest product launch in pharmaceutical history. The CDC's National Diabetes Statistics Report documents that 38.4 million Americans had diabetes in 2021 (11.6% of the population), with type 2 diabetes representing 90-95% of cases creating a U.S. patient population whose pharmaceutical treatment generates market revenue disproportionate to its global share due to U.S. branded drug pricing.
Type 2 Diabetes Market Segment Analysis
-
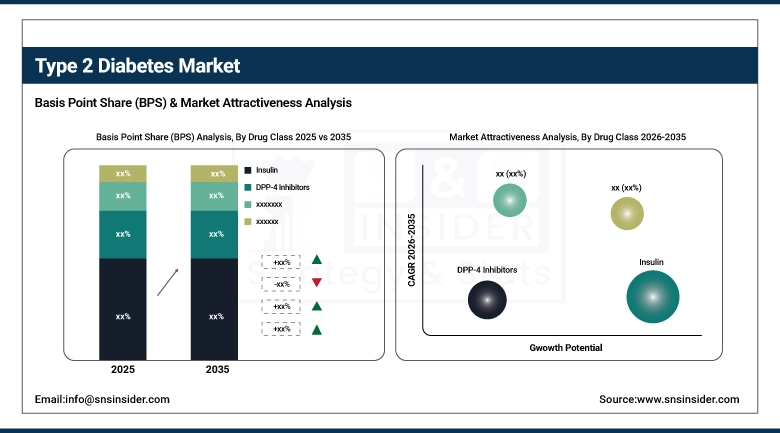
By Drug Class, Insulin dominated with 32.5% share in 2025; GLP-1 Receptor Agonists growing most rapidly; SGLT-2 Inhibitors fastest growing by CAGR.
-
By Route of Administration, Subcutaneous dominated the Type 2 Diabetes Market in 2025; Oral route growing fastest driven by tablet GLP-1 development.
-
By Distribution Channel, Retail Pharmacies dominated with 70.3% share in 2025; Online Pharmacies fastest growing.
By Drug Class: Insulin dominates, GLP-1 Agonists rapidly growing, SGLT-2 fastest CAGR
Insulin held approximately 32.5% of the Type 2 Diabetes Market in 2023, a dominance maintained by insulin's clinical necessity for type 2 diabetes patients who have progressed beyond the glycemic control capacity of oral medications and injectable non-insulin agents. Type 2 diabetes is a progressive condition pancreatic beta cell function declines over time regardless of pharmaceutical management meaning that the majority of patients who are diagnosed in middle age will require insulin therapy at some point in their disease course, creating an eventually unavoidable insulin market. The insulin market's commercial dynamics are transforming: biosimilar competition following the 2020s patent expirations of major insulin products is redirecting market share from branded reference insulins to significantly lower-priced biosimilars, improving patient access while compressing manufacturer revenue per unit.
GLP-1 Receptor Agonists are the most commercially dynamic segment in the Type 2 Diabetes Market, driven by the extraordinary clinical profile of semaglutide and tirzepatide drugs that simultaneously achieve superior glycemic control, 15-22% body weight reduction, and clinically meaningful cardiovascular risk reduction in large randomized trials whose outcomes have restructured prescribing priorities globally. The SELECT trial's demonstration that semaglutide reduces cardiovascular events in obese patients without diabetes, and the SURMOUNT-1 trial's documentation of tirzepatide's 22.5% weight reduction, have collectively extended GLP-1 market demand beyond the traditional type 2 diabetes patient population to encompass the much larger obesity and cardiometabolic risk reduction markets. Novo Nordisk's semaglutide and Eli Lilly's tirzepatide are competing for a market whose total addressable patient population when obesity and pre-diabetes are included — exceeds 300 million adults in OECD countries alone.
SGLT-2 Inhibitors including empagliflozin (Jardiance), dapagliflozin (Farxiga), and canagliflozin (Invokana) are growing at the fastest drug class CAGR, driven by their expanding approved indications beyond type 2 diabetes to heart failure and chronic kidney disease. SGLT-2 inhibitors' demonstrated 35% relative reduction in heart failure hospitalization (EMPEROR-Reduced trial, empagliflozin), 27% reduction in eGFR decline (DAPA-CKD trial, dapagliflozin), and 30% reduction in kidney disease progression are creating prescribing by cardiologists and nephrologists who would not previously have prescribed diabetes drugs expanding the SGLT-2 market beyond the endocrinology prescriber base that launched the class.
FDA's 2023 approval expansion of empagliflozin for heart failure with preserved ejection fraction (HFpEF) a condition affecting 3.3 million Americans with no previously approved pharmacological treatment created the largest single indication expansion in SGLT-2 inhibitor history, immediately addressable by the 30+ million U.S. patients with HFpEF regardless of their diabetes status.
By Route of Administration: Subcutaneous dominates, Oral growing fastest
Subcutaneous route held the dominant position in the Type 2 Diabetes Market in 2025, reflecting insulin's subcutaneous administration requirement which applies to all insulin formulations and the subcutaneous injection delivery of GLP-1 receptor agonists including weekly semaglutide (Ozempic), dulaglutide (Trulicity), and tirzepatide (Mounjaro). The subcutaneous route's market share reflects both its established clinical infrastructure trained patients, injection technique education programs, sharps disposal systems and the pharmacokinetic advantages that subcutaneous delivery provides for sustained-release formulations whose once-weekly injection frequency represents a major adherence advantage over daily dosing regimens. Insulin pen technology including connected smart pens that log injection timing and dose for integration with CGM and diabetes management apps — is improving the adherence and outcomes tracking of subcutaneous insulin therapy.
The Oral route is growing at the fastest CAGR within the Type 2 Diabetes Market, driven by the commercial momentum of oral semaglutide (Rybelsus) the first oral GLP-1 receptor agonist and the clinical development programs pursuing oral tirzepatide, oral insulin, and oral SGLT-2/GLP-1 combination products. Rybelsus's approval in 2019 demonstrated that GLP-1 receptor agonist benefits are achievable via tablet administration, albeit at higher doses than subcutaneous equivalents proving the concept that has accelerated investment in improving oral peptide bioavailability through absorption enhancers, enteric coatings, and novel delivery technology. The needle-phobic and injection-averse patient segment estimated at 20-40% of T2D patients with injectable treatment indications represents a specific market population for whom oral GLP-1 availability could substantially improve medication adherence.
By Distribution Channel: Retail Pharmacies dominate, Online growing fastest
Retail Pharmacies held approximately 70.3% of the Type 2 Diabetes Market in 2023, reflecting their structural position as the primary dispensing channel for chronic disease medications in the United States and most developed markets. Type 2 diabetes medications' chronic maintenance therapy profile where patients fill the same prescription monthly for years — is ideally suited to retail pharmacy dispensing, whose convenience, geographic accessibility, and pharmacist counseling capability create a value proposition that alternatives struggle to match for the majority of diabetic patients. The U.S. insulin copay cap through pharmacy benefit programs has further reinforced retail pharmacy as the primary access point for insulin — ensuring that the Medicare diabetic population can access insulin at USD 35/month through retail pharmacy regardless of insulin product selection.
Online Pharmacies are the fastest-growing distribution channel, driven by the convenience premium that digital-first consumers place on home delivery of maintenance medications, the cost advantages that online pharmacies can offer for generic and biosimilar diabetes medications, and the telehealth integration that enables online pharmacy-linked prescribers to write and fill GLP-1 prescriptions through integrated digital health platforms. Ro, Hims & Hers, and Amazon Pharmacy are building online diabetes care platforms that integrate telehealth consultation, prescription management, CGM data review, and pharmacy dispensing in a single digital experience — positioning online pharmacy as the primary care model for a growing segment of type 2 diabetes patients.
Type 2 Diabetes Market Regional Analysis
|
Region |
Major Country |
Share within Region (%) |
|---|---|---|
|
North America |
United States |
88% |
|
Europe |
Germany |
27% |
|
Asia Pacific |
China |
42% |
|
Middle East & Africa |
Saudi Arabia |
38% |
|
Latin America |
Brazil |
50% |
North America Type 2 Diabetes Market Insights
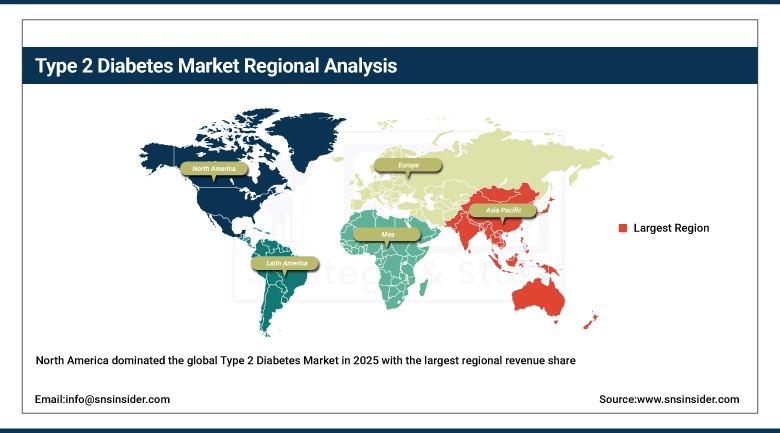
North America dominated the global Type 2 Diabetes Market in 2025 with the largest regional revenue share, driven by the United States' combination of high T2D prevalence, premium branded drug pricing for GLP-1 and SGLT-2 agents, and comprehensive pharmaceutical insurance coverage. The U.S. market's GLP-1 adoption rate substantially exceeds other regions: U.S. GLP-1 prescription volumes grew 300% between 2020 and 2024, sustained by commercial insurance formulary inclusion and the extraordinary viral marketing that patient weight loss success stories on social media generated for semaglutide and tirzepatide. The Inflation Reduction Act's Medicare drug price negotiation provisions which designated several T2D medications including empagliflozin for negotiated pricing beginning in 2026 will affect branded SGLT-2 revenue while potentially improving Medicare beneficiary access through lower out-of-pocket costs.
Medicare drug price negotiation under the Inflation Reduction Act selected Jardiance (empagliflozin) as one of the first 10 drugs subject to negotiated pricing for 2026, with the negotiated price announced 30-40% below the 2024 list price a policy change affecting USD 3.1 billion in annual Medicare empagliflozin expenditure that will reshape SGLT-2 revenue dynamics in the world's largest T2D drug market.
Get Customized Report as per Your Business Requirement - Enquiry Now
Asia Pacific Type 2 Diabetes Market Insights
Asia Pacific is the fastest-growing regional Type 2 Diabetes Market, driven by the world's largest absolute diabetic populations in China (approximately 140 million adults with diabetes) and India (approximately 101 million) populations whose pharmaceutical treatment rate is improving as healthcare access, diabetes awareness, and per-capita healthcare spending all increase simultaneously. China's National Healthcare Security Administration's progressive expansion of type 2 diabetes medication reimbursement coverage including recent additions of SGLT-2 inhibitors and GLP-1 agonists to the national reimbursement drug list is converting clinical diagnosis to pharmaceutical treatment at scale. India's National Programme for Non-Communicable Diseases is investing in diabetes screening programs that identify undiagnosed cases the IDF estimates that over 50% of India's diabetic adults are undiagnosed creating a pipeline of newly diagnosed patients entering pharmaceutical treatment.
Europe Type 2 Diabetes Market Insights
Europe's Type 2 Diabetes Market is driven by national health insurance systems providing universal coverage for type 2 diabetes medications across the major European economies, combined with European diabetes clinical guideline recommendations that have progressively endorsed GLP-1 receptor agonists and SGLT-2 inhibitors as second-line therapy for T2D patients with established cardiovascular disease or high cardiovascular risk. Germany, France, the UK, and Italy are the primary European T2D markets, where Novo Nordisk and Eli Lilly's GLP-1 commercial programs have achieved growing market penetration following national health technology assessment approvals that establish reimbursement conditions. The UK's NICE appraisal process which evaluates cost-effectiveness using the ICER framework has issued positive recommendations for semaglutide and tirzepatide in specific T2D populations defined by BMI and cardiovascular risk, creating structured reimbursement access within NHS prescribing guidelines.
MEA and Latin America Type 2 Diabetes Market Insights
The Middle East's Type 2 Diabetes Market is growing with the Gulf states' extraordinarily high T2D prevalence — the IDF documents UAE prevalence at 16.3% and Saudi Arabia at 18.0% of adults, among the world's highest national rates driven by the combination of genetic predisposition, dietary patterns, physical inactivity, and rapidly aging demographics. The Gulf states' government healthcare programs provide comprehensive T2D medication coverage for citizens, creating a commercially accessible market for premium diabetes drugs at internationally competitive pricing. Saudi Arabia's Vision 2030 chronic disease management component includes investment in diabetes screening, prevention, and treatment infrastructure as a healthcare priority. Latin America's T2D market concentrates in Brazil and Mexico, where both countries' universal healthcare systems provide insulin access while coverage of newer drug classes varies by state/regional formulary.
Type 2 Diabetes Market Growth Drivers:
GLP-1 receptor agonist clinical breakthroughs and global diabetes epidemic progression driving extraordinary type 2 diabetes market growth
The Type 2 Diabetes Market's 7.69% CAGR reflects the compounding of two powerful growth forces: the relentless progression of the global diabetes epidemic — which adds approximately 20 million new diagnosed cases annually — and the GLP-1 revolution whose cardiovascular, weight, and renal outcome benefits have expanded the drug class's addressable indication from type 2 diabetes management to the much larger cardiometabolic risk reduction market. The SELECT trial's demonstration that semaglutide reduces cardiovascular events in obese patients without diabetes effectively extended the addressable market for GLP-1 drugs beyond diabetic patients to the entire overweight/obese population with cardiovascular risk — a patient population estimated at 800 million adults globally. This indication expansion, combined with ongoing label expansions for existing molecules and the pipeline of next-generation GLP-1/GIP/GCG triple agonists, is generating pharmaceutical market growth rates in T2D that exceed any prior chronic disease category.
Type 2 Diabetes Market Restraints:
Drug pricing pressure and manufacturing capacity constraints limiting type 2 diabetes GLP-1 market access globally
The Type 2 Diabetes Market's growth is constrained by two specific commercial challenges whose resolution will define GLP-1 market penetration over the forecast period. Manufacturing capacity for semaglutide and tirzepatide has been the binding constraint on market growth since 2022, with both Novo Nordisk and Eli Lilly unable to supply global demand — leading to documented shortages, formulary restrictions by payers, and patient access limitations in markets where supply allocation was insufficient. Both companies have announced USD 8+ billion in manufacturing capacity expansion, but capital deployment to manufacturing production typically requires 3-5 years from investment decision to commercial production ramp. Simultaneously, GLP-1 drug pricing — at USD 800-1,200/month in the U.S. — creates access barriers for uninsured patients and creates formulary restriction pressure from payers whose combined GLP-1 expenditure is straining pharmacy benefit budgets.
Type 2 Diabetes Market Opportunities:
Oral GLP-1 development and biosimilar semaglutide competition creating transformative type 2 diabetes market growth opportunities
Oral GLP-1 receptor agonists represent the type 2 diabetes market's most commercially transformative near-term opportunity, because needle-free administration addresses the primary adoption barrier for a significant portion of the patient population. Novo Nordisk's oral semaglutide (Rybelsus) has demonstrated the clinical proof of concept; the company's next-generation oral semaglutide formulation — OW-OAD, in Phase 3 trials as of 2024 — targets once-weekly oral dosing that would match subcutaneous semaglutide's convenience profile while eliminating injection entirely. Eli Lilly's oral tirzepatide clinical program, and the broader industry pipeline of oral GLP-1 agonists from AstraZeneca, Pfizer, and Roche, represent competing approaches whose commercial success would substantially expand the GLP-1 market's addressable patient population while compressing injectable GLP-1 market share.
Recent Developments:
-
2026: Novo Nordisk received FDA approval for Wegovy (semaglutide 2.4mg) for reducing cardiovascular events in adults with obesity or overweight and established cardiovascular disease — the first FDA-approved anti-obesity medication with a cardiovascular outcomes label — converting cardiovascular risk reduction from a secondary diabetes indication to a primary cardiovascular indication and establishing a new commercial basis for GLP-1 prescribing in cardiology practice.
-
2025: Eli Lilly announced Phase 3 trial completion for oral tirzepatide, reporting 14.8% mean body weight reduction over 72 weeks in adults with obesity — equivalent to subcutaneous tirzepatide performance in direct comparison — with FDA regulatory submission filed in Q4 2025 for both obesity and type 2 diabetes oral indications that would create the first once-weekly oral dual GLP-1/GIP agonist available commercially.
-
2025: Tandem Diabetes Care received FDA clearance for Control-IQ+ automated insulin delivery technology for type 2 diabetes adults — the first closed-loop insulin delivery system FDA-cleared for the type 2 diabetes indication — enabling automated insulin dose adjustment in the estimated 5 million U.S. adults with type 2 diabetes requiring insulin therapy who would benefit from algorithm-assisted glycemic management that reduces hypoglycemia risk and reduces the daily diabetes management cognitive burden.
Type 2 Diabetes Market Key Players
Some of the Type 2 Diabetes Market Companies
-
Novo Nordisk A/S
-
Eli Lilly and Company
-
AstraZeneca plc
-
Sanofi SA
-
Boehringer Ingelheim GmbH
-
Merck & Co. Inc. (MSD)
-
Johnson & Johnson (Janssen)
-
Takeda Pharmaceutical Co. Ltd.
-
Pfizer Inc.
-
Daiichi Sankyo Co. Ltd.
-
Biocon Ltd.
-
Wockhardt Ltd.
-
Sun Pharmaceutical Industries Ltd.
-
Tonghua Dongbao Pharmaceutical
-
MannKind Corporation
-
Zealand Pharma A/S
-
Structure Therapeutics Inc.
-
Altimmune Inc.
-
Inventiva Pharma SA
-
Carmot Therapeutics Inc. (Roche)
Type 2 Diabetes Market Report Scope:
| Report Attributes | Details |
|---|---|
| Market Size in 2025 | USD 41.5 Billion |
| Market Size by 2035 | USD 85.0 Billion |
| CAGR | CAGR of 7.69% From 2026 to 2035 |
| Base Year | 2025 |
| Forecast Period | 2026-2035 |
| Historical Data | 2022-2024 |
| Report Scope & Coverage | Market Size, Segments Analysis, Competitive Landscape, Regional Analysis, DROC & SWOT Analysis, Forecast Outlook |
| Key Segments | • By Drug Class [Insulin, DPP-4 Inhibitors, GLP-1 Receptor Agonists, SGLT2 Inhibitors, Others] • By Route of Administration [Oral, Subcutaneous, Intravenous] • By Distribution Channel (Retail Pharmacies, Hospital Pharmacies, Other) |
| Regional Analysis/Coverage | North America (US, Canada), Europe (Germany, UK, France, Italy, Spain, Russia, Poland, Rest of Europe), Asia Pacific (China, India, Japan, South Korea, Australia, ASEAN Countries, Rest of Asia Pacific), Middle East & Africa (UAE, Saudi Arabia, Qatar, South Africa, Rest of Middle East & Africa), Latin America (Brazil, Argentina, Mexico, Colombia, Rest of Latin America). |
| Company Profiles | Novo Nordisk A/S, Eli Lilly and Company, AstraZeneca plc, Sanofi SA, Boehringer Ingelheim GmbH, Merck & Co. Inc. (MSD), Johnson & Johnson (Janssen), Takeda Pharmaceutical Co. Ltd., Pfizer Inc., Daiichi Sankyo Co. Ltd., Biocon Ltd., Wockhardt Ltd., Sun Pharmaceutical Industries Ltd., Tonghua Dongbao Pharmaceutical, MannKind Corporation, Zealand Pharma A/S, Structure Therapeutics Inc., Altimmune Inc., Inventiva Pharma SA, Carmot Therapeutics Inc. (Roche) |
Frequently Asked Questions
Ans: North America dominated; Asia Pacific is the fastest growing regional market.
Ans: Retail Pharmacies dominated with approximately 70.3% share; Online Pharmacies are the fastest growing.
Ans: Insulin dominated with approximately 32.5% share in 2025; SGLT-2 Inhibitors are fastest growing by CAGR.
Ans: The Type 2 Diabetes Market was valued at USD 41.5 billion in 2025.
Ans: The Type 2 Diabetes Market is expected to grow at a CAGR of 7.69% from 2026 to 2035.
Get in Touch
