UART-to-SPI Bridge Market Report Scope and Overview:
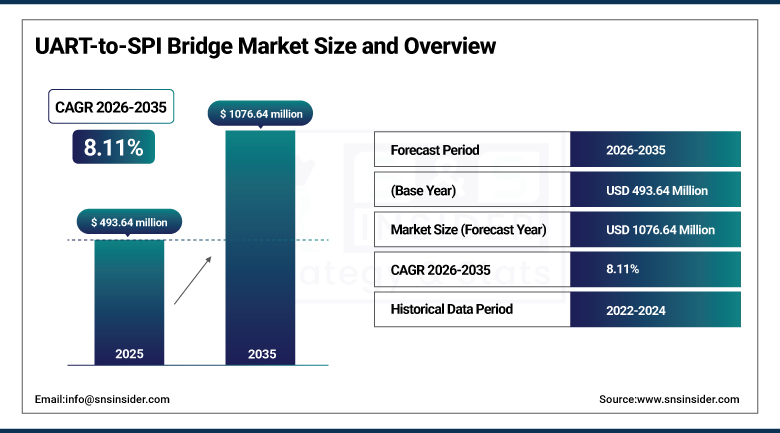
The UART-to-SPI Bridge Market Size was valued at USD 493.64 Million in 2025 and is expected to reach USD 1076.64 Million by 2035 and grow at a CAGR of 8.11% over the forecast period 2026-2035.
The global market growth is driven by the proliferation of embedded systems in multiple industries, along with the increasing demand for efficient connected devices and communication protocols in IoT devices, and advancement in microcontroller interfaces. The increased demand for automation and connectivity across automotive, consumer electronics, and industrial sectors is also driving the popularity of UART-to-SPI bridges globally.
According to research, approximately 60% of IoT devices prioritize low-power communication protocols, which boosts the adoption of UART-to-SPI bridges in the world.
UART-to-SPI Bridge Market Size and Forecast:
-
Market Size in 2025: USD 493.64 Million
-
Market Size by 2035: USD 1076.64 Million
-
CAGR: 8.11% from 2026 to 2035
-
Base Year: 2025
-
Forecast Period: 2026–2035
-
Historical Data: 2022–2024
To Get More Information On UART-to-SPI Bridge Market - Request Free Sample Report
UART-to-SPI Bridge Market Highlights:
-
Diodes Incorporated launched the PI7C9X762Q, a new automotive-qualified I²C/SPI-to-dual-channel UART bridge designed to enhance data connectivity and robustness in next-generation vehicle systems.
-
The PI7C9X762Q supports full bidirectional protocol conversion from I²C or SPI host interfaces to dual UART channels, enabling flexible communication across smart cockpits, zonal gateways, ADAS, telematics, and central controllers.
-
It offers high performance with SPI clock rates up to 33 Mbps, 64-byte transmit/receive FIFOs, programmable baud rates, parity, stop-bit settings, and backward compatibility with standard UART register sets to simplify development.
-
The device features low power operation and sleep modes, enhancing energy efficiency for electric and hybrid vehicle designs.
-
Built for automotive environments, the PI7C9X762Q is AEC-Q100 Grade 2 qualified (operating from –40 °C to +105 °C) with enhanced EMC performance and robust signal integrity for harsh vehicle conditions.
-
Its compact 5×5 mm package includes up to eight programmable GPIO pins, hardware/software flow control, fractional baud support, and software reset capability, enabling flexible design and integration.
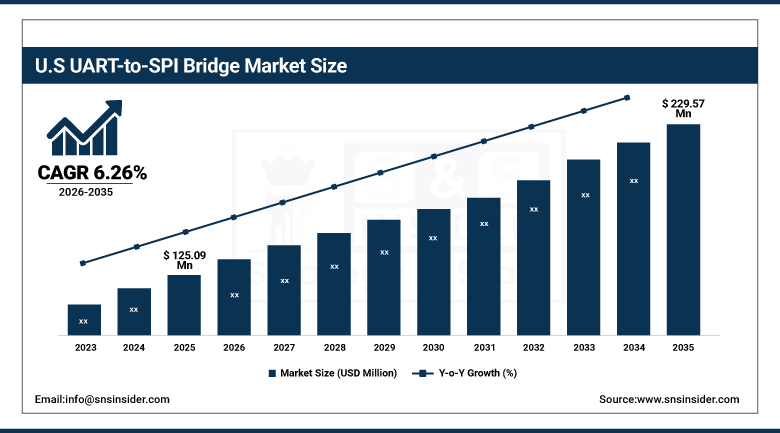
The U.S. UART-to-SPI Bridge Market size was USD 125.09 Million in 2025 and is expected to reach USD 229.57 Million by 2035, growing at a CAGR of 6.26 % over the forecast period of 2026–2035. The U.S. UART-to-SPI Bridge Market growth attributed to growth of automation across the industries and penetration of the embedded systems in the product line-ups for consumer electronics and automotive products. In addition, the U.S. concentration on several advanced manufacturing and smart device efforts continues to generate demand for UART-to-SPI bridges, creating the potential for expanded integration, multi-device interoperability and advanced communication.
According to research, over 70% of the U.S. manufacturers are adopting interoperable multi-device communication standards, driving demand for efficient interfaces, such as UART-to-SPI bridges.
UART-to-SPI Bridge Market Drivers:
-
Rising Adoption of IoT Devices Increasing Demand for UART-to-SPI Bridges Globally
The rapid rise of uptake in IoT devices has caused the demand for UART-to-SPI bridges to soar, with these devices providing microcontrollers communication to sensors and other peripherals. Efficient data transmission protocols are essential as smart home, wearable devices, and industrial IoT systems increase rapidly. UART-to-SPI bridges provide low power, ease of use, and reliability, among others, and are thus essential in bridging various devices. Such a burgeoning ecosystem is driving exciting market growth as device manufacturers are looking for affordable and reliable interface solutions to expand the reach of their products.
According to research, more than 60% of microcontroller-based IoT devices currently employ UART-to-SPI bridges for peripheral communication.
UART-to-SPI Bridge Market Restraints:
-
Complexity in Integration with Legacy Systems Impedes Market Growth
Low compatibility with the traditional legacy hardware and software systems is a restraining factor for the UART to SPI bridge market. Indeed, much industrial and consumer equipment depends on aging communication protocol which may not be easily interface-able with UART-to-SPI bridge technology. This incompatibility necessitates extra design works, and it saves time and cost for both bridge manufacturers, preventing them from trying new bridge solutions. Moreover, non-standardized protocols in various industries result in fragmentation, hampering easy deployment and delaying the overall market growth.
UART-to-SPI Bridge Market Opportunities:
-
Expansion of Smart Manufacturing and Industry 4.0 Fuels UART-to-SPI Bridge Demand
Smart manufacturing and Industry 4.0 trends push toward integrated communication interfaces on the global market. This UART-to-SPI bridge is required to connect different sensors and controllers in an automated factory or robotics system. They enable machine to machine communication, make it possible to operate processes automatically and minimize downtimes. Rising adoption of automation and digitalization in end-use industries, particularly in the emerging economies, represents the potential for growth of the UART-to-SPI bridge market.
According to research, Factories implementing automated communication protocols using UART-to-SPI bridges have reported downtime reductions of up to 30%, enhancing productivity.
UART-to-SPI Bridge Market Segment Analysis:
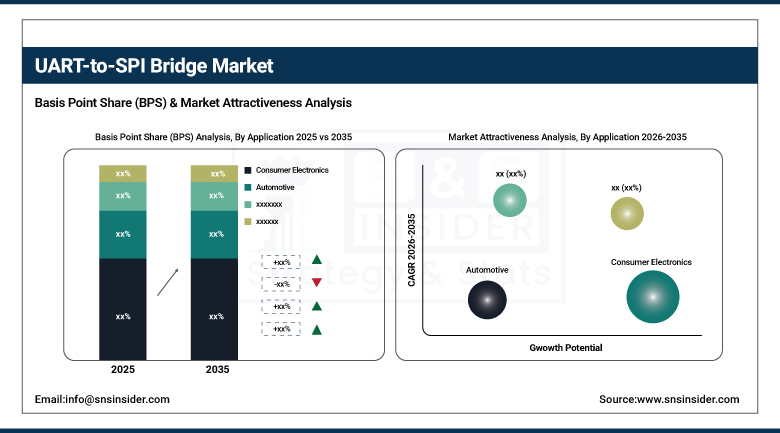
By Application
Consumer Electronics segment dominated the UART-to-SPI Bridge Market with the highest revenue share of about 30.94% in 2025 as UART-to-SPI bridges are integrated in many devices including smartphones, wearables, and smart appliances. UART-to-SPI Bridge Companies such as Texas Instruments have been instrumental in providing the market with dependable bridge ICs optimized for small, low-power consumer devices. This is driving the dominance of this segment, supported by the increasing need for connectivity and the rise of higher performing devices based on the rapid development of new technology generations and rising consumer expectations.
The industrial segment is expected to grow at the fastest CAGR of about 9.34% over 2026-2035 due to increasing automation and Industry 4.0 technologies. UART-to-SPI bridges support the tough and stony plain communication performing in industrial sensors and control systems to satisfy requirements for competitive accuracy and safety in manufacturing, process control and robotics applications. Analog Devices has continuously developed ideas for industrial grade communication solutions.
By Bit Rate
Medium-Speed (1 Mbps to 10 Mbps) segment dominated the UART-to-SPI Bridge Market with the highest revenue share of about 46.37% in 2054 as it strikes the perfect balance between speed and efficiency. This power range is suitable for most embedded systems without overshot power. Intermediate speeds are also supported by manufacturers such as Maxim Integrated, which provides a menu of flexible UART-to-SPI bridge ICs to meet mass market product needs that cut across the electronics and industrial markets.
Low-Speed (up to 1 Mbps) segment is expected to grow at the fastest CAGR of about 9.16% over 2026-2035, driven by the proliferation of battery-powered devices, such as fitness trackers, portable medical devices, and cheap sensor nodes. On top of that, NXP Semiconductors introduces power efficient low-speed interface solutions for smaller low-power applications enabling you to bridge the design challenges of the next generation of portable electronics.
By Type
Half-Duplex segment dominated the UART-to-SPI Bridge Market with the highest revenue share of about 71.17% in 2025 because of its simple structure with less wires and components. Hence, half-duplex solutions are the most competitive choice when working with embed design. Silicon Labs Silicon Labs, a leader in connectivity technology, provides a number of half-duplex UART-to-SPI bridge solutions that are widely used in automotive and consumer sectors for small footprint applications.
Full-Duplex segment is expected to grow at the fastest CAGR of about 9.23% over 2026-2035 owing to the higher demand of more advanced parameters by industries. Full-duplex bridges work well for applications that need to exchange data in real time, such as robotics and sophisticated instrumentation. Companies such as Microchip Technology are serving that need with the full-duplex interface chips that offer the super-fast bidirectional communication that's essential for mission-critical operations.
By Data Format
8-Bit segment dominated the highest UART-to-SPI Bridge Market share of about 53.38% in 2025 because of its long compatibility with most microcontrollers and sensors. It continues to be the format of choice for low/medium complexity designs. Dedicated supplier, such as Rohm Semiconductor that still supplies the segment with their high performing and low cost 8-bit compatible bridges that are used in a myriad of electronics.
32-Bit segment is expected to grow at the fastest CAGR of about 9.01% from 2026 to 2035 due to the increasing demand for the high-speed data link for modern embedded systems. High data rates enable greater accuracy and responsiveness in next-gen equipment. Firms including STMicroelectronics are breaking new ground with their 32-bit UART-to-SPI bridge technology in the development of more intelligent and faster systems in the medical, automotive and IoT markets.
UART-to-SPI Bridge Market Regional Analysis:
North America UART-to-SPI Bridge Market Trends:
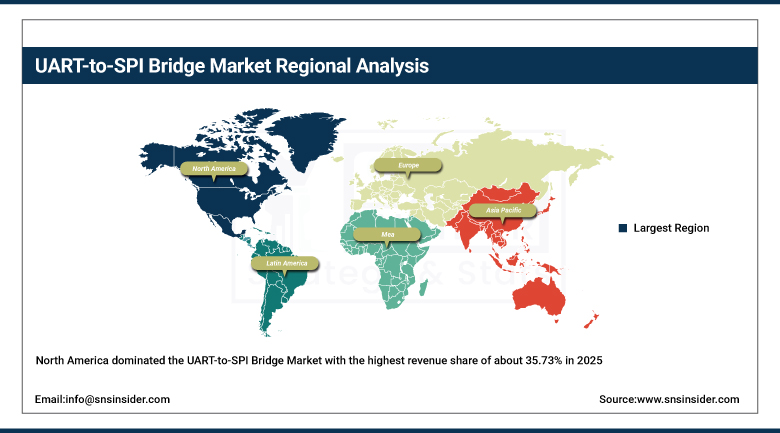
North America dominated the UART-to-SPI Bridge Market with the highest revenue share of about 35.73% in 2025 because of the high penetration of existing semiconductor firms, high-end consumer technology, and early uptake of IoT and industrial automation. The market has strong R&D and an embedded systems culture. Prominent companies, such as Texas Instruments and Microchip Technology have been introducing new and enhanced UART-to-SPI bridge products in North America to help the region sustain its position in the international market.
Get Customized Report as Per Your Business Requirement - Enquiry Now
The U.S. leads the North American UART-to-SPI Bridge Market as it is the largest region of the world’s semiconductor market with the latest technologies, the widespread presence of the leading market players and the early uptake of IoT, automotive electronics and the industrial automation within various applications in the region which propels the market leadership.
Asia-Pacific UART-to-SPI Bridge Market Trends:
Asia Pacific segment is expected to grow at the fastest CAGR of about 9.48% from 2026 to 2035, driven by enhanced electronics production, accelerated industrialization and growing use of smart devices in developing economies, such as China, India, and South Korea. Increasing car electronics and IoT infrastructure will further escalate the demand which includes number of potential consumers around the globe. Proximal manufacturers along with government initiatives and cost advantages have been augmenting the demand for UART to SPI bridge technologies in various domains.
China, owing to its large base for electronics manufacturing, enormous government support to semiconductor industry, increasing smart devices adoption and the presence of a number of OEMs driving the demand for consumer electronics, automotive and industrial, is the leading the Asia Pacific UART to SPI Bridge Market.
Europe UART-to-SPI Bridge Market Trends:
Europe is a major market in the UART-to-SPI Bridge Market, due to its robust automotive and industrial automation industries. Countries including Germany and France are major contributors, propelled by increasing use of embedded systems in electric vehicles and smart manufacturing. The region also enjoys a strong R&D investment and increasing development of energy efficient high-bandwidth communication interfaces by end-user industries.
Germany leads the UART-to-SPI Bridge Market in the European region on account of strong automotive and industrial base, the drive toward Industry 4.0, and the advanced manufacturing technology. The well-developed R&D institutions and prominent semiconductor capability in the country also contribute to its position in the region.
Latin America andMiddle East & Africa UART-to-SPI Bridge Market Trends:
UAE is leading the UART-to-SPI Bridge Market in Middle East & Africa on account of fast smart infrastructural growth along with industrial automation. In Latin America, Brazil dominates the market with well-established electronics manufacturing industry and increasing adoption of IoT solutions for automotive, agriculture, and smart infrastructure use cases in Brazil.
UART-to-SPI Bridge Market Competitive Landscape:
Maxim Integrated (established in 1983, now part of Analog Devices) is a U.S.-based semiconductor company specializing in analog and mixed-signal integrated circuits. It designs high-performance solutions for power management, signal processing, data conversion, and connectivity, serving automotive, industrial, communications, and consumer electronics markets with energy-efficient, reliable, and innovative semiconductor technologies.
-
In 2023, Maxim Integrated introduced the MAX17841B, an automotive SPI communication interface bridging UART and SPI with programmable baud rates, designed for battery management in electric and hybrid vehicles.
FTDI (Future Technology Devices International) (established in 1992) is a UK-based semiconductor company specializing in USB connectivity solutions, including USB-to-serial and UART bridge ICs. The company develops high-performance, reliable interface chips for industrial, automotive, consumer, and embedded applications, enabling seamless communication between microcontrollers, computers, and peripheral devices.
-
In 2024, FTDI released the FT221X and FT220X USB-to-SPI bridge ICs, enabling seamless communication between USB and SPI or UART-like interfaces for versatile serial protocol bridging applications.
UART-to-SPI Bridge Market Key Players:
-
Analog Devices, Inc. (ADI)
-
NXP Semiconductors
-
Microchip Technology Inc.
-
Texas Instruments Incorporated (TI)
-
Maxim Integrated
-
FTDI (Future Technology Devices International)
-
Exar Corporation
-
Silicon Laboratories, Inc.
-
ASMedia Technology Inc.
-
MaxLinear, Inc.
-
Infineon Technologies AG
-
Renesas Electronics Corporation
-
STMicroelectronics
-
ON Semiconductor (onsemi)
-
Broadcom Inc.
-
Toshiba Electronic Devices & Storage Corporation
-
Lattice Semiconductor Corporation
-
Microsemi Corporation (now part of Microchip)
-
Cypress Semiconductor Corporation (now part of Infineon)
-
Diodes Incorporated
| Report Attributes | Details |
|---|---|
| Market Size in 2025 | USD 493.64 Million |
| Market Size by 2035 | USD 1076.64 Million |
| CAGR | CAGR of 8.11% From 2026 to 2035 |
| Base Year | 2025 |
| Forecast Period | 2026-2035 |
| Historical Data | 2022-2024 |
| Report Scope & Coverage | Market Size, Segments Analysis, Competitive Landscape, Regional Analysis, DROC & SWOT Analysis, Forecast Outlook |
| Key Segments | • By Application (Automotive, Consumer Electronics, Industrial, Medical, Networking) • By Bit Rate (Low-Speed (up to 1 Mbps), Medium-Speed (1 Mbps to 10 Mbps), High-Speed (10 Mbps to 100 Mbps)) • By Type (Half-Duplex, Full-Duplex) • By Data Format (8-Bit, 16-Bit, 32-Bit) |
| Regional Analysis/Coverage | North America (US, Canada), Europe (Germany, UK, France, Italy, Spain, Russia, Poland, Rest of Europe), Asia Pacific (China, India, Japan, South Korea, Australia, ASEAN Countries, Rest of Asia Pacific), Middle East & Africa (UAE, Saudi Arabia, Qatar, South Africa, Rest of Middle East & Africa), Latin America (Brazil, Argentina, Mexico, Colombia, Rest of Latin America). |
| Company Profiles | Key players in the UART-to-SPI Bridge market include Analog Devices, Inc. (ADI), NXP Semiconductors, Microchip Technology Inc., Texas Instruments Incorporated, Maxim Integrated, FTDI (Future Technology Devices International), Exar Corporation, Silicon Laboratories, ASMedia Technology Inc., MaxLinear, Inc., Infineon Technologies AG, Renesas Electronics Corporation, STMicroelectronics, ON Semiconductor (onsemi), Broadcom Inc., Toshiba Electronic Devices & Storage Corporation, Lattice Semiconductor Corporation, Microsemi Corporation, Cypress Semiconductor Corporation, and Diodes Incorporate |
Frequently Asked Questions
North America dominated the UART-to-SPI Bridge Market in 2025.
Consumer Electronics segment dominated the UART-to-SPI Bridge Market.
The major growth factor of the UART-to-SPI Bridge Market is the increasing demand for seamless communication between microcontrollers and peripherals in embedded systems.
The UART-to-SPI Bridge Market Size was valued at USD 493.64 Million in 2025 and is expected to reach USD 1076.64 Million by 2035
The UART-to-SPI Bridge Market is expected to grow at a CAGR of 8.11 % from 2026-2035.
Get in Touch
