image

Bag-in-Box Container Market Report Scope & Overview:

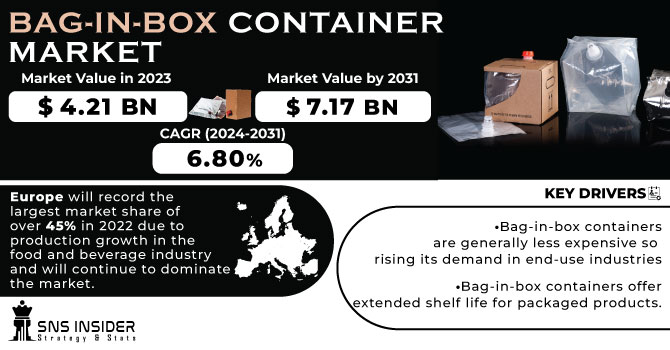
The Bag-in-Box Container Market size was USD 3.95 billion in 2022 and is expected to Reach USD 6.54 billion by 2030 and grow at a CAGR of 6.5% over the forecast period of 2023-2030. 

The growth of the industry is due to increasing demand from various industries such as food and beverages and household products. Increasing consumer preference for packaged natural foods is expected to drive market growth during the forecast period.

Bag-in-Box Container Market Revenue Analysis

Get More Information on Bag-in-Box Container Market - Request Sample Report

Due to the increasing demand for beverages, the market is expected to increase the demand for bag-in-box containers in the food and beverage industry. In 2022, US  generated over $1.2 billion in sales from its organic wine exports. Consumer health concerns and increasing demand for packaged natural and liquid food products are driving the growth of the bag-in-box container products market in the country.

Increasing consumption of bag-in-box containers, especially 3-liter size, by various wine brands is expected to drive the growth of Bag in box containers during the forecast period. In addition, the advantages that containers offer in alcohol packaging have led manufacturers to see increased demand for their products. In addition, the large surface area of ​​bag-in-box containers offers more space and colorful text and graphics than traditional bottle labels, which is expected to drive market growth during the forecast period.

In addition, the development of innovative and unique packaging technology in various segments including soft drinks, food and household segments is expected to drive the market growth. Manufacturers focus on producing eco-friendly packaging using biodegradable plastics materials, which is expected to bring in profits during the forecast period. 

MARKET DYNAMICS

KEY DRIVERS:

  • Bag-in-box containers are generally less expensive so rising its demand in end-use industries

Flexible film bags used in bag-in-box packaging are usually less expensive than rigid packaging materials such as bottles and cans. In addition, these containers take up less storage space and are lighter, which reduces shipping costs. 

  • Bag-in-box containers offer extended shelf life for packaged products.

RESTRAIN:

  • Unavailability of certain raw materials in major restrain

Bag-in-box containers usually require certain types of packing materials such as films, valves and fittings. These materials may be in limited supply or sourced from specific suppliers, which can create material sourcing and cost issues. Reliance on limited supply chains can affect the stability and flexibility of bag-in-box container production lines. 

OPPORTUNITY:

  • Growth of BIB market in other industries can provide growth opportunities

While bag-in-box containers are commonly used in beverages, there are opportunities to expand their application into other industries. The food industry can use bag-in-box containers for sauces, oils, and condiments, while the industry can consider using them for chemicals, detergents, and other liquid products. By opening up new market segments, the market for bag-in-box containers is likely to register significant growth. 

  • The growth of e-commerce and direct-to-consumer channels is creating opportunities for the bag-in-box container market. 

CHALLENGES:

  • Setting up recycling infrastructure is a challenge for industries

Bag-in-box containers are generally recyclable, but recycling infrastructure and processes are not well established in all regions. Collecting, sorting and recycling multi-layer bag-in-box packaging can be challenging. Addressing this challenge requires the development of efficient recycling and waste management systems, especially for bag-in-box containers. 

IMPACT OF RUSSIAN UKRAINE WAR

Due to the conflict, many companies stopped production and business in Russia. For example, Smurfit Kappa has completely exited from Russia. Prices of raw materials such as plastic were increased due to less export of petroleum-related products. The US banned the import of oil from Russia. So crude oil prices went to $100/barrel. Due to this, there was less production which caused the rise of prices at the consumer end.

Polyethylene suppliers and Polypropylene suppliers increased prices by 4 % and again by 6 % due to the high implications of the war on the businesses. Clariant has announced that it will cease business with Russia with immediate effect. Clariant's Russian operations, which include a sales office and laboratory in Moscow, account for approximately 2% of the company's annual turnover. 

IMPACT OF ONGOING RECESSION

Inflation is showing a rise and will affect the overall industry. In June 2022, inflation was at 30 % which has risen to 48 % by 2023. The manufacturing supply chain is getting affected due to the recession which will affect the growth of the market during the recession period.

Plastic resin costs will increase during a recession. Since resin is the main raw material used to manufacture these products, increased spending translates into higher spending and thus higher prices for consumers. This could reduce the demand for plastic and encourage people to look for cheaper alternatives. 

Federal Reserve raised interest rates 7 times during 2022, hence it became difficult for companies to borrow money to finance investments. This could lead to delays in projects and will affect the growth of the market. The plastics industry uses debt to fund processes.

These factors are likely going to affect the Bag in Box container market and its production during the time of recession.

KEY MARKET SEGMENTS

By Material

By Capacity

  • 5 litres

  • 5-10 litres

  • 10-15 litres

  • 15-20 litres

  • More than 20 litres

By Application

Bag-in-Box Container Market Segmentation Analysis

Get Customized Report as per your Business Requirement - Request For Customized Report

REGIONAL ANALYSIS

Europe will record the largest market share of over 45% in 2022 due to production growth in the food and beverage industry and will continue to dominate the market. Changing consumption preferences of consumers, increasing urbanization, and the rising popularity of such packaging solutions are expected to drive market growth during the forecast period. Countries such as Germany, the United Kingdom and Russia are expected to see increased demand from the food industry. Changes in consumer eating habits and a shift towards healthier, organic foods have increased the demand for natural alternatives in food. These factors are expected to increase the demand for bag-in-box container packaging in the food and beverage industry during the forecast period.

Asia-Pacific will  grow at the CAGR of 7.5% during the forecast period 2023-2030, owing to the increase in per capita income accompanying industrialization. Rapid growth of bag-in-box containers in household, food and beverage, and industrial liquid end-use industries is expected to drive the market during the forecast period. Factors such as emerging economies, increasing purchasing power, younger populations, increasing urbanization, growth in fast-moving consumer goods markets, and increased interest in growing bag-in-box health and wellness markets have created significant It is one of the developing regions. container industry during the forecast period.

A growing population and high disposable income make China one of the most important consumer markets for food and beverages in the world. Changes in consumer behavior in China, increased local competition, fragmented distribution, increased dual income, growing interest in health foods, and growing preference for foreign foods have all contributed to the growth of the food and beverage sector. Central and South America has witnessed significant growth in the food and beverage market in recent years, owing to heavy investments in the country's manufacturing sector, due to which there will be impact on the bag-in-box container market. Moreover, increasing urbanization in countries such as Brazil and Argentina and increasing purchasing power of consumers are expected to increase the market share during the forecast period.

Middle Eastern and African countries such as South Africa are among the largest importers of food and beverages. The population growth in the region and the increasing disposable income of consumers are creating a high demand for high-quality organic food. However, the region's manufacturing industry is growing slower than other regions due to its geographical disadvantage and lack of availability of raw materials. Hence this region will show slow growth.

REGIONAL COVERAGE:

North America

  • US

  • Canada

  • Mexico

Europe

  • Eastern Europe

    • Poland

    • Romania

    • Hungary

    • Turkey

    • Rest of Eastern Europe

  • Western Europe

    • Germany

    • France

    • UK

    • Italy

    • Spain

    • Netherlands

    • Switzerland

    • Austria

    • Rest of Western Europe

Asia Pacific

  • China

  • India

  • Japan

  • South Korea

  • Vietnam

  • Singapore

  • Australia

  • Rest of Asia Pacific

Middle East & Africa

  • Middle East

    • UAE

    • Egypt

    • Saudi Arabia

    • Qatar

    • Rest of Middle East

  • Africa

    • Nigeria

    • South Africa

    • Rest of Africa

Latin America

  • Brazil

  • Argentina

  • Colombia

  • Rest of Latin America

Key Players

Some major key players in the Bag-in-Box market are Arlington Packaging (Rental) Limited, Amcor Ltd, DS Smith, CDF Corporation, Optopack Ltd, Aran Group, Hangzhou Hansin New Packing Material Co., Ltd, Central Package & Display, Scholle IPN, Smurfit Kappa and other players.

Amcor Ltd-Company Financial Analysis

Company Landscape Analysis

RECENT DEVELOPMENT

  • Smurfit Kappa, presents its patented Vitop Uno tap for bag-in-box applications. This will be the first on the market with tamper-proof features.

  • Fenton Packaging Solutions, offers UN bag-in-box (BIB) containers as an alternative to traditional rigid liquid packaging. 

Bag-in-Box Container Market Report Scope:
Report Attributes Details
Market Size in 2022  US$ 3.95 Bn
Market Size by 2030  US$ 6.54 Bn
CAGR   CAGR of 6.5 % From 2023 to 2030
Base Year  2022
Forecast Period  2023-2030
Historical Data  2020-2021
Report Scope & Coverage Market Size, Segments Analysis, Competitive  Landscape, Regional Analysis, DROC & SWOT Analysis, Forecast Outlook
Key Segments • By Material (Plastic, Paper & Paperboards, PET, Polyethylene, Metallized Polyester, Others)
• By Capacity (5 litres, 5-10 litres, 10-15 litres, 15-20 litres, More than 20 litres)
• By Application (Household Products, Industrial Liquids, Alcoholic Beverages, Non-Alcoholic Beverages, Others)
Regional Analysis/Coverage North America (US, Canada, Mexico), Europe (Eastern Europe [Poland, Romania, Hungary, Turkey, Rest of Eastern Europe] Western Europe] Germany, France, UK, Italy, Spain, Netherlands, Switzerland, Austria, Rest of Western Europe]). Asia Pacific (China, India, Japan, South Korea, Vietnam, Singapore, Australia, Rest of Asia Pacific), Middle East & Africa (Middle East [UAE, Egypt, Saudi Arabia, Qatar, Rest of Middle East], Africa [Nigeria, South Africa, Rest of Africa], Latin America (Brazil, Argentina, Colombia Rest of Latin America)
Company Profiles Arlington Packaging (Rental) Limited, Amcor Ltd, DS Smith, CDF Corporation, Optopack Ltd, Aran Group, Hangzhou Hansin New Packing Material Co., Ltd, Central Package & Display, Scholle IPN, Smurfit Kappa
Key Drivers • Bag-in-box containers are generally less expensive so rising its demand in end-use industries
• Bag-in-box containers offer extended shelf life for packaged products.
Market Restraints • Unavailability of certain raw materials in major restrain


Frequently Asked Questions

Ans:  Bag-in-Box Container Market is expected to grow at a CAGR of 6.5 %.

Ans: Bag-in-Box Container Market size was USD 3.95 billion in 2022 and is expected to Reach USD 6.54 billion by 2030.

Ans: Bag-in-box containers are generally less expensive so rising its demand in end-use industries.

Ans: Unavailability of certain raw materials in major restrain.

Ans: Europe will record the largest market share of over 45 % in 2022 due to production growth in the food and beverage industry and will continue to dominate the market.

Table of Contents

1. Introduction
1.1 Market Definition
1.2 Scope
1.3 Research Assumptions

2. Research Methodology

3. Market Dynamics
3.1 Drivers
3.2 Restraints
3.3 Opportunities
3.4 Challenges

4. Impact Analysis
4.1 Impact of Russia-Ukraine war
4.2 Impact of Ongoing Recession
4.2.1 Introduction
4.2.2 Impact on major economies
4.2.2.1 US
4.2.2.2 Canada
4.2.2.3 Germany
4.2.2.4 France
4.2.2.5 United Kingdom
4.2.2.6 China
4.2.2.7 Japan
4.2.2.8 South Korea
4.2.2.9 Rest of the World
4.3 Supply Demand Gap Analysis

5. Value Chain Analysis

6. Porter’s 5 forces model

7. PEST Analysis

8. Bag-in-Box Container Market, By Material
8.1 Plastic
8.2 Paper & Paperboards
8.3 PET
8.4 Polyethylene
8.5 Metallized Polyester
8.6 Others

9. Bag-in-Box Container Market By Capacity
9.1 5 litres
9.2 5-10 litres
9.3 10-15 litres
9.4 15-20 litres
9.5 More than 20 litres

10. Bag-in-Box Container Market, By Application
10.1 Household Products
10.2 Industrial Liquids
10.3 Alcoholic Beverages
10.4 Non-Alcoholic Beverages
10.5 Others

11. Regional Analysis
11.1 Introduction
11.2 North America
11.2.1 North America Bag-in-Box Container Market by Country
11.2.2North America Bag-in-Box Container Market by Material
11.2.3 North America Bag-in-Box Container Market by Capacity
11.2.4 North America Bag-in-Box Container Market by Application
11.2.5 USA
11.2.5.1 USA Bag-in-Box Container Market by Material
11.2.5.2 USA Bag-in-Box Container Market by Capacity
11.2.5.3 USA Bag-in-Box Container Market by Application
11.2.6 Canada
11.2.6.1 Canada Bag-in-Box Container Market by Material
11.2.6.2 Canada Bag-in-Box Container Market by Capacity
11.2.6.3 Canada Bag-in-Box Container Market by Application
11.2.7 Mexico
11.2.7.1 Mexico Bag-in-Box Container Market by Material
11.2.7.2 Mexico Bag-in-Box Container Market by Capacity
11.2.7.3 Mexico Bag-in-Box Container Market by Application
11.3 Europe
11.3.1 Eastern Europe
11.3.1.1 Eastern Europe Bag-in-Box Container Market by Country
11.3.1.2 Eastern Europe Bag-in-Box Container Market by Material
11.3.1.3 Eastern Europe Bag-in-Box Container Market by Capacity
11.3.1.4 Eastern Europe Bag-in-Box Container Market by Application
11.3.1.5 Poland
11.3.1.5.1 Poland Bag-in-Box Container Market by Material
11.3.1.5.2 Poland Bag-in-Box Container Market by Capacity
11.3.1.5.3 Poland Bag-in-Box Container Market by Application
11.3.1.6 Romania
11.3.1.6.1 Romania Bag-in-Box Container Market by Material
11.3.1.6.2 Romania Bag-in-Box Container Market by Capacity
11.3.1.6.4 Romania Bag-in-Box Container Market by Application
11.3.1.7 Turkey
11.3.1.7.1 Turkey Bag-in-Box Container Market by Material
11.3.1.7.2 Turkey Bag-in-Box Container Market by Capacity
11.3.1.7.3 Turkey Bag-in-Box Container Market by Application
11.3.1.8 Rest of Eastern Europe
11.3.1.8.1 Rest of Eastern Europe Bag-in-Box Container Market by Material
11.3.1.8.2 Rest of Eastern Europe Bag-in-Box Container Market by Capacity
11.3.1.8.3 Rest of Eastern Europe Bag-in-Box Container Market by Application
11.3.2 Western Europe
11.3.2.1 Western Europe Bag-in-Box Container Market by Country
11.3.2.2 Western Europe Bag-in-Box Container Market by Material
11.3.2.3 Western Europe Bag-in-Box Container Market by Capacity
11.3.2.4 Western Europe Bag-in-Box Container Market by Application
11.3.2.5 Germany
11.3.2.5.1 Germany Bag-in-Box Container Market by Material
11.3.2.5.2 Germany Bag-in-Box Container Market by Capacity
11.3.2.5.3 Germany Bag-in-Box Container Market by Application
11.3.2.6 France
11.3.2.6.1 France Bag-in-Box Container Market by Material
11.3.2.6.2 France Bag-in-Box Container Market by Capacity
11.3.2.6.3 France Bag-in-Box Container Market by Application
11.3.2.7 UK
11.3.2.7.1 UK Bag-in-Box Container Market by Material
11.3.2.7.2 UK Bag-in-Box Container Market by Capacity
11.3.2.7.3 UK Bag-in-Box Container Market by Application
11.3.2.8 Italy
11.3.2.8.1 Italy Bag-in-Box Container Market by Material
11.3.2.8.2 Italy Bag-in-Box Container Market by Capacity
11.3.2.8.3 Italy Bag-in-Box Container Market by Application
11.3.2.9 Spain
11.3.2.9.1 Spain Bag-in-Box Container Market by Material
11.3.2.9.2 Spain Bag-in-Box Container Market by Capacity
11.3.2.9.3 Spain Bag-in-Box Container Market by Application
11.3.2.10 Netherlands
11.3.2.10.1 Netherlands Bag-in-Box Container Market by Material
11.3.2.10.2 Netherlands Bag-in-Box Container Market by Capacity
11.3.2.10.3 Netherlands Bag-in-Box Container Market by Application
11.3.2.11 Switzerland
11.3.2.11.1 Switzerland Bag-in-Box Container Market by Material
11.3.2.11.2 Switzerland Bag-in-Box Container Market by Capacity
11.3.2.11.3 Switzerland Bag-in-Box Container Market by Application
11.3.2.1.12 Austria
11.3.2.12.1 Austria Bag-in-Box Container Market by Material
11.3.2.12.2 Austria Bag-in-Box Container Market by Capacity
11.3.2.12.3 Austria Bag-in-Box Container Market by Application
11.3.2.13 Rest of Western Europe
11.3.2.13.1 Rest of Western Europe Bag-in-Box Container Market by Material
11.3.2.13.2 Rest of Western Europe Bag-in-Box Container Market by Capacity
11.3.2.13.3 Rest of Western Europe Bag-in-Box Container Market by Application
11.4 Asia-Pacific
11.4.1 Asia-Pacific Bag-in-Box Container Market by country
11.4.2 Asia-Pacific Bag-in-Box Container Market by Material
11.4.3 Asia-Pacific Bag-in-Box Container Market by Capacity
11.4.4 Asia-Pacific Bag-in-Box Container Market by Application
11.4.5 China
11.4.5.1 China Bag-in-Box Container Market by Material
11.4.5.2 China Bag-in-Box Container Market by Capacity
11.4.5.3 China Bag-in-Box Container Market by Application
11.4.6 India
11.4.6.1 India Bag-in-Box Container Market by Material
11.4.6.2 India Bag-in-Box Container Market by Capacity
11.4.6.3 India Bag-in-Box Container Market by Application
11.4.7 Japan
11.4.7.1 Japan Bag-in-Box Container Market by Material
11.4.7.2 Japan Bag-in-Box Container Market by Capacity
11.4.7.3 Japan Bag-in-Box Container Market by Application
11.4.8 South Korea
11.4.8.1 South Korea Bag-in-Box Container Market by Material
11.4.8.2 South Korea Bag-in-Box Container Market by Capacity
11.4.8.3 South Korea Bag-in-Box Container Market by Application
11.4.9 Vietnam
11.4.9.1 Vietnam Bag-in-Box Container Market by Material
11.4.9.2 Vietnam Bag-in-Box Container Market by Capacity
11.4.9.3 Vietnam Bag-in-Box Container Market by Application
11.4.10 Singapore
11.4.10.1 Singapore Bag-in-Box Container Market by Material
11.4.10.2 Singapore Bag-in-Box Container Market by Capacity
11.4.10.3 Singapore Bag-in-Box Container Market by Application
11.4.11 Australia
11.4.11.1 Australia Bag-in-Box Container Market by Material
11.4.11.2 Australia Bag-in-Box Container Market by Capacity
11.4.11.3 Australia Bag-in-Box Container Market by Application
11.4.12 Rest of Asia-Pacific
11.4.12.1 Rest of Asia-Pacific Bag-in-Box Container Market by Material
11.4.12.2 Rest of Asia-Pacific Bag-in-Box Container Market by Capacity
11.4.12.3 Rest of Asia-Pacific Bag-in-Box Container Market by Application
11.5 Middle East & Africa
11.5.1 Middle East
11.5.1.1 Middle East Bag-in-Box Container Market by Country
11.5.1.2 Middle East Bag-in-Box Container Market by Material
11.5.1.3 Middle East Bag-in-Box Container Market by Capacity
11.5.1.4 Middle East Bag-in-Box Container Market by Application
11.5.1.5 UAE
11.5.1.5.1 UAE Bag-in-Box Container Market by Material
11.5.1.5.2 UAE Bag-in-Box Container Market by Capacity
11.5.1.5.3 UAE Bag-in-Box Container Market by Application
11.5.1.6 Egypt
11.5.1.6.1 Egypt Bag-in-Box Container Market by Material
11.5.1.6.2 Egypt Bag-in-Box Container Market by Capacity
11.5.1.6.3 Egypt Bag-in-Box Container Market by Application
11.5.1.7 Saudi Arabia
11.5.1.7.1 Saudi Arabia Bag-in-Box Container Market by Material
11.5.1.7.2 Saudi Arabia Bag-in-Box Container Market by Capacity
11.5.1.7.3 Saudi Arabia Bag-in-Box Container Market by Application
11.5.1.8 Qatar
11.5.1.8.1 Qatar Bag-in-Box Container Market by Material
11.5.1.8.2 Qatar Bag-in-Box Container Market by Capacity
11.5.1.8.3 Qatar Bag-in-Box Container Market by Application
11.5.1.9 Rest of Middle East
11.5.1.9.1 Rest of Middle East Bag-in-Box Container Market by Material
11.5.1.9.2 Rest of Middle East Bag-in-Box Container Market by Capacity
11.5.1.9.3 Rest of Middle East Bag-in-Box Container Market by Application
11.5.2 Africa
11.5.2.1 Africa Transfusion Diagnostics Market by Country
11.5.2.2 Africa Bag-in-Box Container Market by Material
11.5.2.3 Africa Bag-in-Box Container Market by Capacity
11.5.2.4 Africa Bag-in-Box Container Market by Application
11.5.2.5 Nigeria
11.5.2.5.1 Nigeria Bag-in-Box Container Market by Material
11.5.2.5.2 Nigeria Bag-in-Box Container Market by Capacity
11.5.2.5.3 Nigeria Bag-in-Box Container Market by Application
11.5.2.6 South Africa
11.5.2.6.1 South Africa Bag-in-Box Container Market by Material
11.5.2.6.2 South Africa Bag-in-Box Container Market by Capacity
11.5.2.6.3 South Africa Bag-in-Box Container Market by Application
11.5.2.7 Rest of Africa
11.5.2.7.1 Rest of Africa Bag-in-Box Container Market by Material
11.5.2.7.2 Rest of Africa Bag-in-Box Container Market by Capacity
11.5.2.7.3 Rest of Africa Bag-in-Box Container Market by Application
11.6 Latin America
11.6.1 Latin America Bag-in-Box Container Market by country
11.6.2 Latin America Bag-in-Box Container Market by Material
11.6.3 Latin America Bag-in-Box Container Market by Capacity
11.6.4 Latin America Bag-in-Box Container Market by Application
11.6.5 Brazil
11.6.5.1 Brazil America Bag-in-Box Container by Material Type
11.6.5.2 Brazil America Bag-in-Box Container by Capacity
11.6.5.3 Brazil America Bag-in-Box Container by Application
11.6.6 Argentina
11.6.6.1 Argentina America Bag-in-Box Container by Material Type
11.6.6.2 Argentina America Bag-in-Box Container by Capacity
11.6.6.3 Argentina America Bag-in-Box Container by Application
11.6.7 Colombia
11.6.7.1 Colombia America Bag-in-Box Container by Material Type
11.6.7.2 Colombia America Bag-in-Box Container by Capacity
11.6.7.3 Colombia America Bag-in-Box Container by Application
11.6.8 Rest of Latin America
11.6.8.1 Rest of Latin America Bag-in-Box Container by Material Type
11.6.8.2 Rest of Latin America Bag-in-Box Container by Capacity
11.6.8.3 Rest of Latin America Bag-in-Box Container by Application

12 Company profile
12.1 Arlington Packaging (Rental) Limited
12.1.1 Company Overview
12.1.2 Financial
12.1.3 Products/ Services Offered
12.1.4 SWOT Analysis
12.1.5 The SNS View
12.2 Amcor Ltd
12.2.1 Company Overview
12.2.2 Financials
12.2.3 Product/Services Offered
12.2.4 SWOT Analysis
12.2.5 The SNS View
12.3 DS Smith
12.3.1 Company Overview
12.3.2 Financials
12.3.3 Product/Services Offered
12.3.4 SWOT Analysis
12.3.5 The SNS View
12.4 CDF Corporation
12.4.1 Company Overview
12.4.2 Financials
12.4.3 Product/Services Offered
12.4.4 SWOT Analysis
12.4.5 The SNS View
12.5 Optopack Ltd
12.5.1 Company Overview
12.5.2 Financials
12.5.3 Product/Services Offered
12.5.4 SWOT Analysis
12.5.5 The SNS View
12.6 Aran Group
12.6.1 Company Overview
12.6.2 Financials
12.6.3 Product/Services Offered
12.6.4 SWOT Analysis
12.6.5 The SNS View
12.7 Hangzhou Hansin New Packing Material Co., Ltd
12.7.1 Company Overview
12.7.2 Financials
12.7.3 Product/Services Offered
12.7.4 SWOT Analysis
12.7.5 The SNS View
12.8 Central Package & Display
12.8.1 Company Overview
12.8.2 Financials
12.8.3 Product/Services Offered
12.8.4 SWOT Analysis
12.8.5 The SNS View
12.9 Scholle IPN
12.9.1 Company Overview
12.9.2 Financials
12.9.3 Product/Services Offered
12.9.4 SWOT Analysis
12.9.5 The SNS View
12.10 Smurfit Kappa
12.10.1 Company Overview
12.10.2 Financials
12.10.3 Product/Services Offered
12.10.4 SWOT Analysis
12.10.5 The SNS View

13. Competitive Landscape
13.1 Competitive Bench marking
13.2 Market Share Analysis
13.3 Recent Developments
13.3.1 Industry News
13.3.2 Company News
13.3.3 Mergers & Acquisitions

14. Use Case and Best Practices

15. Conclusion

An accurate research report requires proper strategizing as well as implementation. There are multiple factors involved in the completion of good and accurate research report and selecting the best methodology to compete the research is the toughest part. Since the research reports we provide play a crucial role in any company’s decision-making process, therefore we at SNS Insider always believe that we should choose the best method which gives us results closer to reality. This allows us to reach at a stage wherein we can provide our clients best and accurate investment to output ratio.

Each report that we prepare takes a timeframe of 350-400 business hours for production. Starting from the selection of titles through a couple of in-depth brain storming session to the final QC process before uploading our titles on our website we dedicate around 350 working hours. The titles are selected based on their current market cap and the foreseen CAGR and growth.


The 5 steps process:

Step 1: Secondary Research:

Secondary Research or Desk Research is as the name suggests is a research process wherein, we collect data through the readily available information. In this process we use various paid and unpaid databases which our team has access to and gather data through the same. This includes examining of listed companies’ annual reports, Journals, SEC filling etc. Apart from this our team has access to various associations across the globe across different industries. Lastly, we have exchange relationships with various university as well as individual libraries.

Secondary Research

Step 2: Primary Research

When we talk about primary research, it is a type of study in which the researchers collect relevant data samples directly, rather than relying on previously collected data.  This type of research is focused on gaining content specific facts that can be sued to solve specific problems. Since the collected data is fresh and first hand therefore it makes the study more accurate and genuine.

We at SNS Insider have divided Primary Research into 2 parts.

Part 1 wherein we interview the KOLs of major players as well as the upcoming ones across various geographic regions. This allows us to have their view over the market scenario and acts as an important tool to come closer to the accurate market numbers. As many as 45 paid and unpaid primary interviews are taken from both the demand and supply side of the industry to make sure we land at an accurate judgement and analysis of the market.

This step involves the triangulation of data wherein our team analyses the interview transcripts, online survey responses and observation of on filed participants. The below mentioned chart should give a better understanding of the part 1 of the primary interview.

Primary Research

Part 2: In this part of primary research the data collected via secondary research and the part 1 of the primary research is validated with the interviews from individual consultants and subject matter experts.

Consultants are those set of people who have at least 12 years of experience and expertise within the industry whereas Subject Matter Experts are those with at least 15 years of experience behind their back within the same space. The data with the help of two main processes i.e., FGDs (Focused Group Discussions) and IDs (Individual Discussions). This gives us a 3rd party nonbiased primary view of the market scenario making it a more dependable one while collation of the data pointers.

Step 3: Data Bank Validation

Once all the information is collected via primary and secondary sources, we run that information for data validation. At our intelligence centre our research heads track a lot of information related to the market which includes the quarterly reports, the daily stock prices, and other relevant information. Our data bank server gets updated every fortnight and that is how the information which we collected using our primary and secondary information is revalidated in real time.

Data Bank Validation

Step 4: QA/QC Process

After all the data collection and validation our team does a final level of quality check and quality assurance to get rid of any unwanted or undesired mistakes. This might include but not limited to getting rid of the any typos, duplication of numbers or missing of any important information. The people involved in this process include technical content writers, research heads and graphics people. Once this process is completed the title gets uploader on our platform for our clients to read it.

Step 5: Final QC/QA Process:

This is the last process and comes when the client has ordered the study. In this process a final QA/QC is done before the study is emailed to the client. Since we believe in giving our clients a good experience of our research studies, therefore, to make sure that we do not lack at our end in any way humanly possible we do a final round of quality check and then dispatch the study to the client.

Start a Conversation

Hi! Click one of our member below to chat on Phone