EdTech and Smart Classrooms Market Key Insights:
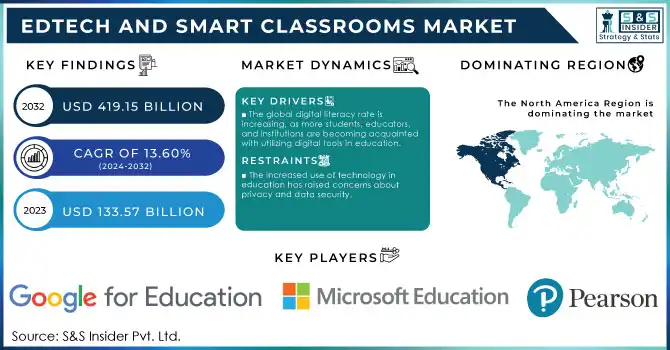
The EdTech and Smart Classrooms Market size was valued at USD 133.57 billion in 2023 and is expected to reach USD 419.15 billion by 2032, growing at a CAGR of 13.60% over the forecast period 2024-2032.
To Get More Information on EdTech and Smart Classrooms Market - Request Sample Report
The EdTech and smart classrooms market has revolutionized the educational landscape, integrating digital technology into learning environments to improve the quality and accessibility of education. A key driver behind the rapid growth of this market is the increasing availability of high-speed internet and the widespread use of mobile devices, which have made digital learning more accessible in various locations for a broader student base. In the U.S., 60% of teachers have already incorporated AI in classrooms, and 65% of undergraduates believe AI in education enhances learning outcomes. AI-driven companies like China’s Squirrel AI are booming, with a 473% increase in search volume over the past five years. Squirrel AI personalizes lessons based on data from over 24 million learners, helping students achieve better results. In the higher education sector, chatbots like Ivy.ai have become essential tools for administrative support, now being used by over 800 institutions and achieving a 97% customer retention rate. Meanwhile, the rise of homeschooling—now at 6.7% of U.S. school-aged children—has further fueled the demand for tech-enabled online learning platforms. This growing investment is especially vital in emerging economies, where EdTech can help bridge the educational gap and prepare students for a digitally-driven workforce.
In the corporate sector, EdTech is transforming employee training by offering scalable, flexible, and remote learning opportunities. Companies are increasingly relying on online courses, virtual workshops, and simulation-based training to upskill employees efficiently. Corporate EdTech solutions have become a leading strategy for workforce skill development, addressing the challenges of traditional training methods. A staggering 75% of companies now view digital learning as their preferred method for employee upskilling. This approach not only reduces costs associated with in-person training but also provides employees with greater flexibility to learn at their own pace. Smart classrooms in corporate settings, equipped with interactive boards and cloud-based platforms, further enhance collaborative learning during training sessions, boosting engagement and retention.
Market Dynamics
Drivers
- The global digital literacy rate is increasing, as more students, educators, and institutions are becoming acquainted with utilizing digital tools in education.
Educational institutions are progressively incorporating e-learning resources such as interactive whiteboards, digital textbooks, online quizzes, and learning management systems (LMS), which enhance a more engaging and interactive educational experience. The increase in smartphones, tablets, and computers among students has also facilitated the adoption of EdTech solutions by educational institutions. The combination of cloud computing and internet connectivity has made learning management systems crucial for remote education, allowing education to persist no matter the geographical location. Moreover, digital literacy programs spearheaded by governments and educational organizations are crucial for providing educators and learners with the competencies required to fully utilize EdTech resources. For example, nations such as Finland and Singapore have historically led the way in incorporating technology into education, while other areas are starting to do the same to guarantee that students are ready for a digital future. As technology advances, the EdTech market is projected to keep expanding, with emerging innovations providing new chances to enhance how students learn and engage with educational materials.
- Government backing and financial support for digital education projects have greatly aided the growth of the EdTech and smart classroom sector.
Numerous governments have acknowledged the possibilities of technology in improving education and are investing significantly in the infrastructure needed to deploy digital learning solutions. This encompasses funding the creation of smart classrooms, offering grants and subsidies for schools to acquire devices, and supporting research to investigate cutting-edge educational technologies. The Indian government's "Digital India" initiative, for instance, seeks to enhance digital education by introducing smart classrooms, digital textbooks, and e-learning platforms in schools located in both rural and urban regions. Likewise, in the United States, initiatives such as the "E-rate" program offer discounts to educational institutions for acquiring educational technology. These initiatives address financial obstacles, guaranteeing that educational institutions can access the most recent EdTech innovations. These initiatives have sped up the embrace of EdTech and intelligent classrooms, increasing the need for sophisticated educational technology solutions that support both in-person and online learning experiences.
Restraints
- The increased use of technology in education has raised concerns about privacy and data security.
With the adoption of digital platforms and smart devices in classrooms, vast amounts of student data are being collected, stored, and processed. This data includes personal information, academic performance, and behavioral patterns. If not properly managed, this data could be vulnerable to breaches, misuse, or unauthorized access, posing a risk to students’ privacy. Educational institutions must adhere to strict regulations and security measures to ensure the protection of this sensitive data. However, smaller institutions may lack the resources to implement adequate security protocols, making them more vulnerable to cyber threats. The rise in cyberattacks on educational institutions and the growing concerns about data privacy have prompted calls for stronger regulations and more robust cybersecurity measures.
Key Segmentation Analysis
By Hardware
Interactive Displays dominated the market in 2023 with a 55% market share because of their ability to captivate students via both visual and hands-on interaction. Interactive screens are high-resolution touch interfaces that enable students and teachers to engage with digital material instantly, promoting teamwork and immersive educational experiences. These screens work effortlessly with educational software, establishing them as a favored resource for various subjects, including math, science, and the arts. Educational establishments are progressively allocating resources to these instruments for classrooms, aiming to enhance active involvement, boost student engagement, and promote interactive instruction.
Interactive Projectors are projected to grow at a faster CAGR during 2024-2032, providing a flexible and more economical alternative to conventional interactive screens. These projectors turn any surface into a dynamic learning environment, enabling students to engage with projected material using specific pens, touch, or gestures. Epson and BenQ are key competitors in this market, providing interactive projectors tailored for education, and equipped with functionalities like split-screen and multi-touch options. These projectors allow teachers to actively engage students in lessons, fostering a dynamic and adaptable learning atmosphere without requiring a specific screen.
By Deployment
In 2023, cloud deployment led the market, holding a 57% market share. This trend indicates the increasing need for convenient and adaptable learning options. Cloud-based EdTech provides scalability, accessibility, and lower hardware expenses, rendering it especially appealing for educational organizations looking to enhance digital learning opportunities. Notable firms providing cloud-driven EdTech services are Google Classroom and Microsoft Teams, facilitating collaboration, online classes, and engaging learning spaces that can be easily expanded across districts or organizations. The integration of artificial intelligence and machine learning also supports cloud deployment by improving the learning process through real-time insights and feedback, making it suitable for adaptive learning applications.
On-premises deployment is expected to experience the fastest growth rate during 2024-2032. Educational institutions like schools or universities that have strict data privacy demands or restricted internet connectivity often prefer this choice since it enables complete management of software updates, data storage, and network settings. Leading firms providing on-premises solutions include SMART Technologies with their SMART Learning Suite and Promethean, which offer interactive displays and software tailored for educational environments. On-site implementations are advantageous for organizations with intricate IT setups, providing direct management of technology in the classroom and offline availability of digital resources.
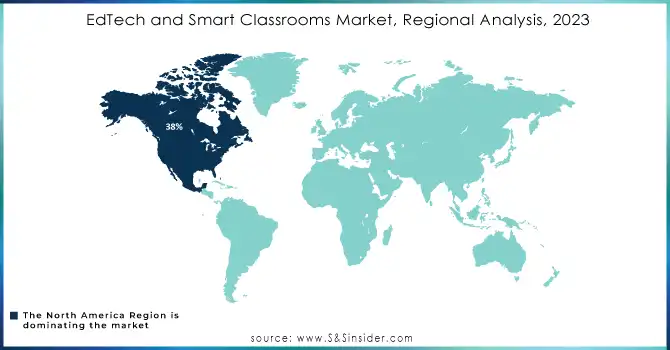
Regional Analysis
In 2023, North America dominated the EdTech and Smart Classrooms Market, holding a 38% market share, mainly because of its sophisticated infrastructure, considerable funding in educational technology, and prompt embrace of digital learning platforms. Major companies such as Google, Microsoft, and Apple have a significant presence in this area, offering platforms like Google Classroom, Microsoft Teams for Education, and Apple's iPad-oriented educational tools. Educational institutions, including universities and K-12 schools in the U.S. and Canada, often adopt these EdTech solutions to facilitate hybrid learning settings, remote access, and streamlined educational administration.
The APAC region is anticipated to experience the most rapid growth rate in the edtech and smart classrooms market between 2024 and 2032, fueled by heightened investments in digital education, a growing need for online learning, and government efforts to incorporate technology into conventional education. Nations such as China, India, and South Korea are undergoing swift digitization, aided by inexpensive internet connectivity and prevalent smartphone adoption. Prominent firms like BYJUS in India and Tencent Classroom in China have effectively customized educational solutions for various linguistic and cultural requirements, offering applications for online tutoring, exam preparation, and language acquisition.
Do You Need any Customization Research on EdTech and Smart Classrooms Market - Inquire Now
Key Players
The major key players in the EdTech and Smart Classrooms Market are:
-
Google for Education (Google Classroom, Google Workspace for Education)
-
Microsoft Education (Microsoft Teams for Education, Minecraft: Education Edition)
-
Apple Education (Apple School Manager, Classroom App)
-
Pearson (Revel, MyLab)
-
Coursera (Coursera for Campus, Guided Projects)
-
Udemy (Udemy Business, Udemy Labs)
-
BYJU’S (BYJU'S Learning App, Disney BYJU'S Early Learn)
-
Kahoot! (Kahoot! EDU, Kahoot! for Schools)
-
Blackboard (Blackboard Learn, Blackboard Collaborate)
-
Canvas by Instructure (Canvas LMS, Canvas Studio)
-
2U, Inc. (edX Online Campus, Boot Camps)
-
Skillsoft (Percipio, Skillsoft Learning Experience Platform)
-
DreamBox Learning (DreamBox Math, Reading Plus)
-
Nearpod (Nearpod VR, Nearpod Collaborate Board)
-
Promethean (ActivPanel, ActivInspire)
-
SMART Technologies (SMART Board, SMART Learning Suite)
-
Edmodo (Edmodo Classroom, Edmodo Spotlight)
-
Seesaw (Seesaw Learning Journal, Seesaw for Schools)
-
Chegg (Chegg Study, Chegg Math Solver)
-
Duolingo (Duolingo for Schools, Duolingo Events)
Providers of EdTech and Smart Classroom Components:
-
Intel (hardware and software components)
-
Qualcomm (hardware for interactive devices)
-
Amazon Web Services (AWS) (cloud storage and AI integration)
-
Zoom Video Communications (Zoom SDK for EdTech integrations)
-
Cisco Systems (Cisco Webex, networking components)
-
Adobe Systems (Adobe Captivate, eLearning software)
-
HP Inc. (interactive hardware and printing solutions)
-
Logitech (cameras and smart classroom accessories)
-
NVIDIA (AI processors for smart learning applications)
-
Lenovo (tablets, laptops, and interactive devices)
Recent Developments
-
January 2024: Google revealed several new capabilities for classroom management, accessibility, and AI-driven tools for generating questions and lesson plans at the Bett ed-tech event in the UK.
-
October 2024: Udemy a prominent online platform for skills and learning, unveiled a new range of AI features to assist organizations in developing more engaging and tailored learning initiatives on a large scale.
-
September 2024: Coursera, the online learning platform and a leader in Massive Open Online Courses, revealed today that it’s initiating a significant expansion of its offerings. The growth encompasses over twenty certificate programs and specializations, emphasizing generative AI.
| Report Attributes | Details |
|---|---|
| Market Size in 2023 | USD 133.57 Billion |
| Market Size by 2032 | USD 419.15 Billion |
| CAGR | CAGR of 13.60% From 2024 to 2032 |
| Base Year | 2023 |
| Forecast Period | 2024-2032 |
| Historical Data | 2020-2022 |
| Report Scope & Coverage | Market Size, Segments Analysis, Competitive Landscape, Regional Analysis, DROC & SWOT Analysis, Forecast Outlook |
| Key Segments | • By Hardware (Interactive Displays, Interactive Projectors) • By Education System (Learning Management System, Student Information and Administration System, Student Collaboration System, Student Response System, Learning and Gamification, Test Preparation, Classroom Management System, Document Management System, Talent Management System) • By End User (K-12, Higher Education) • By Deployment (Cloud, On-Premises) |
| Regional Analysis/Coverage | North America (US, Canada, Mexico), Europe (Eastern Europe [Poland, Romania, Hungary, Turkey, Rest of Eastern Europe] Western Europe] Germany, France, UK, Italy, Spain, Netherlands, Switzerland, Austria, Rest of Western Europe]), Asia Pacific (China, India, Japan, South Korea, Vietnam, Singapore, Australia, Rest of Asia Pacific), Middle East & Africa (Middle East [UAE, Egypt, Saudi Arabia, Qatar, Rest of Middle East], Africa [Nigeria, South Africa, Rest of Africa], Latin America (Brazil, Argentina, Colombia, Rest of Latin America) |
| Company Profiles | Google for Education, Microsoft Education, Apple Education, Pearson, Coursera, Udemy, BYJU’S, Kahoot!, Blackboard, Canvas by Instructure, 2U, Inc., Skillsoft, DreamBox Learning, Nearpod, Promethean, SMART Technologies, Edmodo, Seesaw, Chegg, Duolingo |
| Key Drivers | • The global digital literacy rate is increasing, as more students, educators, and institutions are becoming acquainted with utilizing digital tools in education. • Government backing and financial support for digital education projects have greatly aided the growth of the EdTech and smart classroom sector. |
| RESTRAINTS | • The increased use of technology in education has raised concerns about privacy and data security. |
Get in Touch
