Embedded Hypervisor Market Report Scope & Overview:
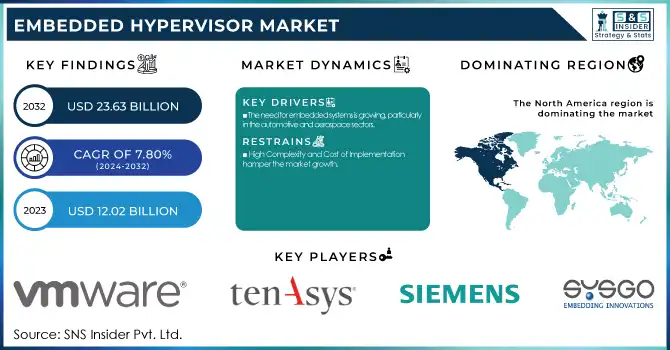
The Embedded Hypervisor Market Size was valued at USD 12.02 Billion in 2023. It is expected to grow to USD 23.63 Billion by 2032 and grow at a CAGR of 7.80% over the forecast period of 2024-2032.
The increasing use of IoT devices and edge computing solutions is greatly propelling the necessity for embedded hypervisor products. IoT devices work for various applications starting from the smart home, industrial, automotive, and other devices, but hosting all these applications on one device needs a solution to decode this complexity. In this regard, they also have an increasingly essential role played by embedded hypervisors that make the virtualization of the resources within the IoT devices. Hypervisors permit distinct applications or systems to run inside a virtual situation and remain autonomous of each other at the equipment level, making them function together without disturbing one another. This is necessary to ensure that the most important applications, such as security-related applications and real-time data processing, can run without compromising system safety and stability.
Governments worldwide are heavily investing in IoT infrastructure as part of their digital transformation strategies. For instance, the European Union's Digital Compass 2030 initiative aims to significantly expand the use of IoT technologies across various sectors, including transportation, healthcare, and agriculture, by 2030.
Embedded Hypervisor Market Size and Forecast:
-
Market Size in 2023: USD 12.02 Billion
-
Market Size by 2032: USD 23.63 Billion
-
CAGR: 7.80% from 2024 to 2032
-
Base Year: 2023
-
Forecast Period: 2024–2032
-
Historical Data: 2020–2022
To Get More Information on Embedded Hypervisor Market - Request Sample Report
Embedded Hypervisor Market Trends:
-
Increasing adoption of embedded virtualization in automotive and aerospace systems
-
Rapid expansion of IoT networks and connected devices driving hypervisor deployment
-
Growing demand for secure multi-OS environments in resource-constrained embedded systems
-
Rising integration of hypervisors in autonomous vehicles and ADAS platforms
-
Strong focus on real-time system isolation for safety-critical applications
-
Accelerating use of embedded hypervisors in edge computing and industrial IoT
In recent years, the new trend of demanding virtualization in embedded systems is due to the necessity of consensus around making systems more efficient, more performant, and more secure irrespective of increasing complexity across various application domains. Embedded systems are vital in applications like automotive, aerospace, healthcare, and industrial automation, where resource optimization is a must. Its virtualization allows multiple OS to run on a single HW platform simultaneously meaning that an embedded system can perform multiple different tasks in isolation at the same time. This allows for maximizing the use of the hardware resources, meaning that one does not require multiple physical devices, which, translates to lower costs, and simplified hardware management.
In the automotive sector, the U.S. National Highway Traffic Safety Administration (NHTSA) emphasizes the use of embedded systems in autonomous vehicles. Virtualization in these systems helps manage multiple functions, such as navigation, safety, and vehicle control, on a single platform. According to the U.S. Department of Transportation (DOT), the U.S. government expects the number of connected vehicles to increase significantly, with over 50 million connected cars on U.S. roads by 2030.
Embedded Hypervisor Market Dynamics
Drivers
-
The need for embedded systems is growing, particularly in the automotive and aerospace sectors.
-
Rising demand for cloud-based services and virtualization.
-
Expansion of the Internet of Things (IoT) and connected devices drives the market growth.
Increasing adoption of Internet of Things (IoT) solutions and connected devices are some of the major growth factors for the market of embedded hypervisors. The proliferation of IoT networks in fields like healthcare, automotive, smart cities, and industrial automation, has made the need for a secure and efficient method of managing these connected devices imperative. Most IoT devices work in resource-constrained environments and to allow multiple functions to run at the same time, they have to make optimum use of hardware resources. This is made possible by hypervisors that, when embedded, will virtualize the hardware so that two or more OSes or applications can run at the same time and API calls made by one do not affect another. By doing this virtualization, the system makes the best use of its resources cuts down hardware overhead costs, and boosts performance. Moreover, considering that IoT networks need to transmit sensitive data, embedded hypervisors also provide critical application isolation and protection, thus providing a protection boundary for some critical applications from potential cybersecurity threats. As the number of connected devices continues to grow exponentially, the requirement for embedded hypervisors to allow smooth and secure working is pushing the market growth through this vertical for the industries.
Restraint
-
High Complexity and Cost of Implementation hamper the market growth.
The complexity and high costs associated with the implementation of embedded hypervisor technology act as major restraint, limiting the growth of the market. Embedded hypervisors cannot be simply integrated in systems they already are; thus, they require a significant investment in the relevant hardware and software which needs to be provided by expertise consumer partners to these processors. The hypervisor, hardware and different OSs (which run on the platform) have to be able to communicate and work together through this layer, which creates this complexity. In industries such as automotive, healthcare, and aerospace that rely on highly special-purpose and mission-critical embedded systems, existing infrastructure is not easily convertible to a virtualization capability and the effort may also be large.
Opportunities
-
There are abundant opportunities in emerging sectors such as healthcare, edge computing, automotive electronics, and industrial IoT.
-
The emergence of new applications, such as autonomous vehicles, smart grids, and medical implants, has revolutionized various industries.
-
Advancements in processor technology have played a crucial role in driving these technological developments.
Embedded Hypervisor Market Segmentation
By Component
Software held the largest market share around 68% in 2023. The software plays a vital role as an enabler for the virtualization of these Embedded systems. Software hypervisors enable running multiple OSes or apps simultaneously on a single hardware platform, enhancing resource allocation, security, and flexibility, without requiring without requiring more hardware. Their versatility is invaluable in industries like automotive, aerospace, and telecommunications, where an embedded system must perform complex tasks while offering cost and performance optimization. Another reason that hypervisors can operate as software instead of hardware solutions is that they are much easier to update and change, so they are more scalable and can adapt to changing technological needs.
By Enterprise Size
The Large enterprises model held the largest market share around 58% in 2023. It is owing as they offer more resources, and operations on a larger scale, and demand more advanced embedded virtualization solutions. Large enterprises in industries such as automotive, aerospace, telecommunications, and healthcare need powerful, secure, and scalable embedded systems to support their complex applications and business operations. Such enterprises generally possess the financial and technical prowess to deploy embedded hypervisor solutions that reduce resource footprint, improve system performance, and enhance system-wide security. Reacting in most cases, large organizations also work in high regulated and effective industries, like healthcare and defense; embedded hypervisors have a significant impact in these situations for reasonably protecting data and ensuring authentication.
By Application
The automotive sector accounted for the largest market share around 32% in 2023. The explosive growth in connected, autonomous, and electric vehicles led the automotive industry to rapidly adopt embedded hypervisor technology to meet demand for the growing complexity of modern vehicles. Embedded hypervisors allow multiple OS to run at the same time on a single hardware platform without interference, so the OEM can easily combine functions such as infotainment system, ADAS, and autonomous driving functions. Such technology also allows for optimized resource allocation, better system performance and increased security by separating mission critical functions from the non-mission critical ones. Moreover, as automotive makers strive to ensure compliance with stringent safety and regulatory requirements, the embedded hypervisors manage integrated yet complex networks of sensors, cameras, and control units, making them a keystone for next generation automotive developments. As the largest market segment, the automotive industry has led the market adoption of embedded hypervisors and continues to drive investment in IoT, electrification, and automation.
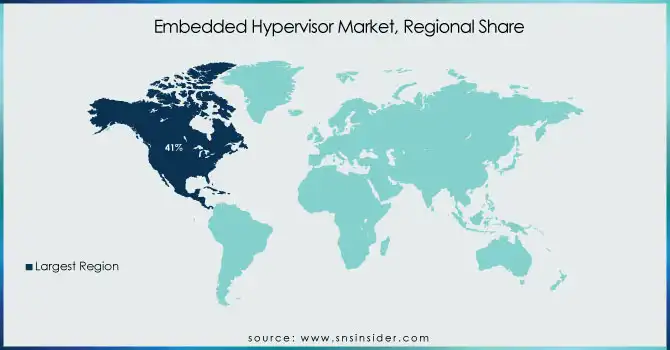
Embedded Hypervisor Market Regional Overview
North America region held the largest market share around 41% in 2023. This is owing to owing to the factors such as, superior technological infrastructure, extensive R&D investment, and high concentration of industrial leaders in verticals (automobile, aerospace, defense, and telecommunications) across the U.S. Home to some of the leading automotive manufacturers and tech companies pushing forward autonomous vehicles, smart transportation systems and connected devices, all rooted in embedded hypervisor technology. Moreover, North America has a strong defense and aerospace industry which require high levels of security, reliability, and system performance from embedded systems, further fueling the adoption of virtualization technologies. Digital modernization of U.S. government agencies, and acts such as the National Defense Authorization Act (NDAA) that promote the inclusion of advanced technologies in defense systems, will consolidate the growth of the embedded hypervisors market. Moreover, the increasing adoption of digital transformation in different sectors, keeping in mind the fast-growing IoT landscape in the region, is also fueling the hypervisor solution market to include complex connected networks of devices. North America continues to be the major region for the embedded hypervisor because of its better regulatory environment, heavy technological investment, and the presence of several key industry players.
Do You Need any Customization Research on Embedded Hypervisor Market - Enquire Now
Key Players in Embedded Hypervisor Market
-
VMware, Inc. (VMware vSphere, VMware Workstation)
-
TenAsys Corporation (INTEGRITY RTOS, iRMX Real-Time Operating System)
-
IBM Corporation (IBM PowerVM, IBM z/VM)
-
Siemens EDA (Mentor Embedded Hypervisor, Veloce Emulation Platform)
-
QNX Software Systems Limited (QNX Neutrino RTOS, QNX Hypervisor)
-
WindRiver Systems, Inc. (VxWorks, Wind River Linux)
-
SYSGO AG (PikeOS, ELinOS Linux)
-
ENEA (Enea OSE, Enea Linux)
-
Lynx Software Technologies, Inc. (LynxOS, LynxSecure)
-
Acontis Technologies GmbH (Xenomai, EtherCAT Master)
-
Citrix Systems, Inc. (Citrix Hypervisor, Citrix Virtual Apps and Desktops)
-
Proxmox Server Solutions GmbH (Proxmox Virtual Environment, Proxmox Backup Server)
-
Microsoft Corporation (Hyper-V, Windows Server)
-
Green Hills Software (INTEGRITY RTOS, MULTI IDE)
-
Sierraware (Sierra Hypervisor, Sierra Secure Virtualization)
-
Acontis Technologies GmbH (Xenomai, EtherCAT Master)
-
KUKA AG (KUKA.Safe Operation, KUKA.System Software)
-
Red Hat, Inc. (Red Hat Enterprise Linux, Red Hat Virtualization)
-
Fujitsu Limited (Fujitsu Cloud Hypervisor, Fujitsu Virtualization Platform)
-
Aricent (now part of Altran) (Virtualization Solutions, Embedded Software Solutions)
Recent Development:
-
In 2024, VMware, Inc. launched VMware vSphere 8, enhancing its embedded hypervisor capabilities for edge computing and IoT applications, providing improved security, scalability, and resource management for embedded systems in sectors like automotive and telecommunications.
-
In 2023, TenAsys Corporation released a new version of its INTEGRITY RTOS with enhanced support for virtualization in embedded systems, offering improved safety and security for critical industries like aerospace and automotive.
-
In 2023, QNX Software Systems Limited enhanced its QNX Hypervisor by adding new features for virtualized safety-critical applications, improving support for ISO 26262 compliance in automotive and aerospace systems.
| Report Attributes | Details |
| Market Size in 2023 | US$ 12.02 Billion |
| Market Size by 2032 | US$ 23.63 Billion |
| CAGR | CAGR of 7.8% From 2024 to 2032 |
| Base Year | 2023 |
| Forecast Period | 2024-2032 |
| Historical Data | 2020-2022 |
| Report Scope & Coverage | Market Size, Segments Analysis, Competitive Landscape, Regional Analysis, DROC & SWOT Analysis, Forecast Outlook |
| Key Segments | • By Component (Services, Software) • By Enterprise Size (Small & Medium Enterprises (SMEs), Large Enterprises) • By Technology (Desktop Virtualization, Server Virtualization, Data Center Virtualization) • By Application (IT & Telecommunications, Automotive, Aerospace & Defense, Industrial, Transportation, Others) |
| Regional Analysis/Coverage | North America (US, Canada, Mexico), Europe (Eastern Europe [Poland, Romania, Hungary, Turkey, Rest of Eastern Europe] Western Europe [Germany, France, UK, Italy, Spain, Netherlands, Switzerland, Austria, Rest of Western Europe]), Asia Pacific (China, India, Japan, South Korea, Vietnam, Singapore, Australia, Rest of Asia Pacific), Middle East & Africa (Middle East [UAE, Egypt, Saudi Arabia, Qatar, Rest of Middle East], Africa [Nigeria, South Africa, Rest of Africa], Latin America (Brazil, Argentina, Colombia Rest of Latin America) |
| Company Profiles | VMware, Inc., TenAsys Corporation, IBM Corporation, Siemens EDA, QNX Software Systems Limited, WindRiver Systems, Inc., SYSGO AG, ENEA, Lynx Software Technologies, Inc., Acontis Technologies GmbH, Citrix Systems, Inc., Proxmox Server Solutions GmbH, Microsoft Corporation, Green Hills Software, Sierraware, Acontis Technologies GmbH |
Frequently Asked Questions
Ans: The Embedded Hypervisor Market is expected to grow at a CAGR of 7.80% during 2024–2032.
Ans: The market was valued at USD 12.02 Billion in 2023 and is expected to reach USD 23.63 Billion by 2032.
Ans: Key drivers include the rapid expansion of IoT and connected devices, increasing demand for secure multi-OS environments, rising adoption in automotive and aerospace sectors, growth in edge computing, and the need for real-time system isolation in safety-critical applications.
Ans: The Software component segment dominated the market in 2023, accounting for around 68% share.
Ans: North America dominated the Embedded Hypervisor Market in 2023, holding around 41% market share.
Get in Touch
