Get More Information on Offshore Lubricants Market - Request Sample Report
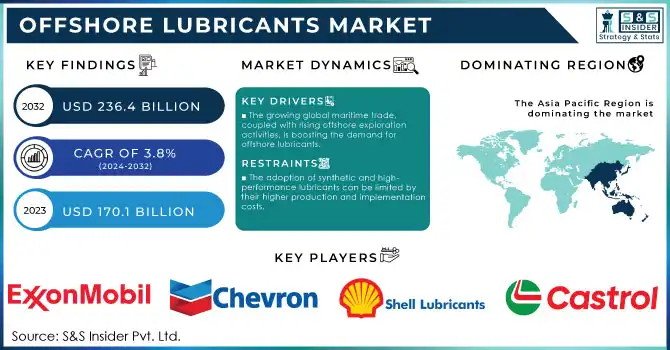
The Offshore Lubricants Market Size was valued at USD 170.1 Billion in 2023 and will reach USD 236.4 billion by 2032, growing at a CAGR of 3.8% over the forecast period of 2024-2032.
Growth of the offshore lubricants market is primarily attributed to increased energy exploration and production activities in offshore environments, complemented by rapid growth of oil and gas operations in deepwater and ultra-deepwater areas. As per the global offshore production forecast by the International Energy Agency (IEA), global offshore oil production will grow significant growth rate, providing a substantial opportunity for high-performance lubricants in various offshore applications. The global energy shift toward offshore sources has led governments and regulatory bodies worldwide to focus on sustainable offshore energy production. For instance, the U.S. Energy Information Administration (EIA) reported in 2023 that U.S. offshore oil production accounted for 16% of the total domestic oil output, with the Gulf of Mexico being a critical area for offshore production. Consequently, there has been an increase in the need for the development and use of lubricants that are not only able to survive extreme conditions found offshore, e.g., high temperature, high-pressure, and salinity, and also guarantee the fluctuation-free operation of devices employed in offshore oil rigs, support vessels, and subsea machines. In addition, restrictions imposed by several government-aided programs such as the Green Deal by the European Union and regulations imposed by the U.S. Bureau of Safety and Environmental Enforcement (BSEE), have focused on enhancing operational efficiency and reducing impact on the environment, thereby indirectly subjecting utilization of targeted type of lubricants in offshore energy production.
Increasing offshore oil and gas exploration, especially in offshore regions like the Gulf of Mexico, Arabian Sea, Caspian, and Red Sea, is expected to drive the offshore lubricants market. One significant factor is that there is an increasing demand for lubricants to minimize costs and increase the fitness of the tool. Moreover, increased demand from shipping & offshore sectors for environment-friendly lubricants also propelled demand for the market. To produce sustainable and non-toxic products, manufacturers are putting their focus on bio-based raw materials to manufacture bio-lubricants containing non-toxic and non-volatile compounds, and gases as well. In addition, growth in industrial need for bio-based and energy-efficient lubricants especially in developed economies is projected to boost the growth of the market.
Drivers
The growing global maritime trade, coupled with rising offshore exploration activities, is boosting the demand for offshore lubricants.
The development of synthetic and biodegradable lubricants that can withstand extreme offshore conditions is driving market growth.
Stronger environmental regulations promoting eco-friendly lubricants, such as bio-based oils, are pushing the market toward sustainable solutions.
The Offshore Lubricants Market is experiencing growth due to increasing maritime traffic which is one of the significant factors driving the demand for offshore lubricants. With world trade growing, the demand for safe and efficient lubrication solutions on marine ships and offshore has also increased. In 2023, global maritime trade volumes were estimated to have grown by approximately 4.3%, with the International Maritime Organization (IMO) projecting continued growth in shipping traffic through 2024. This surge is attributed to several factors, including the world recovering from the coronavirus pandemic and higher consumer demand. Consequently, as shipping traffic increases, so does the demand for marine lubricants, particularly for offshore operations like deep-water drilling and wind energy platforms.
For example, offshore rigs require lubricants that can withstand extreme temperatures, pressure, and saline environments. With increasing marine activities, such as oil and gas exploration and the development of renewable energy projects like offshore wind farms, the demand for high-performance lubricants is further intensified. Moreover, as shipping activities continue to surge, the demand for bio-based lubricants is further propelled by escalating maritime environmental regulations that require the use of eco-friendly lubricants. The transition to bio-based lubricants and synthetic oils helps reduce the environmental impact, providing an added incentive for the industry to adopt advanced lubricant solutions.
Restraints:
Despite the demand for greener products, the disposal and management of offshore lubricants under strict environmental regulations can hinder market growth.
The adoption of synthetic and high-performance lubricants can be limited by their higher production and implementation costs.
High cost of advanced lubricants as a significant restraint in the offshore lubricants market. Synthetic and particularly high-performance lubricants require complex manufacturing processes to withstand the harsh environment in offshore locations. These lubricants usually necessitate costly raw materials and advanced technology, resulting in higher costs compared to conventional alternatives. The production cost is also further hiked due to the product formulation of eco-friendly lubricants and biodegradable formulations, as a result of strict market regulations. For many companies especially smaller companies and those in cost-sensitive industries, this price premium represents a large barrier, as it impedes their ability to make the initial investment and the ongoing purchasing expense. This can be especially detrimental in offshore environments such as oil and gas, where the pressure on operational budgets is to keep things efficient and cost-effective.
By Application
The engine oil segment held a 71% share of the global offshore lubricants market revenue in 2023. Engine oils are essential for offshore vessels, machinery, and equipment to provide smooth engine running, improve fuel economy, and reduce wear and abrasion under severe marine conditions. The superiority of engine oil is credited to its vast application in offshore operations ranging from offshore drilling rigs, support vessels, and marine transport. In addition, there is rising use of high-performance engine oils due to stringent government regulations and updated lubricant formulations. Continued growth in offshore exploration and production activity, especially in high-demand areas like the North Sea, the Gulf of Mexico, and offshore fields in Brazil, is aiding the steady growth of the engine oil market.
On the other hand, the fastest growth over the forecast period is expected to be witnessed in the gear oil segment. Gear oils are critical in offshore drilling, vessels, and subsea operations with high torque and heavy loads requiring lubrication. Gear oil consumption is likely to rise due to increasing demand for offshore support vessels (OSVs) and the growing exploration of deepwater reserves. Gear oils is one of the fastest growing segments driven by the increasing complexity of offshore equipment, and the requirement for specialized lubricants that can withstand extreme conditions such as high loads and thermal stresses. Also, government regulations focusing on the stability and sustainability of offshore operations have further driven the demand for effective and strong gear oils operating in extreme settings. As the offshore sector expands, the demand for gear oils, especially those that offer superior protection against wear, corrosion, and heat, is set to rise significantly.
By End Use
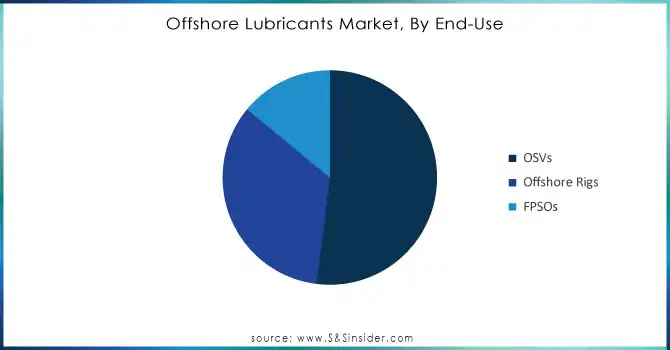
The offshore lubricants market was led by the Offshore Support Vessels (OSVs) segment which accounted for 52% of the market share in 2023. Offshore support vessels play a key role in offshore oil and gas Exploration and Production (EP) activities due to their role in transporting and supplying different types of support vessels for crew logistics jobs. With the increase in offshore projects especially in oil-rich regions such as the North Sea and offshore fields in the Middle East, the number of OSV is rapidly increasing leading to the increasing demand for lubricants used in these vessels. The worldwide fleet of offshore support vessels (OSV) has appeared to grow continuously in response to rising offshore energy production demands, as detailed by the U.S. Maritime Administration (MARAD), and can potentially be heavily reliant on lubricants for the efficient functioning of these numerous marine engines through various applications to reduce wear and tear, decrease frictions thereby improving and increasing outputs. With the increasing severity of offshore oil and gas activities, high-performance lubricants are imperative for OSVs, which has contributed to the growth of the lubricants market in this end-use segment.
OSVs (Offshore Support Vessels) made up the vast majority of offshore lubricants demand in 2023 and will continue to lead in demand as offshore exploration and production increases around the world. More stringent environmental requirements like the IMO 2020 sulfur cap have led to a growing demand for high-performance and low-emission OSV lubricants. Such regulations are fuelling the production of ultra-modern lubricants that ensure not only lengthy functionality for the engines but also offer better fuel economy with adherence to global emissions standards furthering demand for specialty offshore lubricants in OSVs.
Need Any Customization Research On Offshore Lubricants Market - Inquiry Now
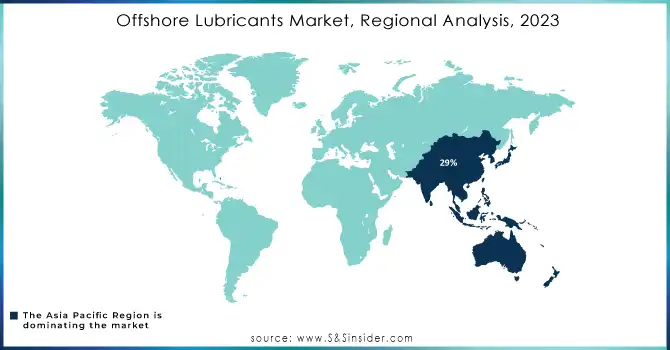
The Asia-Pacific region dominated the market and accounted for the largest share of the offshore lubricants market 29% in 2023, owing to high offshore oil and gas exploration activities in China, India, and Australia. The region has become a hub of offshore, with policies that favor government-led initiatives offshore, including deepwater oil fields and large offshore wind energy installations. With increasing offshore production platforms/drilling rigs/support vessels, the offshore lubricants demand in Asia-Pacific can expect sustainable growth. Especially China is increasing its offshore oil and gas exploration, which is supported by the government investment in deepwater drilling technology and infrastructure, thus further enhancing the growth of the market for high-performance lubricants in the region.
North America held a significant market share and is expected to boost offshore projects in the North American region specifically in the Gulf of Mexico. Promotion of regulatory frameworks as well as installation of key technological advancements over offshore production equipment are some of the channels contributing toward growth which in turn will have a direct influence on global Offshore Production Market value over the forecast period. According to the U.S. Bureau of Ocean Energy Management (BOEM), offshore lease sales were up 12% from last year, highlighting the growth curve in the region.
In contrast, the Middle East is anticipated to grow at the highest rate during the forecasted period. The region is home to some of the largest oil reserves in the world, and government initiatives to diversify energy production have accelerated offshore drilling and exploration projects. Additionally, the International Maritime Organization (IMO) notes that much of the Middle East is concentrating on renewing its offshore support vessel fleet, which also generates demand for lubricants. The increased exploration of offshore energy activities in the region is projected to drive the consumption of advanced lubes for critical equipment, maintaining the regional market share of offshore lubricants. With its expanding oil and gas infrastructure, the Middle East's market share in the offshore lubricants industry is set to grow substantially.
Key Service Providers/Manufacturers in the Offshore Lubricants Market
ExxonMobil (Mobil SHC 600 Series, Mobil 1 Marine)
Chevron Corporation (Chevron Marine Lubricants, Chevron RPM Marine)
Shell Lubricants (Shell Alexia 40, Shell Omala S4 GX)
TotalEnergies (Total Rubia Marine, Total Azolla ZS)
BP (BP Vanellus Marine 15W-40, BP Energol HLP)
Castrol (Castrol Optigear Synthetic 3000, Castrol Tribol 302 N)
Valvoline (Valvoline Premium Blue Marine, Valvoline All Fleet 15W-40)
Lukoil (Lukoil Marine Oil, Lukoil VS 3000)
Fuchs Lubricants (Fuchs Renolin S, Fuchs Cassida Food Grade Oils)
Chevron Marine Products (Chevron Texaco Marine Lubricants, Chevron RPM Marine)
ExxonMobil
Royal Dutch Shell
BP
Chevron Corporation
Halliburton
ConocoPhillips
Equinor
Repsol
Eni
CNOOC
In May 2024, Gulf Marine Services (GMS) expanded its Singapore fleet by adding two marine barges and a supply vessel to address the growing demand for marine support services in the region. This marks the first step in a broader plan to expand their global fleet.
In June 2023, ExxonMobil launched a new series of advanced offshore lubricants that enhance fuel efficiency and cut environmental impact for offshore operations, particularly in the North Sea and Gulf of Mexico.
Report Attributes | Details |
---|---|
Market Size in 2023 | USD 170.1 Billion |
Market Size by 2032 | USD 236.4 Billion |
CAGR | CAGR of 3.8% From 2024 to 2032 |
Base Year | 2023 |
Forecast Period | 2024-2032 |
Historical Data | 2020-2022 |
Report Scope & Coverage | Market Size, Segments Analysis, Competitive Landscape, Regional Analysis, DROC & SWOT Analysis, Forecast Outlook |
Key Segments | • By Application (Engine Oil, Hydraulic Oil, Gear Oil, Grease, Others) • By End Use (Offshore Rigs, FPSOs, OSVs) |
Regional Analysis/Coverage | North America (US, Canada, Mexico), Europe (Eastern Europe [Poland, Romania, Hungary, Turkey, Rest of Eastern Europe] Western Europe [Germany, France, UK, Italy, Spain, Netherlands, Switzerland, Austria, Rest of Western Europe]), Asia Pacific (China, India, Japan, South Korea, Vietnam, Singapore, Australia, Rest of Asia Pacific), Middle East & Africa (Middle East [UAE, Egypt, Saudi Arabia, Qatar, Rest of Middle East], Africa [Nigeria, South Africa, Rest of Africa], Latin America (Brazil, Argentina, Colombia, Rest of Latin America) |
Company Profiles | ExxonMobil, Chevron Corporation, Shell Lubricants, TotalEnergies, BP, Castrol, Valvoline, Lukoil, Fuchs Lubricants, Chevron Marine Products |
Key Drivers | • The growing global maritime trade, coupled with rising offshore exploration activities, is boosting the demand for offshore lubricants. • The development of synthetic and biodegradable lubricants that can withstand extreme offshore conditions is driving market growth. |
Restraints | • Despite the demand for greener products, the disposal and management of offshore lubricants under strict environmental regulations can hinder market growth. |
Ans. The projected market size for the Offshore Lubricants Market is USD 236.4 Billion by 2032.
Ans: The APAC region dominated the Offshore Lubricants Market in 2023.
Ans. The CAGR of the Offshore Lubricants Market is 3.8% During the forecast period of 2024-2032.
And: The OSVs end-use segment dominated the Offshore Lubricants Market in 2023.
Ans:
Table of Contents
1. Introduction
1.1 Market Definition
1.2 Scope (Inclusion and Exclusions)
1.3 Research Assumptions
2. Executive Summary
2.1 Market Overview
2.2 Regional Synopsis
2.3 Competitive Summary
3. Research Methodology
3.1 Top-Down Approach
3.2 Bottom-up Approach
3.3. Data Validation
3.4 Primary Interviews
4. Market Dynamics Impact Analysis
4.1 Market Driving Factors Analysis
4.1.2 Drivers
4.1.2 Restraints
4.1.3 Opportunities
4.1.4 Challenges
4.2 PESTLE Analysis
4.3 Porter’s Five Forces Model
5. Statistical Insights and Trends Reporting
5.1 Production Capacity and Utilization, by Country, by Type, 2023
5.2 Feedstock Prices, by Country, by Type, 2023
5.3 Regulatory Impact, by Country, by Type, 2023
5.4 Environmental Metrics: Emissions Data, Waste Management Practices, and Sustainability Initiatives, by Region
5.5 Innovation and R&D, by Type, 2023
6. Competitive Landscape
6.1 List of Major Companies, By Region
6.2 Market Share Analysis, By Region
6.3 Product Benchmarking
6.3.1 Product specifications and features
6.3.2 Pricing
6.4 Strategic Initiatives
6.4.1 Marketing and promotional activities
6.4.2 Distribution and supply chain strategies
6.4.3 Expansion plans and new product launches
6.4.4 Strategic partnerships and collaborations
6.5 Technological Advancements
6.6 Market Positioning and Branding
7. Offshore Lubricants Market Segmentation, by Application
7.1 Chapter Overview
7.2 Engine Oil
7.2.1 Engine Oil Market Trends Analysis (2020-2032)
7.2.2 Engine Oil Market Size Estimates and Forecasts to 2032 (USD Billion)
7.3 Hydraulic Oil
7.3.1 Hydraulic Oil Market Trends Analysis (2020-2032)
7.3.2 Hydraulic Oil Market Size Estimates and Forecasts to 2032 (USD Billion)
7.4 Gear Oil
7.4.1 Gear Oil Market Trends Analysis (2020-2032)
7.4.2 Gear Oil Market Size Estimates and Forecasts to 2032 (USD Billion)
7.4 Grease
7.4.1 Grease Market Trends Analysis (2020-2032)
7.4.2 Grease Market Size Estimates and Forecasts to 2032 (USD Billion)
7.4 Others
7.4.1 Others Market Trends Analysis (2020-2032)
7.4.2 Others Market Size Estimates and Forecasts to 2032 (USD Billion)
8. Offshore Lubricants Market Segmentation, by End User
8.1 Chapter Overview
8.2 Offshore Rigs
8.2.1 Offshore Rigs Market Trends Analysis (2020-2032)
8.2.2 Offshore Rigs Market Size Estimates and Forecasts to 2032 (USD Billion)
8.3 FPSOs
8.3.1 FPSOs Market Trends Analysis (2020-2032)
8.3.2 FPSOs Market Size Estimates and Forecasts to 2032 (USD Billion)
8.4 OSVs
8.4.1 OSVs Market Trends Analysis (2020-2032)
8.4.2 OSVs Market Size Estimates and Forecasts to 2032 (USD Billion)
9. Regional Analysis
9.1 Chapter Overview
9.2 North America
9.2.1 Trends Analysis
9.2.2 North America Offshore Lubricants Market Estimates and Forecasts, by Country (2020-2032) (USD Billion)
9.2.3 North America Offshore Lubricants Market Estimates and Forecasts, by Application (2020-2032) (USD Billion)
9.2.4 North America Offshore Lubricants Market Estimates and Forecasts, by End User (2020-2032) (USD Billion)
9.2.5 USA
9.2.5.1 USA Offshore Lubricants Market Estimates and Forecasts, by Application (2020-2032) (USD Billion)
9.2.5.2 USA Offshore Lubricants Market Estimates and Forecasts, by End User (2020-2032) (USD Billion)
9.2.6 Canada
9.2.6.1 Canada Offshore Lubricants Market Estimates and Forecasts, by Application (2020-2032) (USD Billion)
9.2.6.2 Canada Offshore Lubricants Market Estimates and Forecasts, by End User (2020-2032) (USD Billion)
9.2.7 Mexico
9.2.7.1 Mexico Offshore Lubricants Market Estimates and Forecasts, by Application (2020-2032) (USD Billion)
9.2.7.2 Mexico Offshore Lubricants Market Estimates and Forecasts, by End User (2020-2032) (USD Billion)
9.3 Europe
9.3.1 Eastern Europe
9.3.1.1 Trends Analysis
9.3.1.2 Eastern Europe Offshore Lubricants Market Estimates and Forecasts, by Country (2020-2032) (USD Billion)
9.3.1.3 Eastern Europe Offshore Lubricants Market Estimates and Forecasts, by Application (2020-2032) (USD Billion)
9.3.1.4 Eastern Europe Offshore Lubricants Market Estimates and Forecasts, by End User (2020-2032) (USD Billion)
9.3.1.5 Poland
9.3.1.5.1 Poland Offshore Lubricants Market Estimates and Forecasts, by Application (2020-2032) (USD Billion)
9.3.1.5.2 Poland Offshore Lubricants Market Estimates and Forecasts, by End User (2020-2032) (USD Billion)
9.3.1.6 Romania
9.3.1.6.1 Romania Offshore Lubricants Market Estimates and Forecasts, by Application (2020-2032) (USD Billion)
9.3.1.6.2 Romania Offshore Lubricants Market Estimates and Forecasts, by End User (2020-2032) (USD Billion)
9.3.1.7 Hungary
9.3.1.7.1 Hungary Offshore Lubricants Market Estimates and Forecasts, by Application (2020-2032) (USD Billion)
9.3.1.7.2 Hungary Offshore Lubricants Market Estimates and Forecasts, by End User (2020-2032) (USD Billion)
9.3.1.8 Turkey
9.3.1.8.1 Turkey Offshore Lubricants Market Estimates and Forecasts, by Application (2020-2032) (USD Billion)
9.3.1.8.2 Turkey Offshore Lubricants Market Estimates and Forecasts, by End User (2020-2032) (USD Billion)
9.3.1.9 Rest of Eastern Europe
9.3.1.9.1 Rest of Eastern Europe Offshore Lubricants Market Estimates and Forecasts, by Application (2020-2032) (USD Billion)
9.3.1.9.2 Rest of Eastern Europe Offshore Lubricants Market Estimates and Forecasts, by End User (2020-2032) (USD Billion)
9.3.2 Western Europe
9.3.2.1 Trends Analysis
9.3.2.2 Western Europe Offshore Lubricants Market Estimates and Forecasts, by Country (2020-2032) (USD Billion)
9.3.2.3 Western Europe Offshore Lubricants Market Estimates and Forecasts, by Application (2020-2032) (USD Billion)
9.3.2.4 Western Europe Offshore Lubricants Market Estimates and Forecasts, by End User (2020-2032) (USD Billion)
9.3.2.5 Germany
9.3.2.5.1 Germany Offshore Lubricants Market Estimates and Forecasts, by Application (2020-2032) (USD Billion)
9.3.2.5.2 Germany Offshore Lubricants Market Estimates and Forecasts, by End User (2020-2032) (USD Billion)
9.3.2.6 France
9.3.2.6.1 France Offshore Lubricants Market Estimates and Forecasts, by Application (2020-2032) (USD Billion)
9.3.2.6.2 France Offshore Lubricants Market Estimates and Forecasts, by End User (2020-2032) (USD Billion)
9.3.2.7 UK
9.3.2.7.1 UK Offshore Lubricants Market Estimates and Forecasts, by Application (2020-2032) (USD Billion)
9.3.2.7.2 UK Offshore Lubricants Market Estimates and Forecasts, by End User (2020-2032) (USD Billion)
9.3.2.8 Italy
9.3.2.8.1 Italy Offshore Lubricants Market Estimates and Forecasts, by Application (2020-2032) (USD Billion)
9.3.2.8.2 Italy Offshore Lubricants Market Estimates and Forecasts, by End User (2020-2032) (USD Billion)
9.3.2.9 Spain
9.3.2.9.1 Spain Offshore Lubricants Market Estimates and Forecasts, by Application (2020-2032) (USD Billion)
9.3.2.9.2 Spain Offshore Lubricants Market Estimates and Forecasts, by End User (2020-2032) (USD Billion)
9.3.2.10 Netherlands
9.3.2.10.1 Netherlands Offshore Lubricants Market Estimates and Forecasts, by Application (2020-2032) (USD Billion)
9.3.2.10.2 Netherlands Offshore Lubricants Market Estimates and Forecasts, by End User (2020-2032) (USD Billion)
9.3.2.11 Switzerland
9.3.2.11.1 Switzerland Offshore Lubricants Market Estimates and Forecasts, by Application (2020-2032) (USD Billion)
9.3.2.11.2 Switzerland Offshore Lubricants Market Estimates and Forecasts, by End User (2020-2032) (USD Billion)
9.3.2.12 Austria
9.3.2.12.1 Austria Offshore Lubricants Market Estimates and Forecasts, by Application (2020-2032) (USD Billion)
9.3.2.12.2 Austria Offshore Lubricants Market Estimates and Forecasts, by End User (2020-2032) (USD Billion)
9.3.2.13 Rest of Western Europe
9.3.2.13.1 Rest of Western Europe Offshore Lubricants Market Estimates and Forecasts, by Application (2020-2032) (USD Billion)
9.3.2.13.2 Rest of Western Europe Offshore Lubricants Market Estimates and Forecasts, by End User (2020-2032) (USD Billion)
9.4 Asia Pacific
9.4.1 Trends Analysis
9.4.2 Asia Pacific Offshore Lubricants Market Estimates and Forecasts, by Country (2020-2032) (USD Billion)
9.4.3 Asia Pacific Offshore Lubricants Market Estimates and Forecasts, by Application (2020-2032) (USD Billion)
9.4.4 Asia Pacific Offshore Lubricants Market Estimates and Forecasts, by End User (2020-2032) (USD Billion)
9.4.5 China
9.4.5.1 China Offshore Lubricants Market Estimates and Forecasts, by Application (2020-2032) (USD Billion)
9.4.5.2 China Offshore Lubricants Market Estimates and Forecasts, by End User (2020-2032) (USD Billion)
9.4.6 India
9.4.5.1 India Offshore Lubricants Market Estimates and Forecasts, by Application (2020-2032) (USD Billion)
9.4.5.2 India Offshore Lubricants Market Estimates and Forecasts, by End User (2020-2032) (USD Billion)
9.4.5 Japan
9.4.5.1 Japan Offshore Lubricants Market Estimates and Forecasts, by Application (2020-2032) (USD Billion)
9.4.5.2 Japan Offshore Lubricants Market Estimates and Forecasts, by End User (2020-2032) (USD Billion)
9.4.6 South Korea
9.4.6.1 South Korea Offshore Lubricants Market Estimates and Forecasts, by Application (2020-2032) (USD Billion)
9.4.6.2 South Korea Offshore Lubricants Market Estimates and Forecasts, by End User (2020-2032) (USD Billion)
9.4.7 Vietnam
9.4.7.1 Vietnam Offshore Lubricants Market Estimates and Forecasts, by Application (2020-2032) (USD Billion)
9.2.7.2 Vietnam Offshore Lubricants Market Estimates and Forecasts, by End User (2020-2032) (USD Billion)
9.4.8 Singapore
9.4.8.1 Singapore Offshore Lubricants Market Estimates and Forecasts, by Application (2020-2032) (USD Billion)
9.4.8.2 Singapore Offshore Lubricants Market Estimates and Forecasts, by End User (2020-2032) (USD Billion)
9.4.9 Australia
9.4.9.1 Australia Offshore Lubricants Market Estimates and Forecasts, by Application (2020-2032) (USD Billion)
9.4.9.2 Australia Offshore Lubricants Market Estimates and Forecasts, by End User (2020-2032) (USD Billion)
9.4.10 Rest of Asia Pacific
9.4.10.1 Rest of Asia Pacific Offshore Lubricants Market Estimates and Forecasts, by Application (2020-2032) (USD Billion)
9.4.10.2 Rest of Asia Pacific Offshore Lubricants Market Estimates and Forecasts, by End User (2020-2032) (USD Billion)
9.5 Middle East and Africa
9.5.1 Middle East
9.5.1.1 Trends Analysis
9.5.1.2 Middle East Offshore Lubricants Market Estimates and Forecasts, by Country (2020-2032) (USD Billion)
9.5.1.3 Middle East Offshore Lubricants Market Estimates and Forecasts, by Application (2020-2032) (USD Billion)
9.5.1.4 Middle East Offshore Lubricants Market Estimates and Forecasts, by End User (2020-2032) (USD Billion)
9.5.1.5 UAE
9.5.1.5.1 UAE Offshore Lubricants Market Estimates and Forecasts, by Application (2020-2032) (USD Billion)
9.5.1.5.2 UAE Offshore Lubricants Market Estimates and Forecasts, by End User (2020-2032) (USD Billion)
9.5.1.6 Egypt
9.5.1.6.1 Egypt Offshore Lubricants Market Estimates and Forecasts, by Application (2020-2032) (USD Billion)
9.5.1.6.2 Egypt Offshore Lubricants Market Estimates and Forecasts, by End User (2020-2032) (USD Billion)
9.5.1.7 Saudi Arabia
9.5.1.7.1 Saudi Arabia Offshore Lubricants Market Estimates and Forecasts, by Application (2020-2032) (USD Billion)
9.5.1.7.2 Saudi Arabia Offshore Lubricants Market Estimates and Forecasts, by End User (2020-2032) (USD Billion)
9.5.1.8 Qatar
9.5.1.8.1 Qatar Offshore Lubricants Market Estimates and Forecasts, by Application (2020-2032) (USD Billion)
9.5.1.8.2 Qatar Offshore Lubricants Market Estimates and Forecasts, by End User (2020-2032) (USD Billion)
9.5.1.9 Rest of Middle East
9.5.1.9.1 Rest of Middle East Offshore Lubricants Market Estimates and Forecasts, by Application (2020-2032) (USD Billion)
9.5.1.9.2 Rest of Middle East Offshore Lubricants Market Estimates and Forecasts, by End User (2020-2032) (USD Billion)
9.5.2 Africa
9.5.2.1 Trends Analysis
9.5.2.2 Africa Offshore Lubricants Market Estimates and Forecasts, by Country (2020-2032) (USD Billion)
9.5.2.3 Africa Offshore Lubricants Market Estimates and Forecasts, by Application (2020-2032) (USD Billion)
9.5.2.4 Africa Offshore Lubricants Market Estimates and Forecasts, by End User (2020-2032) (USD Billion)
9.5.2.5 South Africa
9.5.2.5.1 South Africa Offshore Lubricants Market Estimates and Forecasts, by Application (2020-2032) (USD Billion)
9.5.2.5.2 South Africa Offshore Lubricants Market Estimates and Forecasts, by End User (2020-2032) (USD Billion)
9.5.2.6 Nigeria
9.5.2.6.1 Nigeria Offshore Lubricants Market Estimates and Forecasts, by Application (2020-2032) (USD Billion)
9.5.2.6.2 Nigeria Offshore Lubricants Market Estimates and Forecasts, by End User (2020-2032) (USD Billion)
9.5.2.7 Rest of Africa
9.5.2.7.1 Rest of Africa Offshore Lubricants Market Estimates and Forecasts, by Application (2020-2032) (USD Billion)
9.5.2.7.2 Rest of Africa Offshore Lubricants Market Estimates and Forecasts, by End User (2020-2032) (USD Billion)
9.6 Latin America
9.6.1 Trends Analysis
9.6.2 Latin America Offshore Lubricants Market Estimates and Forecasts, by Country (2020-2032) (USD Billion)
9.6.3 Latin America Offshore Lubricants Market Estimates and Forecasts, by Application (2020-2032) (USD Billion)
9.6.4 Latin America Offshore Lubricants Market Estimates and Forecasts, by End User (2020-2032) (USD Billion)
9.6.5 Brazil
9.6.5.1 Brazil Offshore Lubricants Market Estimates and Forecasts, by Application (2020-2032) (USD Billion)
9.6.5.2 Brazil Offshore Lubricants Market Estimates and Forecasts, by End User (2020-2032) (USD Billion)
9.6.6 Argentina
9.6.6.1 Argentina Offshore Lubricants Market Estimates and Forecasts, by Application (2020-2032) (USD Billion)
9.6.6.2 Argentina Offshore Lubricants Market Estimates and Forecasts, by End User (2020-2032) (USD Billion)
9.6.7 Colombia
9.6.7.1 Colombia Offshore Lubricants Market Estimates and Forecasts, by Application (2020-2032) (USD Billion)
9.6.7.2 Colombia Offshore Lubricants Market Estimates and Forecasts, by End User (2020-2032) (USD Billion)
9.6.8 Rest of Latin America
9.6.8.1 Rest of Latin America Offshore Lubricants Market Estimates and Forecasts, by Application (2020-2032) (USD Billion)
9.6.8.2 Rest of Latin America Offshore Lubricants Market Estimates and Forecasts, by End User (2020-2032) (USD Billion)
10. Company Profiles
10.1 ExxonMobil
10.1.1 Company Overview
10.1.2 Financial
10.1.3 Products/ Services Offered
110.1.4 SWOT Analysis
10.2 Chevron Corporation
10.2.1 Company Overview
10.2.2 Financial
10.2.3 Products/ Services Offered
10.2.4 SWOT Analysis
10.3 Shell Lubricants
10.3.1 Company Overview
10.3.2 Financial
10.3.3 Products/ Services Offered
10.3.4 SWOT Analysis
10.4 TotalEnergies
10.4.1 Company Overview
10.4.2 Financial
10.4.3 Products/ Services Offered
10.4.4 SWOT Analysis
10.5 BP
10.5.1 Company Overview
10.5.2 Financial
10.5.3 Products/ Services Offered
10.5.4 SWOT Analysis
10.6 Castrol
10.6.1 Company Overview
10.6.2 Financial
10.6.3 Products/ Services Offered
10.6.4 SWOT Analysis
10.7 Valvoline
10.7.1 Company Overview
10.7.2 Financial
10.7.3 Products/ Services Offered
10.7.4 SWOT Analysis
10.8 Lukoil
10.8.1 Company Overview
10.8.2 Financial
10.8.3 Products/ Services Offered
10.8.4 SWOT Analysis
10.9 Fuchs Lubricants
10.9.1 Company Overview
10.9.2 Financial
10.9.3 Products/ Services Offered
10.9.4 SWOT Analysis
10.10 Chevron Marine Products
10.9.1 Company Overview
10.9.2 Financial
10.9.3 Products/ Services Offered
10.9.4 SWOT Analysis
11. Use Cases and Best Practices
12. Conclusion
An accurate research report requires proper strategizing as well as implementation. There are multiple factors involved in the completion of good and accurate research report and selecting the best methodology to compete the research is the toughest part. Since the research reports we provide play a crucial role in any company’s decision-making process, therefore we at SNS Insider always believe that we should choose the best method which gives us results closer to reality. This allows us to reach at a stage wherein we can provide our clients best and accurate investment to output ratio.
Each report that we prepare takes a timeframe of 350-400 business hours for production. Starting from the selection of titles through a couple of in-depth brain storming session to the final QC process before uploading our titles on our website we dedicate around 350 working hours. The titles are selected based on their current market cap and the foreseen CAGR and growth.
The 5 steps process:
Step 1: Secondary Research:
Secondary Research or Desk Research is as the name suggests is a research process wherein, we collect data through the readily available information. In this process we use various paid and unpaid databases which our team has access to and gather data through the same. This includes examining of listed companies’ annual reports, Journals, SEC filling etc. Apart from this our team has access to various associations across the globe across different industries. Lastly, we have exchange relationships with various university as well as individual libraries.
Step 2: Primary Research
When we talk about primary research, it is a type of study in which the researchers collect relevant data samples directly, rather than relying on previously collected data. This type of research is focused on gaining content specific facts that can be sued to solve specific problems. Since the collected data is fresh and first hand therefore it makes the study more accurate and genuine.
We at SNS Insider have divided Primary Research into 2 parts.
Part 1 wherein we interview the KOLs of major players as well as the upcoming ones across various geographic regions. This allows us to have their view over the market scenario and acts as an important tool to come closer to the accurate market numbers. As many as 45 paid and unpaid primary interviews are taken from both the demand and supply side of the industry to make sure we land at an accurate judgement and analysis of the market.
This step involves the triangulation of data wherein our team analyses the interview transcripts, online survey responses and observation of on filed participants. The below mentioned chart should give a better understanding of the part 1 of the primary interview.
Part 2: In this part of primary research the data collected via secondary research and the part 1 of the primary research is validated with the interviews from individual consultants and subject matter experts.
Consultants are those set of people who have at least 12 years of experience and expertise within the industry whereas Subject Matter Experts are those with at least 15 years of experience behind their back within the same space. The data with the help of two main processes i.e., FGDs (Focused Group Discussions) and IDs (Individual Discussions). This gives us a 3rd party nonbiased primary view of the market scenario making it a more dependable one while collation of the data pointers.
Step 3: Data Bank Validation
Once all the information is collected via primary and secondary sources, we run that information for data validation. At our intelligence centre our research heads track a lot of information related to the market which includes the quarterly reports, the daily stock prices, and other relevant information. Our data bank server gets updated every fortnight and that is how the information which we collected using our primary and secondary information is revalidated in real time.
Step 4: QA/QC Process
After all the data collection and validation our team does a final level of quality check and quality assurance to get rid of any unwanted or undesired mistakes. This might include but not limited to getting rid of the any typos, duplication of numbers or missing of any important information. The people involved in this process include technical content writers, research heads and graphics people. Once this process is completed the title gets uploader on our platform for our clients to read it.
Step 5: Final QC/QA Process:
This is the last process and comes when the client has ordered the study. In this process a final QA/QC is done before the study is emailed to the client. Since we believe in giving our clients a good experience of our research studies, therefore, to make sure that we do not lack at our end in any way humanly possible we do a final round of quality check and then dispatch the study to the client.
Key Segmentation
By Application
Engine Oil
Hydraulic Oil
Gear Oil
Grease
Others
By End Use
Offshore Rigs
FPSOs
OSVs
Request for Segment Customization as per your Business Requirement: Segment Customization Request
REGIONAL COVERAGE:
North America
US
Canada
Mexico
Europe
Eastern Europe
Poland
Romania
Hungary
Turkey
Rest of Eastern Europe
Western Europe
Germany
France
UK
Italy
Spain
Netherlands
Switzerland
Austria
Rest of Western Europe
Asia Pacific
China
India
Japan
South Korea
Vietnam
Singapore
Australia
Rest of Asia Pacific
Middle East & Africa
Middle East
UAE
Egypt
Saudi Arabia
Qatar
Rest of the Middle East
Africa
Nigeria
South Africa
Rest of Africa
Latin America
Brazil
Argentina
Colombia
Rest of Latin America
Request for Country Level Research Report: Country Level Customization Request
Available Customization
With the given market data, SNS Insider offers customization as per the company’s specific needs. The following customization options are available for the report:
Product Analysis
Criss-Cross segment analysis (e.g. Product X Application)
Product Matrix which gives a detailed comparison of product portfolio of each company
Geographic Analysis
Additional countries in any of the regions
Company Information
Detailed analysis and profiling of additional market players (Up to five)
The Alkylamines Market Size was valued at USD 6.24 billion in 2023 and is expected to reach USD 11.11 billion by 2032 and grow at a CAGR of 6.62% over the forecast period 2024-2032.
The Smart Textiles Market Size was USD 3.6 billion in 2023 and is expected to reach USD 26.1 billion by 2032 and grow at a CAGR of 25.0% by 2024-2032.
The BOPP Films Market is expected to increase at a CAGR of 5.9% from 2024 to 2031 from USD 28.7 billion in 2023 to USD 45.5 billion in 2031.
The Biofertilizers Market size was valued at USD 2.7 Billion in 2023. It is expected to grow to USD 7.10 Billion by 2032 and grow at a CAGR of 11.4% over the forecast period of 2024-2032.
The Pentanediamine Market size was valued at USD 859.7 million in 2022. It is estimated to hit USD 10544.73 million by 2030 and grow at a CAGR of 36.8% over the forecast period of 2023-2030.
The Biochar Market size was valued at USD 536.8 Million in 2023 and is expected to reach USD 1764.1 Million by 2032 and grow at a CAGR of 14.1% over the forecast period of 2024-2032.
Hi! Click one of our member below to chat on Phone