Electronic Ceramics Market Size
Get more information on Electronic Ceramics Market - Request Sample Report
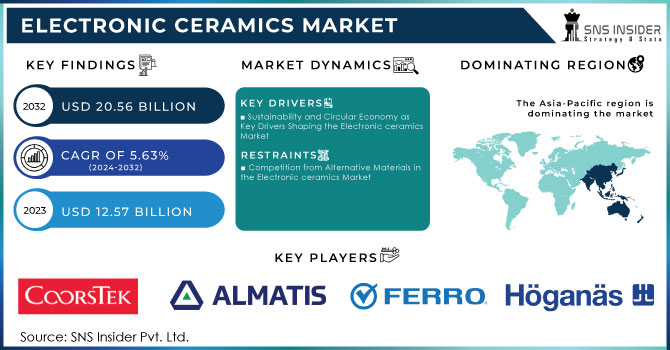
The Electronic Ceramics Market Size was valued at USD 12.57 Billion in 2023 and is expected to reach USD 20.56 Billion by 2032, and grow at a CAGR of 5.63% over the forecast period 2024-2032.
The electronic ceramics market is witnessing significant growth due to advancements in technology, particularly with the rise of smartphones, tablets, and wearable devices. These innovations have led to an increased demand for electronic ceramics, which are essential components in capacitors, insulators, and piezoelectric devices. As next-generation electronic devices continue to develop, the reliance on high-performance ceramics is becoming paramount. This trend is supported by research and publications highlighting the crucial role of electronic ceramics in enhancing device efficiency and performance. The market is further bolstered by a focus on energy-efficient materials and the integration of advanced ceramics in various applications, from consumer electronics to telecommunications. As industries adopt innovative solutions to meet consumer demands, the importance of electronic ceramics will only grow. This growth trajectory presents numerous opportunities for manufacturers and researchers alike, as evidenced by various studies and publications dedicated to exploring the latest developments in this field.
The rising popularity of electric vehicles (EVs) is driving significant demand for high-performance electronic components, particularly electronics ceramics, which are essential for their thermal stability and electrical insulation properties. According to the Global EV Outlook 2024, the demand for EV batteries surged to over 750 GWh in 2023, marking a 40% increase from 2022, primarily driven by electric car sales that accounted for 95% of this growth. The United States and Europe exhibited the fastest growth rates, both exceeding 40% year-on-year, while China's growth was approximately 35%. Despite the rapid expansion of the EV market, the U.S. remains the smallest market at 100 GWh, compared to 185 GWh in Europe and 415 GWh in China.
This surge in demand for EV batteries has directly influenced the need for critical raw materials such as lithium, cobalt, and nickel, with lithium demand reaching around 140 kt in 2023, making up 85% of total demand. The supply of these critical metals has also increased, with mining and refining investments leading to a surplus, thus reducing mineral prices and battery costs. In this context, electronic ceramics play a crucial role in enhancing the performance and efficiency of battery systems by providing superior dielectric properties, thermal management, and mechanical strength, essential for the durability of battery components.
Battery production is largely concentrated in China, Europe, and the U.S., with China leading at 415 GWh in 2023. As manufacturing capacity expands, battery production is expected to align closely with EV demand centers through 2030. This underscores the critical intersection of material science, particularly the role of electronics ceramics, in the ongoing evolution of the automotive industry, highlighting their importance in advancing battery technology and overall EV performance.
Electronic Ceramics Market Dynamics
Drivers
-
Sustainability and Circular Economy as Key Drivers Shaping the Electronic ceramics Market
The global electronic ceramics market is experiencing significant growth due to the increasing demand for electronic devices such as smartphones, tablets, and various consumer electronics. Ceramics play a crucial role in the electronics sector, particularly in serving as the packaging for microchips and integrated circuits, thanks to their excellent thermal conductivity and resistance to chemical erosion. However, the rapid advancement and replacement of electronics have raised concerns about sustainability, particularly with the estimated 54 million tons of electronic waste discarded each year. The global recycling rates for electronics are alarmingly low, ranging from 15% to 30%, leading to a significant accumulation of unused electronics in homes and landfills. This not only represents a waste of valuable resources, estimated at over USD 55 billion annually, but also depletes the finite materials necessary for manufacturing new products. The shift towards a circular economy aims to address these challenges by maximizing the value of products throughout their life cycles. Recycling is essential, but extending the lifespan of electronics through repairs and refurbishments is even more beneficial. A single laptop's manufacturing process consumes up to 70% of the energy it will use in its entire lifecycle, making longevity a key factor in reducing overall energy consumption. Moreover, as technologies develop, the potential for recovering valuable materials from discarded electronics, although ceramics are currently non-recoverable, is essential to reduce the need for new raw materials. To promote sustainable practices, individuals and organizations are encouraged to ensure proper disposal and recycling of electronics through R2 Certified facilities, which adhere to comprehensive standards for responsible recycling and data security. The R2 Standard, developed in response to the challenges of electronics waste management, emphasizes responsible reuse, recovery, and compliance with environmental safety standards. With nearly 1,000 R2 Certified facilities operating globally, there is a growing movement towards sustainable management of electronic waste, emphasizing the importance of collaboration among all stakeholders in this effort.
Restraints
-
Competition from Alternative Materials in the Electronic ceramics Market
The electronic ceramics market is significantly restrained by the growing competition from alternative materials, notably polymers and metals. These alternatives often provide lower manufacturing costs, enhanced performance, and greater versatility. Polymers, for example, are not only lighter but also easier to mold into complex shapes, allowing for innovative designs in electronic devices. Additionally, advancements in polymer chemistry and metallurgy are leading to the development of high-performance materials that can outperform traditional ceramics in applications such as flexible electronics and wearables. Furthermore, the increasing emphasis on sustainability and recycling makes these alternatives more appealing, as they often have better recycling prospects than ceramics. To maintain market share, electronic ceramics manufacturers must prioritize innovation and address the challenges posed by these competitive materials.
Electronic Ceramics Market - Segment Analysis
by Material
In 2023, alumina emerged as the leading material in the electronic ceramics market, capturing around 45% of total revenue due to its exceptional properties. Renowned for its outstanding thermal stability, electrical insulation, and chemical resistance, alumina is ideal for various electronic components such as substrates for integrated circuits, capacitors, and insulators. Its versatility spans multiple sectors, including consumer electronics, telecommunications, and automotive, where it can be fabricated into diverse shapes and sizes. Moreover, alumina's cost-effectiveness and advancements in manufacturing techniques enhance its appeal as the industry shifts toward miniaturization and efficiency. Companies like CeramTec AG, Kyocera Corporation, NGK Insulators, and CoorsTek have launched innovative alumina-based products to cater to emerging demands, particularly in high-frequency applications and electric vehicles. Overall, alumina’s performance characteristics, coupled with a focus on sustainability, position it as a key player in advancing electronic technologies across various sectors.
by Product
In 2023, monolithic ceramics dominated the electronic ceramics market, capturing around 50% of total revenue. Their success is attributed to their exceptional mechanical strength, thermal stability, and electrical insulation, making them ideal for high-performance applications such as capacitors and integrated circuit substrates. Monolithic ceramics find applications across diverse sectors, including consumer electronics and automotive, thanks to their adaptability and cost-effective manufacturing processes. Recent advancements in materials science enhance their performance, facilitating the production of complex shapes. Furthermore, their recyclability aligns with sustainability initiatives. Key players like Murata, Kyocera, CeramTec, and NGK have launched innovative products that leverage these properties, reinforcing monolithic ceramics' vital role in advancing technology and meeting industry demands for efficiency and miniaturization.
Electronic Ceramics Market - Regional Analysis
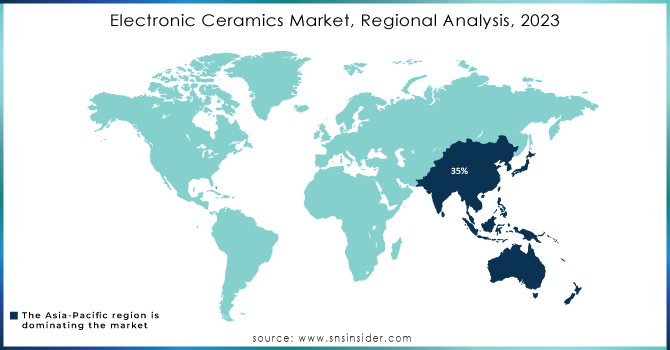
The Asia-Pacific region has established itself as a dominant player in the electronic ceramics market, accounting for approximately 35% of global revenue in 2023. This leadership is primarily due to its robust electronics manufacturing sector, especially in consumer electronics, automotive, and telecommunications. Countries like China, Japan, and South Korea are at the forefront, benefitting from advanced manufacturing capabilities, extensive supply chains for raw materials, and substantial investments in research and development. China's position as the largest manufacturer of electronic goods further solidifies its dominance, supported by large-scale production facilities and government incentives for technological innovation. The country's burgeoning consumer electronics market, coupled with significant investments in 5G infrastructure and electric vehicle development, enhances its market growth prospects. Additionally, leading companies such as Kyocera and Murata Manufacturing are actively launching innovative products, including nontoxic ceramics to replace traditional lead-based components. PI Ceramic's recent introduction of Piezoceramic Composites illustrates the region's commitment to advancing manufacturing techniques, sustainability, and high-performance materials. As the demand for smart devices and energy-efficient solutions grows, the Asia-Pacific region is well positioned for sustained growth in the electronic ceramics market.
In 2023, North America emerged as the fastest-growing region, propelled by technological advancements and a robust consumer market. The U.S., as the largest economy, drives significant growth, supported by major corporations and a thriving startup ecosystem. Investments in infrastructure, particularly through initiatives like the U.S. Infrastructure Investment and Jobs Act, enhance logistics efficiency and create jobs. Key product launches, such as NVIDIA's Ada Lovelace GPUs, Apple’s iPhone 15, and General Motors' 2023 Chevrolet Equinox EV, exemplify innovation. This combination of economic strength, skilled workforce, and consumer demand positions North America as a leader in global growth and innovation.
Get Customized Report as per your Business Requirement - Request For Customized Report
Key Players
Some of the key players in Electronic ceramics market who provide product and offering
-
CoorsTek Inc. (Technical ceramics, ceramic substrates)
-
Almatis GmbH (Alumina products, specialty aluminas)
-
American Elements (Advanced ceramic materials, metal oxides)
-
Ferro Corporation (Ceramic glazes, specialty coatings)
-
Hoganas AB (Metal powders, ceramic powders)
-
Merck KgA (Specialty chemicals, electronic materials)
-
Noritake Co. Ltd. (Ceramic materials, grinding wheels)
-
Ishihara Sangyo Kaisha Ltd. (Zirconia ceramics, functional ceramics)
-
L3Harris Technologies Inc. (Advanced electronic systems, ceramic capacitors)
-
Physik Instrumente GmbH & Co. KG (Piezo ceramics, precision positioning systems)
-
Sensor Technology Ltd. (Ceramic sensors, piezoelectric devices)
-
Venator Materials Plc (Titanium dioxide, specialty chemicals for ceramics)
-
APC International, Ltd. (Piezoelectric ceramics, ceramic capacitors)
-
CeramTec Holding GmbH (Industrial ceramics, ceramic substrates)
-
Central Electronics Limited (Ceramic materials for electronics, insulators)
-
Kyocera Corporation (Multilayer ceramic capacitors, ceramic filters)
-
Maruwa Co., Ltd. (High-frequency ceramic components, ceramic substrates)
-
Morgan Advanced Materials (Technical ceramics, insulation materials)
-
Murata Manufacturing Co., Ltd. (Ceramic capacitors, piezoelectric devices)
-
PI Ceramics (Precision ceramics, actuator components)
-
Sparkler Ceramics Pvt. Ltd. (Ceramic materials for various applications)
List of Ceramic Suppliers:
-
CeramTec Holding GmbH
-
Kyocera Corporation
-
CoorsTek Inc.
-
Almatis GmbH
-
Noritake Co. Ltd.
-
Ferro Corporation
-
Morgan Advanced Materials
-
Hoganas AB
-
Murata Manufacturing Co., Ltd.
-
Ishihara Sangyo Kaisha Ltd.
Recent Development
-
In May 2024, PI Ceramic introduced a new product line called “Piezoceramic Composites,” utilizing an innovative manufacturing technology. This process incorporates piezoelectric ceramics embedded within filling polymers. To accomplish this, materials featuring both high stiffness and highly elastic polymer matrices are employed.
-
August 12, 2024 : Kyocera International, Inc. presented a case study showcasing the application of Fine Ceramics in the electronics industry. The study highlights the use of Fine Ceramics as a protective cap material for electronic devices, featuring a gyro sensor (image stabilization sensor) mounted on a ceramic base. This innovation aims to enhance the durability and performance of electronic components.
-
June 28, 2024: Ceramic engineering is gaining renewed attention for its critical role in innovation across various industries. As ceramics remain valuable in mitigating oxidation from moisture, their applications continue to be relevant. This trend underscores the significance of ceramic engineering, challenging the perception that it is an obsolete field, highlighting its vital contributions to modern technology, and manufacturing processes.
-
August 24, 2024 : Researchers at the Weizmann Institute of Science, led by Prof. Igor Lubomirsky, have developed a nontoxic ceramic that could potentially replace lead-based electronic components. This innovative material addresses environmental concerns associated with traditional lead-containing ceramics, which are essential for many technologies but pose toxicity risks.
| Report Attributes | Details |
|---|---|
| Market Size in 2023 | USD 12.57 Billion |
| Market Size by 2032 | USD 20.56 Billion |
| CAGR | CAGR of 5.63 % From 2024 to 2032 |
| Base Year | 2023 |
| Forecast Period | 2024-2032 |
| Historical Data | 2020-2022 |
| Report Scope & Coverage | Market Size, Segments Analysis, Competitive Landscape, Regional Analysis, DROC & SWOT Analysis, Forecast Outlook |
| Key Segments | • by material (Zirconia, Silica, Alumina, Others) • by Product (Monolithic ceramics, Ceramic matrix composites, Ceramic coatings, Others) • by End-User (Medical, Electronics, Automobile, Aerospace & Defense, Others) • by Application (Actuators & Sensors, Capacitors, Data Storage Devices, Optoelectronic Devices, Power Distribution Devices, Others) |
| Regional Analysis/Coverage | North America (US, Canada, Mexico), Europe (Eastern Europe [Poland, Romania, Hungary, Turkey, Rest of Eastern Europe] Western Europe] Germany, France, UK, Italy, Spain, Netherlands, Switzerland, Austria, Rest of Western Europe]), Asia-Pacific (China, India, Japan, South Korea, Vietnam, Singapore, Australia, Rest of Asia-Pacific), Middle East & Africa (Middle East [UAE, Egypt, Saudi Arabia, Qatar, Rest of Middle East], Africa [Nigeria, South Africa, Rest of Africa], Latin America (Brazil, Argentina, Colombia, Rest of Latin America) |
| Company Profiles | CoorsTek Inc., Almatis GmbH, American Elements, Ferro Corporation, Hoganas AB, Merck KgA, Noritake Co. Ltd., Ishihara Sangyo Kaisha Ltd., L3Harris Technologies Inc., Physik Instrumente GmbH & Co. KG, Sensor Technology Ltd., Venator Materials Plc, APC International, Ltd., CeramTec Holding GmbH, Central Electronics Limited, Kyocera Corporation, Maruwa Co., Ltd., Morgan Advanced Materials, Murata Manufacturing Co., Ltd., PI Ceramics, and Sparkler Ceramics Pvt. Ltd. |
| Key Drivers | • Sustainability and Circular Economy as Key Drivers Shaping the Electronics Ceramics Market |
| RESTRAINTS | • Competition from Alternative Materials in the Electronics Ceramics Market |
Frequently Asked Questions
Ans: The Alumina segment dominated the Electronic ceramics Market.
Ans: The electronic ceramics market is projected to experience significant growth, driven by increasing demand for advanced electronic components, rapid technological advancements, and the rising adoption of electric vehicles and renewable energy solutions.
Electric vehicle development and Ceramic solid-state battery development are the opportunities of the Electronic ceramics Market.
Ans: The electronic ceramics Market size was valued at 12.57 billion in 2023 at a CAGR of 5.63%.
Ans: Asia-Pacific dominated the Electronic ceramics Market in 2023.
Get in Touch
