Power Rental Market Size:
To get more information on Power Rental Market - Request Sample Report
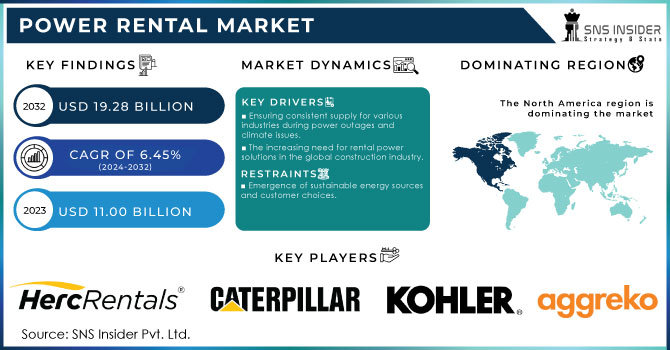
The Power Rental Market size was valued at USD 11.00 Billion in 2023. It is estimated to reach USD 19.28 Billion by 2032, growing at a CAGR of 6.45% during 2024-2032.
The power rental market is quickly expanding due to the rising worldwide need for dependable and adaptable power options. Development of infrastructure, fast urbanization, frequent power failures, and the necessity for uninterrupted power supply in different sectors are driving the growth of this market. The demand for temporary power during construction projects, industrial operations, and major events is a significant factor in driving the power rental market. Construction sites, especially in developing areas, frequently need provisional electricity services throughout various project phases. In 2023, substantial funding was allocated by the U.S. government for power solutions at construction sites, focusing on sustainability and efficiency. The Infrastructure Investment and Jobs Act (IIJA) dedicated around USD 1.2 trillion, with a focus on improving energy efficiency and incorporating renewable energy solutions in construction projects. Approximately USD 100 million was allocated to fund renewable energy projects, including the installation of solar power and battery storage systems. The government also implemented tax incentives and rewards for electric construction machinery, estimated to help construction businesses save around USD 500 million in total through lower fuel expenses.
In addition to industrial applications, power rentals are essential for the successful operation of major events like concerts, sports events, and exhibitions. Event planners depend on renting electricity to fulfill the significant energy needs necessary to operate sound equipment, lighting, and other vital amenities. The efficiency and reliability of power rental services are being improved through technological advancements, like the incorporation of smart meters and energy management systems. For example, in 2023, around 90% of American homes installed smart meters, a substantial rise from about 65% in 2018. This year, utility companies have spent more than USD 4 billion on smart meter infrastructure to boost grid reliability and enhance customer experience. These technologies enable businesses to monitor and optimize power usage in real time, leading to cost reduction and decreased downtime. The power rental market is anticipated to keep growing due to the increased need for energy-efficient and low-emission options, providing dependable and sustainable power solutions to various industries and applications.
MARKET DYNAMICS:
Drivers
-
Ensuring consistent supply for various industries during power outages and climate issues.
Many industries, such as manufacturing, healthcare, telecommunications, and events, require a continuous supply of electricity. Moreover, power outages, planned or unplanned, may cost these industries massive financial losses. The power rental assures that the customers receive supply through temporary generators and related equipment which can be provided within an hour. Therefore, such service may experience high demand as a reliable alternative to outages given the industries require constant power supply to perform efficiently. Another factor that may lead to the development of the market is the expansion of industries in remote areas or relying on outdated grid infrastructure. For example, such sectors as construction in developing regions may service form rental power for temporally accommodation before the permanent structure is built. Furthermore, the dependence and need for backup generators grow as the frequency and damage from natural disasters in the form of extreme weather changes intensify due to climate change.
-
The increasing need for rental power solutions in the global construction industry.
The increasing expansion of the construction sector worldwide is fueling the need for power rental services. Construction sites frequently do not have reliable access to grid power, particularly in distant or newly established regions. During different stages of construction projects, temporary power solutions are crucial for powering tools, machinery, lighting, and other operational needs. Infrastructure projects like building roads, exploring for oil and gas, and mining operations all heavily depend on power rental services. These projects usually need power solutions that are scalable and mobile, able to adjust to changing site conditions and operational needs. The power rental industry takes advantage of these chances by providing adaptable rental agreements, technical assistance on-site, and maintenance services for equipment, focusing mainly on the construction and infrastructure industries.
Restraints
-
Emergence of sustainable energy sources and customer choices.
The power rental market is encountering numerous challenges due to competition from interchangeable power alternatives, such as grid electricity, renewables, as well as energy storage. The advancing technological advancements in renewables and the decreasing costs of solar, wind, and battery technologies are attracting consumers toward more sustainable and decentralized energy solutions. At the same time, consumers’ preferences while using power generation alternatives are changing, as they increasingly prioritize efficient energy, eco-friendly characteristics, as well as long-term costs associated. These changes are challenging the leading positions of diesel generators in the power rental market. Various rental companies can respond by diversifying their core business providing hybrid power solutions, offering a wider range of energy management services, and integrating renewables into their service packages. However, a possible influencing factor is the government’s promotion of renewables and the creation of more renewable incentives, which directly pose significant competitive pressure on diesel generators.
KEY MARKET SEGMENTATION
By Power Rating
The above 750 kVA segment held 36% market share in 2023 and dominated the market because it is extensively used in industries with high power needs like oil & gas, mining, and large construction projects. This section provides significant power solutions specifically designed to meet the essential needs of critical infrastructure, proving to be essential for peak loads, emergencies, or scheduled maintenance in these sectors. Aggreko and Caterpillar are among the companies that offer rental solutions for heavy-duty tasks such as offshore drilling and large industrial plants.
The 75-375 kVA segment is accounted to experience a rapid CAGR during 2024-2032 because it is used in various industries such as construction, events, and utilities. These power rental options are commonly utilized for temporary power requirements in medium-sized projects or areas with inconsistent electricity supply. United Rentals and Atlas Copco offer power solutions in this sector, commonly utilized in construction sites, small events, or as a backup for essential services in hospitals or data centers.
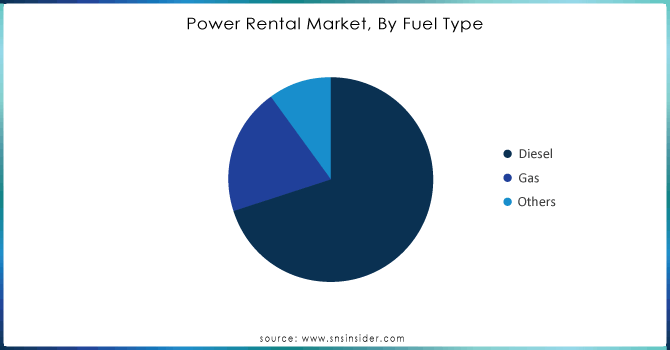
By Fuel Type
The diesel sector had a major market share of 50% in 2023, leading the market, because of its wide availability, effectiveness, and dependability. Diesel generators are preferred for their capability to offer continuous power for long durations, making them suitable for industrial, construction, and emergency backup uses. Caterpillar and Generac have effectively utilized diesel generators in significant ventures, like construction sites and mining operations, where uninterrupted power is crucial.
The gas segment is to grow rapidly during 2024-2032, due to rising environmental consciousness and the move to cleaner energy sources. Gas generators produce less harmful emissions than diesel generators, making them a more environmentally friendly choice for businesses looking to decrease their carbon footprint. For example, Aggreko is increasing its gas-powered rental options to keep up with the growing need for more environmentally friendly energy sources.
To Get Customized Report as per your Business Requirement - Request For Customized Report
By Application
The continuous load segment dominated in 2023 with more than 41% market share because of its steady demand from different industries. This part is crucial for activities that need a consistent power source, like building, mining, and big gatherings. Continuous Load applications frequently require generators to run for long periods, guaranteeing a continuous energy supply. For example, Aggreko provides electricity to isolated construction sites with limited access to a reliable power grid, allowing work to continue without any disruptions.
The peak load segment is expected to have the fastest CAGR during 2024-2032, as it helps to control sudden increases in energy demand. Industries frequently face changes in power needs, requiring extra assistance during peak demand times. This part provides the ability for businesses to easily increase their energy supply without making long-term commitments, giving them flexibility and scalability. For instance, Cummins provides temporary power solutions for occasions such as concerts or festivals, where there can be sudden spikes in electricity usage.
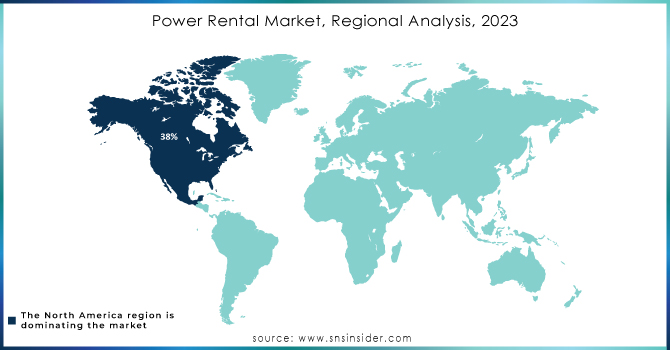
REGIONAL ANALYSES
North America led the market in 2023 with a 38% market share, supported by its strong infrastructure growth and rising need for temporary power solutions in different industries. Caterpillar Inc. and United Rentals are key players in the market, providing a variety of generators and rental equipment customized to meet particular customer requirements. The area's robust regulations and technological progress in rental options improve its market standing, making it a top pick for industries in need of dependable power solutions for emergencies or scheduled downtime.
Asia-Pacific region is going to be the fastest-growing market during the forecast period 2024-2032, due to fast urbanization, industrialization, and infrastructural projects in countries such as India, China, and Australia. The rising occurrence of natural calamities has also increased the need for temporary power options, resulting in a spike in rental services. Aggreko and Himoinsa are growing their presence in this area by offering creative and eco-friendly power solutions for a variety of purposes, ranging from building sites to big events.
KEY PLAYERS:
The key players in the Power Rental market are:
-
Aggreko (Diesel Generators, Gas Generators)
-
Caterpillar Inc. (Diesel Generator Sets, Mobile Power Modules)
-
Cummins Inc. (Mobile Generator Sets, Power Command System)
-
United Rentals, Inc. (Diesel Generators, Load Banks)
-
Herc Holdings Inc. (Mobile Power Generators, Portable Light Towers)
-
APR Energy (Mobile Gas Turbines, Fast Power Solutions)
-
Atlas Copco AB (QAC Mobile Generators, QES Portable Generators)
-
Ashtead Group plc (Mobile Power Generators, Standby Generators)
-
Generac Power Systems (Mobile Generators, Natural Gas Generators)
-
JCB Power Products (Diesel Generators, Rental Generators)
-
Wartsila Corporation (Mobile Gas Power Plants, Containerized Gas Generators)
-
Kohler Co. (Mobile Diesel Generators, Gas-Powered Generators)
-
Speedy Hire Plc (Temporary Power Generators, Portable Power Units)
-
Altaaqa Global (Temporary Power Plants, Hybrid Energy Solutions)
-
Himoinsa (Rental Generators, Hybrid Power Solutions)
-
Trinity Power Rentals (Temporary Power Systems, Load Banks)
-
Pramac (Mobile Diesel Generators, Portable Generators)
-
Generac Mobile Products (Mobile Light Towers, Mobile Power Generators)
-
Energy International (Portable Power Plants, Temporary Diesel Generators)
-
Bredenoord (Battery Hybrid Generators, Temporary Power Installations)
RECENT DEVELOPMENT
-
In August 2024, Aggreko introduced its newest mobile battery storage units, aiming to offer improved and more environmentally friendly power options. These systems aim to decrease fuel usage and carbon footprint, in line with increasing environmental regulations.
-
In February 2024, Caterpillar introduced a new series of generator sets designed for rental use, featuring improved fuel efficiency and reduced emissions to meet the growing need for environmentally-friendly rental power.
-
In March 2023, Atlas Copco launched modular power systems created specifically for big construction and industrial projects. These systems provide versatility and can be customized for different purposes such as backup, peak shaving, and continuous power.
-
In early 2023, Kohler introduced eco-friendly generators specifically designed for the increasing need for temporary power supply in the events and construction industries. These generators meet strict emission standards while delivering powerful output.
| Report Attributes | Details |
|---|---|
| Market Size in 2023 | USD 11.00 Billion |
| Market Size by 2032 | USD 19.28 Billion |
| CAGR | CAGR of 6.45% From 2024 to 2032 |
| Base Year | 2023 |
| Forecast Period | 2024-2032 |
| Historical Data | 2020-2022 |
| Report Scope & Coverage | Market Size, Segments Analysis, Competitive Landscape, Regional Analysis, DROC & SWOT Analysis, Forecast Outlook |
| Key Segments | • By Power Rating (Below 75 kVA, 75-375 kVA, 375-750 kVA, above 750 KVA) • By Fuel Type (Diesel, Gas, Others) • By Application (Continuous Load, Standby Load, Peak Load) • By End User (Mining, Construction, Utility, Events, Manufacturing, Oil & Gas, and Others) |
| Regional Analysis/Coverage | North America (US, Canada, Mexico), Europe (Eastern Europe [Poland, Romania, Hungary, Turkey, Rest of Eastern Europe] Western Europe] Germany, France, UK, Italy, Spain, Netherlands, Switzerland, Austria, Rest of Western Europe]), Asia Pacific (China, India, Japan, South Korea, Vietnam, Singapore, Australia, Rest of Asia Pacific), Middle East & Africa (Middle East [UAE, Egypt, Saudi Arabia, Qatar, Rest of Middle East], Africa [Nigeria, South Africa, Rest of Africa], Latin America (Brazil, Argentina, Colombia, Rest of Latin America) |
| Company Profiles | Aggreko, Caterpillar Inc., Cummins Inc., United Rentals, Inc., Herc Holdings Inc., APR Energy, Atlas Copco AB, Ashtead Group plc, Generac Power Systems, JCB Power Products, Wartsila Corporation, Kohler Co., Speedy Hire Plc, Altaaqa Global, Himoinsa, Trinity Power Rentals, Pramac, Generac Mobile Products, Energy International, Bredenoord |
| Key Drivers | • Ensuring consistent supply for various industries during power outages and climate issues. • The increasing need for rental power solutions in the global construction industry. |
| RESTRAINTS | • Emergence of sustainable energy sources and customer choices. |
Get in Touch
