Vacuum Sensor Market Size & Trends:
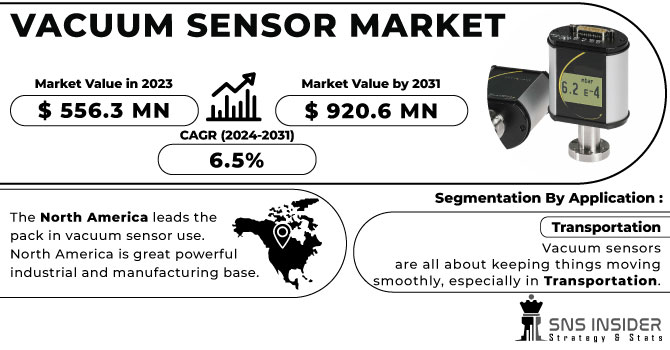
The Vacuum Sensor Market Size was valued at USD 626.24 million in 2023 and is estimated to reach USD 1084.7 million by 2032 and grow at a CAGR of 6.30% over the forecast period 2024-2032.
The vacuum sensor market is witnessing robust growth, fueled by the increasing adoption of smart and connected devices across various industries. As IoT-based systems become more prevalent, the integration of vacuum sensors in smart devices is enhancing performance monitoring and control, particularly in applications like robotics, HVAC, and industrial manufacturing. The rise of smart devices, such as robotic vacuum cleaners equipped with advanced vacuum sensors, is driving this trend.

Get More Information on Vacuum Sensor Market - Request Sample Report
For instance, innovations like Roborock’s Matter-enabled vacuum with OmniGrip robotic arms, unveiled at CES 2025, illustrate how vacuum sensors can improve cleaning efficiency and multitask in real-time by detecting and relocating household objects. In response to the pandemic-driven shift towards touchless technology, new sensor innovations, such as the organic cage-based humidity sensor, are contributing to advanced touchless platforms in human-machine interaction (HMI) systems. This humidity sensor, with an ultrafast response/recovery time of 1 second and 3 seconds, along with remarkable stability (over 800 cycles) across relative humidity (RH) changes from 11% to 95%, sets a foundation for integrating touchless interfaces in various applications, including vacuum systems. These sensors’ high responsiveness and stability are pivotal for next-generation systems that require minimal human contact. the demand for energy-efficient solutions across sectors is propelling the need for vacuum sensors. As industries strive to optimize energy usage, vacuum sensors play a crucial role in monitoring vacuum systems, detecting leaks, and ensuring system integrity. These sensors also support automation, streamlining operations and reducing manual intervention in industrial environments. Technological advancements in sensor technologies, particularly MEMS-based vacuum sensors, are contributing to the market's expansion. These sensors offer benefits like high accuracy, miniaturization, and greater durability, making them ideal for IoT applications. Furthermore, the growing focus on sustainability and efficiency in sectors like automotive and smart homes is fueling the adoption of advanced vacuum sensors, as they contribute to improved operational performance and reduced waste. The ongoing evolution of IoT technologies and the integration of vacuum sensors into next-generation smart devices underscore the transformative impact these sensors are having across various industries.
Vacuum Sensor Market Dynamics
Drivers
-
Vacuum sensors ensure precision in pressure and vacuum conditions, boosting efficiency and quality across industries.
Vacuum sensors are gaining traction across various industries due to their critical role in maintaining precise pressure and vacuum conditions, which are vital for operational efficiency, safety, and product quality. Sectors such as semiconductor manufacturing, food processing, automotive, and packaging increasingly depend on these sensors to enhance productivity, reduce costs, and improve quality. In semiconductor manufacturing, vacuum sensors ensure the maintenance of ultra-high vacuum conditions during deposition and etching, essential for producing defect-free semiconductors. In food processing, these sensors help regulate vacuum levels during processes like freeze-drying and vacuum cooling, preserving the quality, flavor, and nutritional content of food products. The packaging industry benefits as well, particularly in vacuum-sealing food and pharmaceuticals, where accurate vacuum control prevents spoilage. In the automotive sector, vacuum sensors are essential for ensuring the proper functioning of brake assist systems and emissions testing, contributing to vehicle safety and reliability. As industries adopt automation and IoT technologies, vacuum sensors are increasingly integrated into smart systems for real-time monitoring, predictive maintenance, and optimized performance. The demand for energy-efficient solutions and the rise of connected devices further fuel the adoption of vacuum sensors, cementing their role as an indispensable tool for modern industrial processes. These advancements in sensor technology are helping industries streamline operations and improve overall productivity.
Restraints
-
A key barrier in the vacuum sensor market is the complex calibration process required to ensure accurate readings and optimal performance.
Vacuum sensors, especially those used in precision-dependent industries, need to be calibrated regularly to maintain their accuracy and efficiency. Improper calibration can lead to inaccurate measurements, resulting in faulty operations, which is particularly critical in sectors such as semiconductor manufacturing, pharmaceuticals, and food processing, where precise pressure control is vital. The calibration process itself can be intricate, often requiring specialized tools, technical expertise, and strict adherence to manufacturer recommendations to achieve reliable results. This can be time-consuming and costly, especially for businesses with limited access to the required calibration equipment and knowledge. Moreover, discrepancies in calibration can lead to substantial production errors, safety risks, and inefficiencies, increasing downtime and operational costs. This is particularly challenging for industries that operate with tight tolerances, where even slight measurement deviations can result in quality issues, product defects, or system failures. Additionally, vacuum gauge calibration services, offered by companies such as Leybold and DigiVac, may not always be accessible or affordable for all businesses, further complicating the widespread use of vacuum sensors. As industries increasingly adopt vacuum sensors for enhanced performance and automation, the demand for proper calibration is likely to rise, posing a challenge for market participants who need to ensure their sensors maintain high standards of precision over time.
Vacuum Sensor Market Segmentation Overview
By Type
The Pressure Sensor segment holds the largest share in the Vacuum Sensor Market, representing approximately 39% in 2023. This dominance is attributed to the critical role pressure sensors play in maintaining precise pressure levels across various industrial applications, including semiconductor manufacturing, food processing, automotive, and packaging. In semiconductor manufacturing, accurate pressure control is vital to avoid contamination during processes like deposition and etching. Similarly, in the food processing sector, pressure sensors are essential for maintaining the correct pressure during processes like vacuum cooling and freeze-drying, which preserve the nutritional value and quality of food. The packaging industry benefits from pressure sensors in vacuum-sealed packaging, ensuring product freshness and safety.
By Application
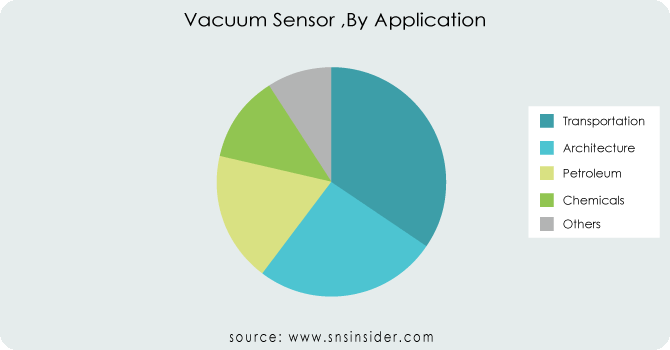
The petroleum segment dominated the Vacuum Sensor Market in 2023, accounting for approximately 35% of the market share. This dominance is attributed to the critical role vacuum sensors play in the oil and gas industry, particularly in refining, exploration, and production processes. In oil refineries, vacuum sensors ensure the precise control of pressure and vacuum conditions, which are essential for processes like distillation and evaporation. These sensors help monitor and maintain optimal vacuum levels to enhance product yield and quality. Additionally, vacuum sensors are used in the exploration phase to monitor well conditions and ensure the safety of operations. With the growing global demand for petroleum products and ongoing advancements in oil extraction technologies, the petroleum segment’s reliance on vacuum sensors is expected to continue driving market growth in the coming years.

Get Customized Report as per Your Business Requirement - Request For Customized Report
Vacuum Sensor Market Regional Analysis
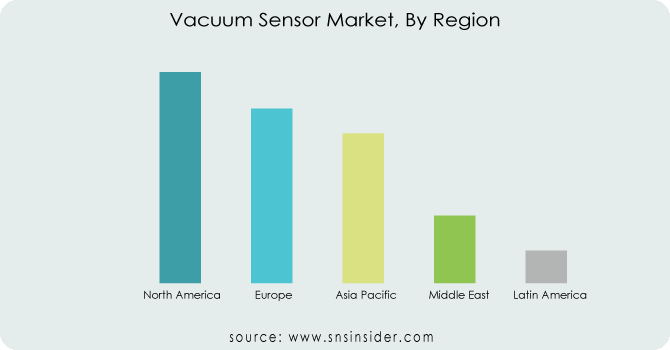
North America dominated the Vacuum Sensor Market in 2023, holding around 35% of the revenue share, primarily driven by the United States and Canada’s advanced industrial sectors. The U.S. continues to lead in semiconductor manufacturing, automotive, aerospace, and food processing industries, all of which rely heavily on vacuum sensors for precise pressure and vacuum management. The rapid adoption of automation and IoT technologies further bolsters the demand for vacuum sensors, particularly in manufacturing and cleanroom environments. Additionally, significant investments in renewable energy and advanced manufacturing technologies drive the need for highly efficient vacuum sensors. Canada’s strong industrial growth, particularly in clean tech and food processing, also contributes to the region’s dominance. North America's technological leadership and focus on high-precision manufacturing ensure its continued leadership in the vacuum sensor market.
Asia-Pacific is the fastest-growing region in the Vacuum Sensor Market from 2024 to 2032, driven by rapid industrialization and technological advancements. Countries like China, Japan, South Korea, and India are witnessing strong demand for vacuum sensors across various industries such as semiconductor manufacturing, automotive, and food processing. China’s heavy investment in automation and smart technologies boosts the need for precise vacuum conditions in manufacturing. Japan and South Korea are key players in semiconductor production, requiring vacuum sensors for maintaining ultra-high vacuum levels. India’s expanding automotive and food processing sectors also contribute to the growing adoption of vacuum sensors for enhanced efficiency and safety.

Key Players
Some of the Major players in Vacuum Sensor Market along with their product:
-
AMETEK Inc.: (Vacuum Transducers, Digital Vacuum Gauges)
-
Honeywell International Inc.: (Pressure and Vacuum Sensors, MEMS-Based Sensors)
-
MKS Instruments, Inc.: (Pirani Vacuum Gauges, Hot Cathode Ionization Gauges)
-
Pfeiffer Vacuum Technology AG: (Capacitive Vacuum Sensors, Helium Leak Detectors)
-
INFICON Holding AG: (Quartz Gauge Sensors, Thin Film Vacuum Sensors)
-
Edwards Vacuum: (Active Pirani Sensors, Capacitance Manometers)
-
Agilent Technologies: (Vacuum Pressure Gauges, Vacuum System Controllers)
-
Setra Systems: (Capacitance-Based Vacuum Sensors, Pressure Transducers)
-
Vacuubrand, Inc.: (Chemical-Resistant Vacuum Sensors, Diaphragm Vacuum Gauges)
-
InvenSense (a TDK Company): (MEMS Vacuum Sensors, High-Performance Pressure Sensors)
-
Thyracont Vacuum Instruments GmbH: (Smartline Vacuum Transmitters, Digital Vacuum Meters)
-
ULVAC Technologies, Inc.: (Ionization Gauges, Thermal Conductivity Gauges)
-
Kurt J. Lesker Company: (Vacuum System Monitors, Residual Gas Analyzers)
-
Panasonic Corporation: (Miniature Vacuum Sensors, MEMS-Based Pressure Sensors)
-
Teledyne Hastings Instruments: (Thermocouple Vacuum Gauges, Mass Flow Sensors)
-
Oerlikon Leybold Vacuum GmbH: (Compact Pirani Gauges, Vacuum Controllers)
-
Anritsu Corporation: (High-Precision Vacuum Gauges, Pressure Sensors)
-
Sensirion AG: (Digital Vacuum Sensors, Multi-Gas Sensing Modules)
-
Brooks Automation, Inc.: (Capacitive Pressure Transducers, Vacuum Gauge Controllers)
-
Micron Technology, Inc.: (MEMS-Based Vacuum and Pressure Sensors)
List of suppliers that provide raw materials and components for manufacturing vacuum sensors, categorized by material/component type:
1. Semiconductor and MEMS Components Suppliers
-
Texas Instruments (TI): Supplies MEMS chips and signal processing ICs.
-
STMicroelectronics: Provides MEMS sensors and microcontrollers.
-
Analog Devices, Inc.: Supplies amplifiers, ADCs, and signal processors.
-
NXP Semiconductors: Offers sensor interface chips and embedded processors.
2. Metals and Alloys Suppliers
-
Allegheny Technologies Inc. (ATI): Supplies specialty alloys like stainless steel and titanium for sensor housings.
-
Carpenter Technology Corporation: Provides high-performance alloys used in vacuum sensor components.
-
Outokumpu Oyj: Supplies stainless steel and nickel-based materials.
3. Glass and Ceramics Suppliers
-
Schott AG: Supplies glass-to-metal sealing components used in vacuum sensors.
-
CoorsTek, Inc.: Provides technical ceramics for insulating and sealing applications.
-
Morgan Advanced Materials: Supplies ceramic substrates and components.
4. Electronics and PCB Components Suppliers
-
Murata Manufacturing Co., Ltd.: Supplies capacitors, resistors, and RF modules.
-
Samsung Electro-Mechanics: Provides electronic components for circuit boards.
-
TT Electronics: Supplies custom PCBs and electronic assemblies.
5. Polymer and Sealing Materials Suppliers
-
DuPont: Supplies high-performance polymers like Teflon and Vespel for seals and insulation.
-
3M Company: Provides adhesives, coatings, and tapes for sensor assemblies.
-
Parker Hannifin: Supplies o-rings, seals, and gaskets for vacuum applications.
6. Thin Film and Coating Material Suppliers
-
Materion Corporation: Supplies sputtering targets and thin-film deposition materials.
-
Evonik Industries AG: Provides specialty coatings and additives for sensor components.
-
Heraeus Group: Supplies precious metal coatings and thin-film materials.
7. Piezoelectric Materials Suppliers
-
CTS Corporation: Supplies piezoelectric ceramics for pressure sensing.
-
Kistler Instrumente AG: Provides piezoelectric components for vacuum applications.
8. Packaging and Housing Suppliers
-
Kyocera Corporation: Supplies ceramic and metallic housings for vacuum sensors.
-
Amkor Technology: Provides semiconductor packaging solutions.
9. Gas Calibration and Leak Detection Materials
-
Linde plc: Supplies specialty gases for vacuum sensor calibration.
-
Air Products and Chemicals, Inc.: Provides industrial and specialty gases for leak detection and vacuum testing.
10. Wire and Interconnect Suppliers
-
Molex: Supplies connectors, cables, and interconnect systems.
-
TE Connectivity: Provides electronic connectors and wiring for vacuum sensor integration.
Recent News
-
Jan. 6, 2025, Xiaomi's Robot Vacuum Cleaner S10 is confirmed to launch at the Smarter Living 2024 event in India, showcasing advanced features for a more efficient cleaning experience.
-
Jan. 6, 2025, Roborock unveiled the Saros Z70 at CES 2025, featuring the OmniGrip robotic arm, which can pick up and relocate household items like socks and toys.
| Report Attributes | Details |
| Market Size in 2023 | USD 626.24 Million |
| Market Size by 2032 | USD 1084.7 Million |
| CAGR | CAGR of 6.30 % From 2024 to 2032 |
| Base Year | 2023 |
| Forecast Period | 2024-2032 |
| Historical Data | 2020-2022 |
| Report Scope & Coverage | Market Size, Segments Analysis, Competitive Landscape, Regional Analysis, DROC & SWOT Analysis, Forecast Outlook |
| Key Segments | • By Type (Temperature Sensor, Pressure Sensor, Flow Sensor, And Others) • By Application (Transportation, Architecture, Petroleum, Chemical, And Others) |
| Regional Analysis/Coverage | North America (US, Canada, Mexico), Europe (Eastern Europe [Poland, Romania, Hungary, Turkey, Rest of Eastern Europe] Western Europe] Germany, France, UK, Italy, Spain, Netherlands, Switzerland, Austria, Rest of Western Europe]), Asia Pacific (China, India, Japan, South Korea, Vietnam, Singapore, Australia, Rest of Asia Pacific), Middle East & Africa (Middle East [UAE, Egypt, Saudi Arabia, Qatar, Rest of Middle East], Africa [Nigeria, South Africa, Rest of Africa], Latin America (Brazil, Argentina, Colombia, Rest of Latin America) |
| Company Profiles | AMETEK Inc., Honeywell International Inc., MKS Instruments, Inc., Pfeiffer Vacuum Technology AG, INFICON Holding AG, Edwards Vacuum, Agilent Technologies, Setra Systems, Vacuubrand, Inc., InvenSense (a TDK Company), Thyracont Vacuum Instruments GmbH, ULVAC Technologies, Inc., Kurt J. Lesker Company, Panasonic Corporation, Teledyne Hastings Instruments, Oerlikon Leybold Vacuum GmbH, Anritsu Corporation, Sensirion AG, Brooks Automation, Inc., and Micron Technology, Inc. are key players in the vacuum sensor market. |
| Key Drivers | • Vacuum sensors ensure precision in pressure and vacuum conditions, boosting efficiency and quality across industries. |
| Restraints | • A key barrier in the vacuum sensor market is the complex calibration process required to ensure accurate readings and optimal performance. |

