
Virtual Goods Market Report Scope & Overview:
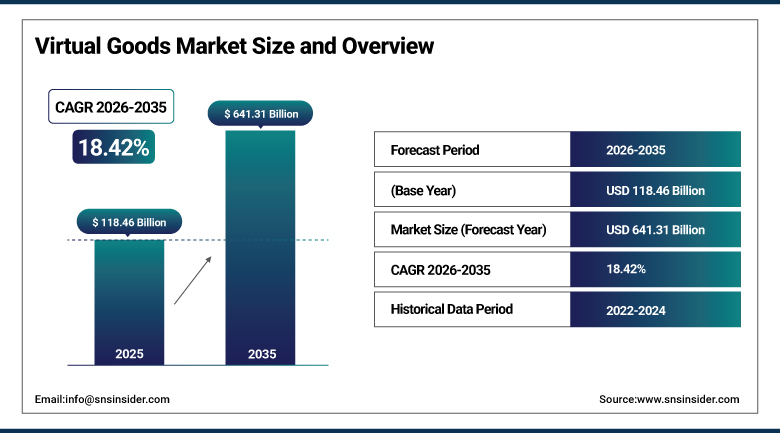
The Virtual Goods Market size was valued at USD 118.46 billion in 2025 and is expected to reach USD 641.31 billion by 2035, growing at a CAGR of 18.42% from 2026–2035.
The virtual goods market is currently experiencing significant growth on a worldwide scale due to increased demand for virtual ownership and virtual economies within applications. Virtual goods have increasingly become more popular among gamers, social media users, and metaverses, especially virtual items, virtual currency, and digital collectibles. The development of the industry has also been fueled by blockchain technology, NFTs, and virtual AR/VR environments. Another major driver behind the development of the industry includes gaming ecosystems and creator virtual economies. Various industries, including gaming and entertainment, have quickly adopted virtual economy models.
The governance strategies in digital currency, the use of blockchain technology, and security of transactions have become important factors affecting the virtual product industry. The EU is enhancing governance concerning the digital asset realm through MiCA regulation to achieve safe growth within the virtual economy. The US government is encouraging innovation in the digital finance and gaming domain through regulatory measures and platform creation. China’s efforts have been centered on the management of growth in online gaming and virtual currency industries.
To Get more information Virtual Goods Market - Request Free Sample Report
Virtual Goods Market Trends
-
The growth in mobile gaming and in-app purchases will lead to higher consumption levels of virtual goods and digital money.
-
The increased use of metaverse platforms will drive the use of virtual assets like avatars, skins, and virtual real estate.
-
The adoption of personalized experiences using AI will boost engagement through recommendations of virtual goods that suit each platform user’s taste.
-
The rise of virtual asset ownership and trading in blockchain platforms will drive secure transactions within the gaming and metaverse platforms.
-
The adoption of cross-platform interoperability will enable users to use virtual goods across gaming and blockchain platforms.
-
The popularity of social media monetization services will create digital economies via virtual gifts and tipping systems.
U.S. Virtual Goods Market Size Outlook
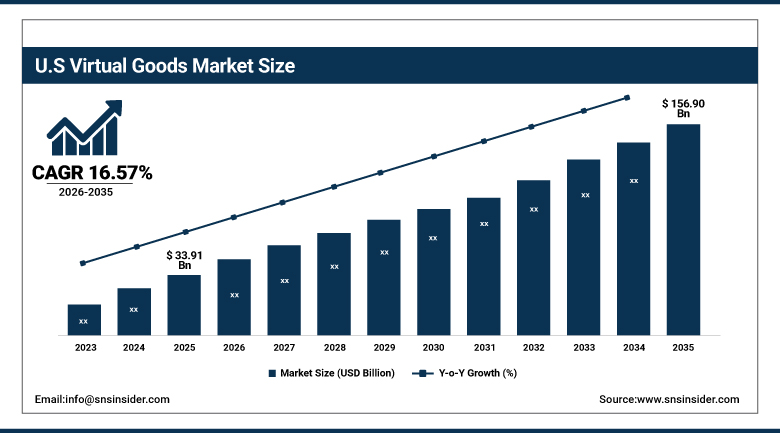
The U.S. Virtual Goods Market was valued at USD 33.91 billion in 2025 and is expected to reach around USD 156.90 billion by 2035, growing at a CAGR of 16.57% from 2026–2035.
The U.S. virtual goods market industry growth is occurring at a strong pace owing to growing demand for in-game purchases, collectible items in digital form, and virtual currencies. The growth in the market is supported by the presence of high penetration rates of mobile games, gaming console, and social media monetization platforms. There can be a correlation between growing usage of metaverses, digital assets through blockchains, and personalization through artificial intelligence.
The United States government is helping to boost the virtual goods marketplace by implementing regulations on digital currencies, games, and online transaction security. Regulations regarding blockchain technology, fintech advancements, and digital tax are creating a sense of trust in virtual transactions. Federal and state measures are also contributing towards safer digital trade and greater transparency on platforms. Despite the lack of proper regulations, the United States continues to be a global leader when it comes to virtual trading and gaming firms.
Virtual Goods Market Segment Analysis
-
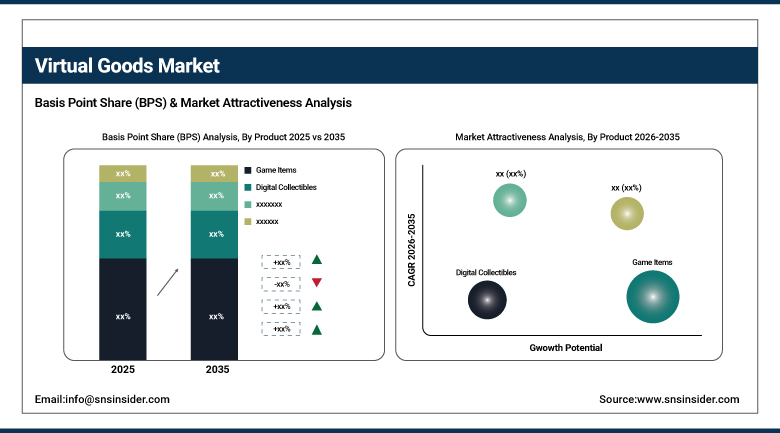
By Product, game items dominated the virtual goods market with 44.35% share in 2025; while virtual assets (land) is the fastest growing segment.
-
By Platform, mobile gaming dominated the virtual goods market with 39.88% share in 2025; while metaverse platforms is the fastest growing segment.
-
By Technology, traditional systems dominated the virtual goods market with 59.84% share in 2025; while AR/VR-based is the fastest growing segment.
-
By Application, gaming & entertainment dominated the virtual goods market with 54.63% share in 2025; while education & training is the fastest growing segment.
By Product, game items dominated the virtual goods market, while virtual assets (land) is the fastest growing segment.
The Game Items segment was the major contributor to the virtual goods market by generating the largest revenue in 2025 owing to significant integration within mobile and PC game environments. This consists of skins, weapons, and other accessories which help improve the gaming experience of the user. Consumer willingness to spend on such purchases helps ensure dominance. The continuous release of new updates, seasonal events, and competitive gaming practices keep driving demands for these virtual goods.
The Virtual Assets (Land) segment is expected to witness the highest CAGR in the coming years owing to the fast growth of metaverse platforms. People have started showing greater willingness to invest in virtual assets including virtual land owing to increased social activity in virtual worlds and participation in gaming. Adoption of blockchain technology in owning virtual land helps guarantee the transactions associated with these virtual assets.
By Platform, mobile gaming dominated the virtual goods market, while metaverse platforms is the fastest growing segment.
Mobile Gaming segment held the highest market share in the virtual goods market in terms of revenue generation in 2025. The reason behind this segment’s dominance is due to high smartphone penetration and popularity of free-to-play games. Models like in-app purchases, microtransactions, and rewards systems make the end-users motivated towards purchasing virtual goods. Accessibility, ease, lower entry barriers, and engagement through casual games and competitive games have made the purchase of virtual goods more sustainable.
Metaverse Platforms segment is estimated to register the highest CAGR during 2026-2035. The growth driver of this segment is due to higher adoption of immersive digital environments where users can interact with other users, engage socially, and conduct trading of virtual goods. Higher investments in AR/VR technology increase the adoption rate of virtual goods. The development of persistent virtual world technology, digital identity, and blockchain technology will boost the metaverse-based economy further.
By Technology, traditional systems dominated the virtual goods market, while AR/VR-Based is the fastest growing segment.
Traditional Systems segment accounted for the majority share in the virtual goods market in 2025 owing to the presence of well-established gaming platforms and in-app purchase systems with centralization. These systems offer security in transactions, ease of integration, and higher user reach in mobile and console games. Traditional systems are favored by game developers because of their stability of business model and lower level of technology required than blockchain systems.
AR/VR-Based segment is anticipated to register the highest CAGR during 2026-2035 owing to the increased adoption of advanced immersive technologies in the gaming sector and virtual worlds/metaspace. The demand for immersive technologies is increasing because of the need for realistic virtual environment, interaction with avatars, and immersive social gaming experience. Growth in the adoption of affordable VR headsets, AR-enabled smartphone applications, and development of spatial computing technology is contributing to the rising usage rate of immersive technologies.
By Application, gaming & entertainment dominated the virtual goods market, while education & training is the fastest growing segment.
Virtual Gaming & Entertainment sector was the leading market segment in the virtual goods market in terms of having the largest share of revenues in 2025. It was primarily attributed to the large number of gamers worldwide along with their penchant to buy virtual assets. High user engagement in multiplayers, esports, and live gaming drives demand for skins and avatars in addition to other virtual products. The gaming ecosystem across mobile, console, and PC gaming platforms contributes to monetizing customers.
Education & Training segment was projected to witness the fastest growth rate in terms of CAGR from 2026 to 2035, owing to the increased adoption of immersive learning technologies. Usage of virtual goods within simulations, gamification methods, and metaverse classrooms enhances engagement with students. Usage of digital assets in institutional and corporate training environments is increasing. Use of augmented reality and virtual reality tools makes learning more engaging and realistic.
Regional Analysis
|
Region |
Major Country |
Share within Region, 2025(%) |
|---|---|---|
|
North America |
United States |
78.60% |
|
Europe |
Germany |
20.18% |
|
Asia Pacific |
China |
28.76% |
|
Middle East & Africa |
UAE |
6.80% |
|
Latin America |
Brazil |
7.84% |
North America Virtual Goods Market Insights
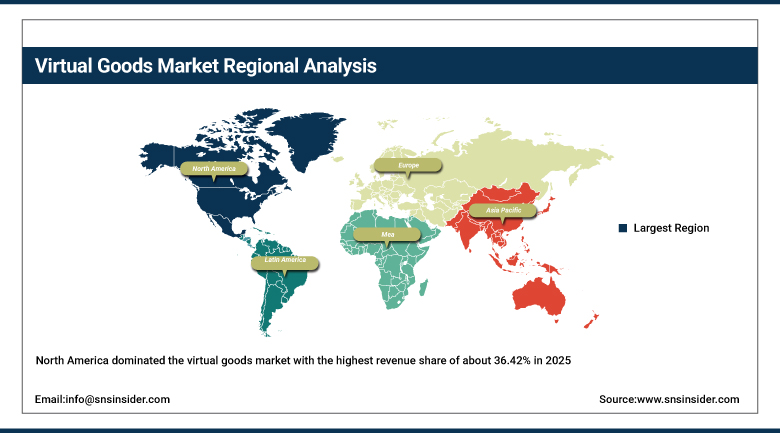
North America dominated the virtual goods market with the highest revenue share of about 36.42% in 2025 due to strong gaming ecosystem, high consumer spending on digital content, and advanced internet infrastructure supporting large-scale in-app purchases. The region shows strong demand for virtual items, digital currencies, skins, and metaverse assets across mobile, console, and PC platforms. Increasing adoption of AR/VR technologies, blockchain-based digital ownership, and AI-driven personalization is further supporting market growth. The presence of major players such as Microsoft, Meta, Apple, Google, and Roblox strengthens the regional ecosystem. High engagement in gaming and social media platforms across the United States and Canada is driving continuous monetization of virtual goods.
Get Customized Report as per Your Business Requirement - Enquiry Now
Europe Virtual Goods Market Insights
Europe accounts for an important share of the virtual products market, due to the presence of a robust gaming culture, digital advancements, and supportive regulatory structure for conducting digital transactions. Several European nations like Germany, UK, France, Italy, and Spain exhibit widespread use of virtual products, online gaming, and monetization through social networking sites. The EU’s digital laws like MiCA and GDPR are setting new standards for virtual asset usage and data protection. The rising demand for esport, metaverse, and blockchain-based marketplaces is aiding growth in the market.
Asia Pacific Virtual Goods Market Insights
Asia Pacific segment is expected to grow at the fastest CAGR and holds a revenue share of about 20.36% in 2025 due to massive gaming population, rapid smartphone penetration, and strong digital payment adoption. Countries such as China, India, Japan, and South Korea are leading in mobile gaming, esports, and virtual item consumption. Expanding metaverse ecosystems and increasing use of in-app purchases are accelerating market growth. Government support for digital economy development and local gaming industries is further boosting adoption. Rising youth population and high engagement in online entertainment platforms are driving strong demand for virtual goods across the region.
Middle East & Africa and Latin America Virtual Goods Market Insights
The Middle East & Africa and Latin America can be considered upcoming markets for virtual goods because of higher internet usage and smartphone adoption. Countries like UAE, Saudi Arabia, South Africa, Brazil, and Mexico are experiencing mobile game revenue growth and monetizing social media networks. The growth will be helped by advancements in digital payments and greater participation from young people in entertainment online. Increased participation in esport events, virtual events, and digital entertainment platforms will drive the growth of demand.
Market Dynamics
Growth Drivers: Rapid expansion of digital gaming ecosystems and in-app purchase driven economies across global platforms
There is significant growth in the sectors of online gaming, electronic sports, and mobile games, which has led to increased consumption of virtual goods worldwide. Players have been found making in-app purchases in terms of skins, avatars, and in-game currency in different gaming platforms such as smartphones, PCs, and consoles. Frequent upgrades and seasonal content in gaming apps are ensuring continued use and purchase of virtual products. Increasing adoption of smartphones and affordable Internet services is leading to higher reach in numbers.
Restraints: High dependency on regulatory uncertainty and lack of unified global standards for digital assets
The absence of a legal framework at an international level that governs virtual goods and currencies results in confusion on the part of market participants. There is no uniformity in the way each country has implemented rules for conducting transactions involving gaming and cryptocurrency. Taxation, consumer protection laws, and data privacy issues are some of the factors that hinder market growth. This poses problems for businesses due to difficulty in compliance across different countries. This is why it becomes challenging for companies to make investments.
Opportunities: Rising adoption of AI-driven personalization and cross-platform digital asset interoperability systems
AI is facilitating highly customized virtual goods suggestions according to user interests and behavior. Engagement levels are rising along with conversion rates owing to the personalization. Interoperability is facilitating transferability of digital goods across different gaming and social media platforms. Blockchain technology is reinforcing the process and ensuring better portability and ownership rights for digital assets. Companies are now emphasizing the development of consistent digital experiences in order to boost user retention. These innovations are leading to new growth opportunities for the global virtual goods market.
Recent Developments
-
2026: Fortnite's digital asset economy received additional improvements due to Epic Games by introducing UEFN, allowing gamers to purchase their digital products directly within the game.
-
2026: Metaverse improved its Horizon Worlds virtual world platform with the introduction of AI-powered avatar and virtual shopping capabilities, making demands on more customizable digital identities and virtual assets.
-
2025: The Roblox marketplace along with improvements in development tools boosted the sale of virtual assets, including virtual skin accessories, etc.
-
2025: An interoperable platform was developed by Epic Games and Unity that facilitated virtual assets management within gaming ecosystems.
-
2024: In-game purchases powered virtual economy usage in games and metaverse gaming platforms.
Virtual Goods Companies are:
-
Abengoa Solar
-
Acciona Energía
-
BrightSource Energy
-
GlassPoint Solar
-
Siemens Energy
-
ENGIE
-
Aalborg CSP
-
SENER
-
TSK Group
-
Cobra Instalaciones y Servicios
-
SCHOTT
-
Rioglass Solar
-
ANDRITZ
-
Larsen & Toubro (L&T)
-
Bharat Heavy Electricals Limited (BHEL)
-
Thermax Limited
-
Fichtner GmbH & Co. KG
-
TotalEnergies
Virtual Goods Market Report Scope:
| Report Attributes | Details |
|---|---|
| Market Size in 2025 | USD 118.46 Billion |
| Market Size by 2035 | USD 641.31 Billion |
| CAGR | CAGR of 18.42% From 2026 to 2035 |
| Base Year | 2025 |
| Forecast Period | 2026-2035 |
| Historical Data | 2022-2024 |
| Report Scope & Coverage | Market Size, Segments Analysis, Competitive Landscape, Regional Analysis, DROC & SWOT Analysis, Forecast Outlook |
| Key Segments | • By Product (Game Items, Digital Collectibles, Virtual Currency, Virtual Assets (Land), Virtual Services) • By Platform (PC/Console Gaming, Mobile Gaming, Metaverse Platforms, Social Platforms, Blockchain Marketplaces) • By Technology (Blockchain-Based, Traditional Systems, AR/VR-Based, Cloud-Based) • By Application (Gaming & Entertainment, Social Media, Virtual Commerce & Events, Education & Training) |
| Regional Analysis/Coverage | North America (US, Canada), Europe (Germany, UK, France, Italy, Spain, Russia, Poland, Rest of Europe), Asia Pacific (China, India, Japan, South Korea, Australia, ASEAN Countries, Rest of Asia Pacific), Middle East & Africa (UAE, Saudi Arabia, Qatar, South Africa, Rest of Middle East & Africa), Latin America (Brazil, Argentina, Mexico, Colombia, Rest of Latin America). |
| Company Profiles | Abengoa Solar, ACWA Power, Acciona Energía, BrightSource Energy, GlassPoint Solar, Siemens Energy, ENGIE, Enel Green Power, Aalborg CSP, SENER, TSK Group, Cobra Instalaciones y Servicios, SCHOTT, Rioglass Solar, ANDRITZ, Larsen & Toubro (L&T), Bharat Heavy Electricals Limited (BHEL), Thermax Limited, Fichtner GmbH & Co. KG, TotalEnergies |
Frequently Asked Questions
North America dominated the market in 2025 due to strong gaming ecosystem, high consumer spending, and advanced digital infrastructure.
Gaming & Entertainment dominated the market in 2025 due to high user engagement and strong in-game monetization models.
Rising demand for in-game purchases, digital ownership, and metaverse-based virtual economies is driving the market.
The virtual goods market was valued at USD 118.46 billion in 2025.
The virtual goods market is expected to grow at a CAGR of 18.42% from 2026 to 2035.
