Digital Out of Home (DOOH) Market Report Scope and Overview:
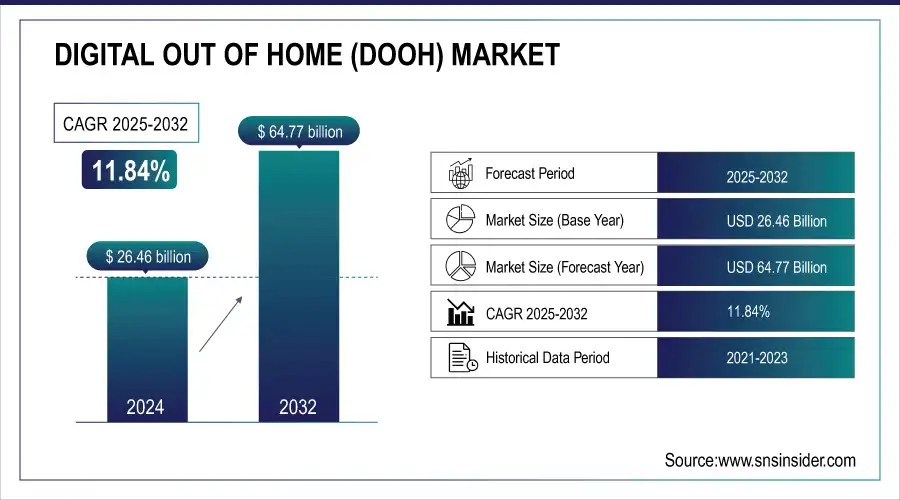
The Digital Out of Home (DOOH) Market Size was valued at USD 26.46 Billion in 2024 and is expected to reach USD 64.77 Billion by 2032 and grow at a CAGR of 11.84% over the forecast period 2025-2032.
The Digital Out of Home Market is changing at a fast pace due to the development of technology, government support, and the shift in consumer behavior. In 2023 and 2024, governments across the globe focused on developing digital infrastructure and integrating DOOH solutions into urban planning and smart city initiatives. For example, the United States Department of Transportation supported DOOH displays in public transit systems, and European nations integrated digital advertising into sustainability-oriented urban projects. Meanwhile, emerging economies in Asia-Pacific adopted DOOH to modernize infrastructure and boost tourism. This has positioned DOOH as a critical component of public and commercial communication.
Get more information on Digital Out Of Home Market - Request Sample Report
Technological advancements in the Digital out of Home Market have been fueled by innovations. The merging of artificial intelligence and machine learning revolutionized the way content is delivered and enabled hyper-targeted and real-time advertising based on audience demographics, weather conditions, or location data. Additionally, the deployment of 5G networks in 2024 has made programmatic advertising more efficient, speeding up and making updates to digital displays more reliable. The global sustainability goals of energy efficiency and solar-powered digital billboards are further aligned in reducing operating costs and environmental impact.
Digital Out of Home (DOOH) Market Highlights:
-
Rising Consumer Interaction: Touch-enabled displays and kiosks are creating immersive experiences, allowing brands to integrate physical and digital spaces and deliver targeted content to diverse audiences.
-
Growth Opportunities: Expansion of urban areas, increasing digital literacy, and government initiatives for public information dissemination are boosting demand for innovative DOOH solutions.
-
Event-Driven Adoption: Global advertising events and sporting tournaments in 2023–2024 accelerated digital display adoption, showcasing DOOH’s potential in high-visibility scenarios.
-
Programmatic Advertising: In 2024, programmatic ad buying transformed DOOH, enabling real-time, data-driven campaigns with hyper-targeting, dynamic ad optimization, and improved audience engagement.
-
Urbanization Impact: 60% of urban areas now include DOOH in public spaces, making it an effective platform for brands to reach the growing city population.
-
Cost Barrier Restraint: High initial investments (over USD 200,000 for a single digital billboard) and ongoing operational costs limit adoption, particularly for SMEs, restricting market diversification.
Consumer interaction through the Digital out of Home Market is shifting. The touch-enabled display and kiosks bring more interaction towards the customers and result in a truly immersive experience for them. In this regard, brands are focusing on such technologies so that the integration of physical as well as digital spaces is feasible, and specific content can reach diverse audiences at the right time.
The Digital out of Home Market holds numerous opportunities for future advertisers, technology providers, and urban planners. Demand for innovative advertising solutions will continue to rise due to further expansion of urban areas and digital literacy. Moreover, government initiatives for public information dissemination and community engagement through DOOH platforms are also likely to increase. Several global advertising events and sporting tournaments, such as the 2023 and 2024 events, further accelerated the adoption of digital displays in the world and showed the potential of DOOH in high-visibility scenarios. This combination of technology, policy, and consumer trends places the Digital out of Home Market at a very exciting point, ready to achieve significant growth in sustaining its expansion for businesses that can reach their audience in innovative, impactful ways.
Digital Out of Home (DOOH) Market Drivers:
-
Programmatic ad buying in DOOH witnessed an increase in 2024 and transformed the whole buying process for advertising.
Programmatic advertising is revolutionizing DOOH, as advertisers can now automatically buy ads through real-time data. This helps to deliver campaigns with hyper-targeting, hence improving audience engagement and ROI. According to research, 70% of marketers switched to programmatic approaches in DOOH campaigns, signifying the growing attraction towards it. Dynamic ad optimization, for instance, by weather, traffic, or audience demographics is a game-changer, making for a data-driven advertising ecosystem.
-
Global urbanization rate increased in 2024, increasing demand for digital advertising in urban spaces.
As cities grow, Digital out of Home is integral to the city environment. According to research, 60% of all urban areas include DOOH within public spaces that include transportation points and shopping locations. Digital displays and smart kiosks connect with the constantly increasing urban citizenry by projecting impactful and contextual messages. Lifestyle in the cities exposes more of DOOH hence becoming an excellent platform for companies looking to place their brands across busy cities.
Digital Out of Home (DOOH) Market Restraints:
-
High Initial Investment In Digital Infrastructure Hampers Widespread Adoption.
The adoption of DOOH solutions is expensive, as SMEs are discouraged by huge investments in digital screens, application software, and maintenance infrastructure. Governments and industry reports indicate that the average cost of installing a single high-definition digital billboard exceeds USD 200,000. Although big businesses can afford to spend money for such investments with greater returns, smaller businesses cannot.
Besides, huge operational costs in terms of energy consumption and software updates also create a burden on budget-constrained entities. A 2023 report by the International Advertising Bureau mentioned that 40% of SMEs have cited cost barriers as a significant obstacle to entering the Digital out of Home Market. This gap is only limiting the scope of business for the market by diversified business units and regions; therefore, an inexpensive solution becomes imperative.
Digital Out of Home (DOOH) Market Segment Analysis:
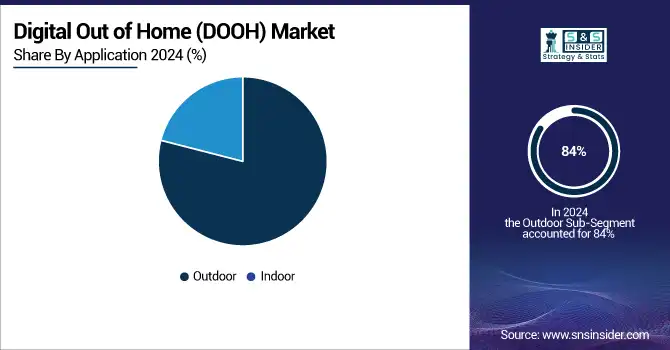
By Application
Outdoor segment accounted for the highest 84% in 2024 due to digital boards and panels spread across almost every urban town. High visibility is a major advantage of outdoor advertising, capturing a wide audience in high-traffic locations such as highways, shopping districts, and event venues. Technological advancements, including AI-driven content personalization and 5G integration, further enhance the effectiveness of outdoor displays. Governments and city planners are increasingly adopting outdoor DOOH solutions as part of smart city initiatives, promoting dynamic messaging that informs and engages citizens.
The Outdoor segment is expected to grow with the fastest CAGR of 11.88% during the forecast period 2025-2032, driven by increasing urbanization and growing advertising budgets. Retail, entertainment, and real estate are some of the industries that use outdoor DOOH for effective brand messaging, thereby dominating the market.
By Product Type
The Digital Screens segment dominated in 2024 with 57% of the market share, as they are versatile and adaptable across various settings. Digital screens are used extensively in shopping malls, airports, and sports arenas, providing high-resolution visuals and dynamic content capabilities. In 2024, ultra-HD and energy-efficient displays further improved the appeal of the segment, which was in line with the sustainability trend.
The Digital Screen segment is poised to grow the fastest with CAGR of 12.01% during the estimated period 2025-2032, primarily with the growing demand for advanced technologies in display technologies and programmatic advertising platforms. Industry players integrate AI and IoT technologies into their digital screens in order to drive engagement. For this reason, the digital screens segment forms an important cornerstone for the Digital out of Home Market.
Digital Out of Home (DOOH) Market Regional Analysis:
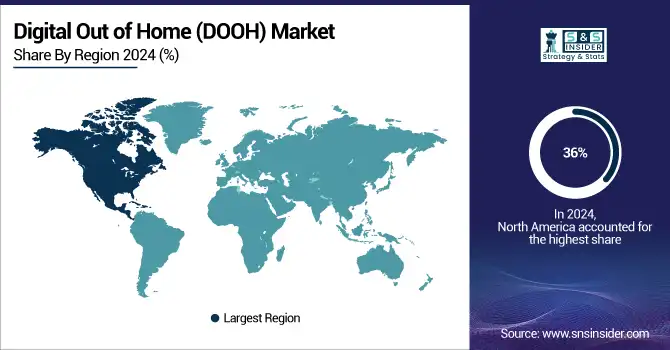
North America Digital Out of Home (DOOH) Market Trends:
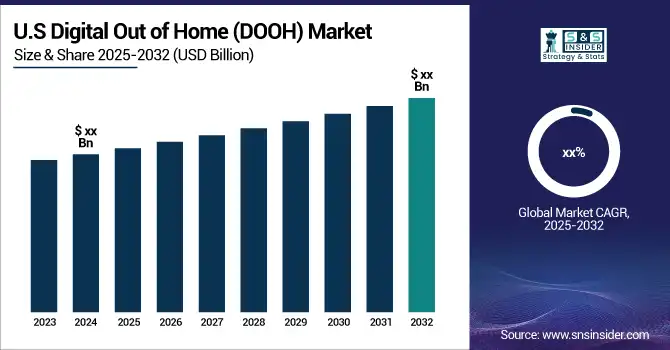
In 2024, North America had 36% market share in terms of programmatic advertising with support from advancements in technology, internet penetration among masses, and a high advertisement spend. Adoption in the United States led this charge in global standards for digital display and also spearheaded adoption of programmatic advertising.
Need any customization research on Digital Out Of Home Market - Enquiry Now
Asia-Pacific Digital Out of Home (DOOH) Market Trends:
The Asia-Pacific region will grow the fastest with a CAGR of 12.20% over the forecast period 2025-2032, as there is growing urbanization, economic growth, and increasing digital transformation initiatives in China, India, and Japan, among other factors. Investments from the government through smart city projects and 5G networks in many countries in the region add up to bolstering DOOH adoption, which could be the biggest hub for future growth opportunities.
Europe Digital Out of Home (DOOH) Market Trends:
In 2024, Europe held a significant share of the DOOH market, driven by strong adoption in countries like the UK, Germany, and France. High digital literacy, mature advertising ecosystems, and government support for smart city initiatives have boosted programmatic advertising and advanced digital display infrastructure across the region.
Latin America Digital Out of Home (DOOH) Market Trends:
Latin America is experiencing steady growth in DOOH, led by Brazil, Mexico, and Argentina. Expansion of digital infrastructure, increasing internet penetration, and rising marketing budgets are fueling programmatic advertising adoption, while governments’ smart city initiatives further support DOOH deployment across urban centers.
Middle East & Africa (MEA) Digital Out of Home (DOOH) Market Trends:
The MEA region is witnessing gradual adoption of DOOH solutions, with growth supported by urbanization, rising disposable incomes, and investments in infrastructure and smart city projects. The UAE, Saudi Arabia, and South Africa are leading markets, where increasing digital engagement and advertising spend are driving programmatic DOOH adoption.
Digital Out of Home (DOOH) Market Key Players:
-
JCDecaux (Digital Billboards, Digital Street Furniture)
-
Clear Channel Outdoor Holdings (Digital Displays, Transit Advertising Solutions)
-
Lamar Advertising Company (Digital Signage, Transit Displays)
-
Outfront Media (Digital Billboards, Transit Advertising)
-
Daktronics (Digital LED Displays, Scoreboards)
-
NEC Display Solutions (Digital Signage, LED Displays)
-
Stroer (Outdoor Advertising Displays, Digital Media Services)
-
Prismview (Digital Screens, LED Display Systems)
-
BroadSign International (Programmatic Advertising Software, Content Management Systems)
-
VIOOH (Programmatic Digital OOH, Advertising Solutions)
-
Watchfire Signs (Digital Outdoor Displays, LED Video Walls)
-
Christie Digital Systems (Projection Displays, Content Management Systems)
-
Ayuda Media Systems (Software for Ad Campaign Management, Digital Signage Software)
-
oOh!media (Digital Billboards, Street Furniture Advertising)
-
AdQuick (Programmatic Advertising Solutions, Campaign Analytics)
-
LG Electronics (Commercial Displays, Digital Signage)
-
Samsung Electronics (Digital Signage, Commercial Displays)
-
Sony Electronics (Professional Displays, LED Video Walls)
-
Panasonic (Digital Projectors, LED Display Solutions)
-
Toshiba (Digital Signage, Interactive Displays)
Major Suppliers (Components, Technologies)
-
3M (Adhesive Materials, Reflective Sheets)
-
Corning Incorporated (Display Glass, Gorilla Glass)
-
Saint-Gobain (Specialized Glass, Architectural Components)
-
DuPont (Polymer Films, Electronic Materials)
-
LG Chem (Display Panels, Polymer Components)
-
Merck Group (Liquid Crystals, OLED Materials)
-
Universal Display Corporation (OLED Materials, Display Components)
-
Sumitomo Chemical (OLED Components, Plastic Films)
-
Nitto Denko Corporation (Optical Films, Adhesive Tapes)
-
Asahi Glass Co. (Display Glass, Glass Substrates)
Recent Trends
-
January 2024: ECN, a publisher of digital-out-of-home office media, revealed a new collaboration with VIOOH, a leading global supply-side platform for digital-out-of-home (DOOH) advertising. This extends VIOOH's international presence to high-end office buildings throughout the UK, France, and Germany. VIOOH, leveraging its cutting-edge technology platform and worldwide presence, effortlessly links buyers and sellers in the DOOH market, providing a smooth programmatic advertising experience. This collaboration will allow advertisers globally to tap into ECN’s inventory located in premium office buildings, strategically situated in business districts of major cities and regional locations.
-
August 2024: JCDecaux, a supplier of out-of-home (OOH) and digital out-of-home (DOOH) billboards, displays, and urban furniture, has outlined its newest partnership with Network Rail to enhance interactivity at railway stations. A newly expanded digital six-sheet network has been set up at London Bridge Station, allowing passengers to plan their future travel across the broader rail and tube system in London.
| Report Attributes | Details |
| Market Size in 2024 | USD 26.46 Billion |
| Market Size by 2032 | USD 64.77 Billion |
| CAGR | CAGR of 11.84% From 2024 to 2032 |
| Base Year | 2024 |
| Forecast Period | 2025-2032 |
| Historical Data | 2021-2023 |
| Report Scope & Coverage | Market Size, Segments Analysis, Competitive Landscape, Regional Analysis, DROC & SWOT Analysis, Forecast Outlook |
| Key Segments | • By Product (Digital Billboard, Digital Signage, Digital Screens) • By Format Type (Billboard, Transit, Street Furniture, Others) • By Organization-size (Large and Medium Enterprises, Small Enterprises) • By Application (Indoor, Outdoor) • By End-User (Retail, Healthcare, Banking & Financial Services, Insurance (BFSI), Automotive, Government, Media & Entertainment, Food & Beverages) |
| Regional Analysis/Coverage | North America (US, Canada), Europe (Germany, UK, France, Italy, Spain, Russia, Poland, Rest of Europe), Asia Pacific (China, India, Japan, South Korea, Australia, ASEAN Countries, Rest of Asia Pacific), Middle East & Africa (UAE, Saudi Arabia, Qatar, South Africa, Rest of Middle East & Africa), Latin America (Brazil, Argentina, Mexico, Colombia, Rest of Latin America). |
| Company Profiles | JCDecaux, Clear Channel Outdoor Holdings, Lamar Advertising Company, Outfront Media, Daktronics, NEC Display Solutions, Stroer, Prismview, BroadSign International, VIOOH, Watchfire Signs, Christie Digital Systems, Ayuda Media Systems, oOh!media, AdQuick, LG Electronics, Samsung Electronics, Sony Electronics, Panasonic, Toshiba. |
Frequently Asked Questions
Ans: The Digital Out-of-Home (DOOH) Market is expected to grow at a CAGR of 11.84% during 2025-2032.
Ans: Digital Out-of-Home (DOOH) Market size was USD 23.46 Billion in 2024 and is expected to USD 64.72 Billion by 2032.
Ans: The major growth factors of the Digital Out-of-Home (DOOH) Market are increase in Programmatic ad buying in DOOH and increase in Urbanization.
Ans: The Outdoor segment dominated the Digital out of Home Market.
Ans: North America dominated the Digital Out-of-Home (DOOH) in 2024.
Get in Touch
