Semiconductor Teardown Services Market Report Scope and Overview:
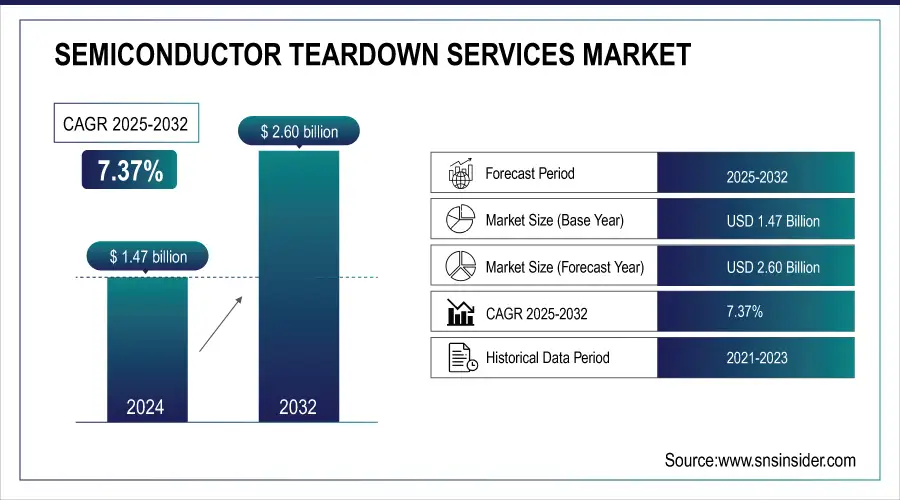
The Semiconductor Teardown Services Market Size was valued at USD 1.47 Billion in 2024, and is expected to reach USD 2.60 Billion by 2032, and grow at a CAGR of 7.37% over the forecast period 2025-2032.
The Semiconductor Teardown Services Market is poised for substantial growth in 2024, driven by increasing demand for competitive intelligence and the ongoing complexity of semiconductor designs. Despite challenges in the industry, including a 3% decline in overall semiconductor sales in 2024 (excluding memory), the teardown services sector is expanding, particularly as businesses seek to stay competitive in a rapidly evolving market. As the market for generative AI chips (including GPUs, CPUs, and HBM3) continues to thrive, expected to exceed USD 50 billion in 2024, teardown services are crucial for gaining insights into innovations in chip design, manufacturing, and component sourcing.

To get more information on Semiconductor Teardown Services Market- Request Free Sample Report
These insights allow companies to refine their strategies, optimize manufacturing processes, and stay ahead of competition.In 2024, both PC and smartphone sales are projected to grow by 4% after declines in 2024, signaling a return to growth for critical end markets. This is significant, as communication and computer chips (which include data center chips) accounted for 56% of semiconductor sales in 2022.

Semiconductor Teardown Services Market Highlights:
-
Technological Advancements Driving Demand – Rapid growth of 5G, AI/ML, IoT, and next-gen chips (FinFET, RRAM, RISC-V) is boosting the need for teardown services to analyze and optimize semiconductor designs.
-
Competitive Advantage through Reverse Engineering – Companies rely on teardown analysis to improve product design, avoid patent infringement, and gain insights into advanced chip architectures.
-
High Costs & Capital Intensity – Specialized tools and expertise make teardown services expensive, limiting adoption by smaller players and reducing scalability.
-
Intellectual Property Risks & Regulatory Oversight – Increasing trade restrictions (e.g., US–China tensions, CHIPS Act, EU Chips Act) raise legal complexities and create barriers for service providers.
-
Supply Chain Disruptions – Global semiconductor shortages, geopolitical tensions, and natural disasters reduce chip availability for teardown analysis and impact market growth.
With AI and 5G technologies driving demand, businesses increasingly rely on teardown services to understand cutting-edge technologies in mobile, automotive, and consumer electronics sectors. Companies are using teardown services to avoid patent infringement and uncover potential improvements in design. As of fall 2023, semiconductor inventories remained high at over USD 60 billion, and the high fab utilization rate during the recent shortage, which is expected to fall below 70% in 2024, creates further pressure for efficient manufacturing and sourcing strategies, further increasing the demand for teardown analysis.
Semiconductor Teardown Services Market Drivers:
-
Technological Advancements Driving Growth in the Semiconductor Teardown Services Market
Rapid Technological Advancements in the Semiconductor Industry are a key driver for the Semiconductor Teardown Services Market. As semiconductor technologies evolve at an accelerated pace, businesses are increasingly relying on teardown services to maintain their competitive edge and foster innovation. The surge in demand for cutting-edge technologies such as 5G, AI/ML hardware, and next-generation chips—including FinFET transistors and embedded RRAM chips—has led companies to seek in-depth insights into these advancements. Teardown services provide a valuable tool for reverse-engineering new chip designs, materials, and manufacturing processes, helping businesses stay ahead of the competition. The growing adoption of IoT and AI, along with the emergence of RISC-V chips and algorithmic-specific chips, is further driving demand for semiconductor products capable of faster data processing and lower latency. The increased need for neural network chips and algorithmic acceleration chips to manage vast data volumes has heightened the role of teardown services. These services enable companies to understand the intricate designs behind high-performance devices and replicate or refine those innovations. The broad use of semiconductors across various sectors—including consumer electronics, automotive, and industrial applications—increases the demand for efficient and powerful chips, further boosting the need for teardown services. These services play a crucial role in helping companies analyze emerging technologies, optimize their products, and keep pace with rapid industry developments.
Semiconductor Teardown Services Market Restraints:
- Restraints in Semiconductor Teardown Services Market - High Costs, IP Risks and Supply Chain Vulnerabilities
Advanced teardown processes, essential for extracting valuable insights from semiconductors, require specialized tools and expertise, making them expensive, which can deter smaller players from entering the market. The capital-intensive nature of these services can also limit scalability, particularly in an environment where companies face intellectual property risks. Protecting proprietary chip designs is a major concern, especially amid rising global trade restrictions and increasing governmental oversight in semiconductor production, such as the US-China tensions and the EU Chips Act. These IP concerns are further exacerbated by the growing legal complexities surrounding patents and the challenge of balancing teardown transparency with protection of commercial interests. Additionally, the global semiconductor shortage has put strain on the supply chain, creating challenges for the availability of semiconductors for analysis. Events like natural disasters, pandemics, or geopolitical tensions, such as the export restrictions and the US’s push to limit China’s access to advanced chips, have caused significant disruptions to semiconductor production and distribution, thereby limiting the flow of devices available for teardown analysis. The complexity and resilience of supply chains in regions like East Asia, where most semiconductor production occurs, contribute to vulnerability during such disruptions. Lastly, new governmental policies, such as the CHIPS Act in the US and the EU's proposals for domestic semiconductor production, may further complicate the teardown services market by introducing additional layers of regulation, leading to delays and uncertainty for service providers. These factors combine to create a challenging environment for the semiconductor teardown services market, constraining its growth despite the increasing demand for detailed chip analysis.
Semiconductor Teardown Services Market Segment Analysis:
By Method
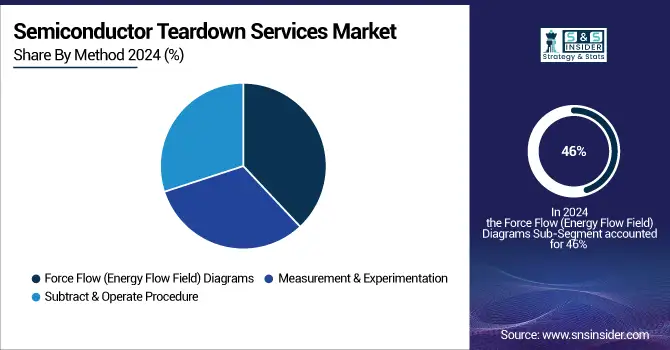
In the Semiconductor Teardown Services Market, the Force Flow (Energy Flow Field) method captured the largest revenue share of approximately 46% in 2024. This technique, which focuses on the detailed analysis of energy flow within semiconductor devices, is crucial for understanding performance characteristics and identifying areas of inefficiency. by mapping energy dynamics, it enables a deeper insight into the functional integrity of chips, supporting improvements in design and performance. The widespread use of Force Flow diagrams is particularly beneficial for high-performance and advanced semiconductor devices, such as microprocessors and power chips, which are essential in industries like automotive, consumer electronics, and telecommunications. The growing demand for these services, driven by the need for energy-efficient and optimized semiconductor solutions, is a significant factor in this segment's dominance. Additionally, its relevance in identifying potential vulnerabilities within the devices makes it a critical tool for the semiconductor teardown services market.

By Application
In 2024, the Circuit Extraction & Reverse Engineering application segment led the Semiconductor Teardown Services Market with a substantial revenue share of around 41%. This segment involves the detailed disassembly of semiconductor devices to extract their circuit designs and functionalities, enabling the replication or modification of existing technologies. It plays a crucial role in competitive analysis, product innovation, and intellectual property protection. Circuit extraction and reverse engineering are vital for understanding the architecture and performance of semiconductor chips, especially for companies involved in developing next-generation technologies. This process is heavily utilized in sectors like consumer electronics, automotive, and telecommunications, where continuous innovation and performance optimization are key. The growth in this application segment is driven by the rising demand for high-performance chips, the complexity of modern semiconductor designs, and the need to mitigate intellectual property risks through a deeper understanding of competitors’ technologies.
Semiconductor Teardown Services Market Regional Analysis:
North America Semiconductor Teardown Services Market Trends:
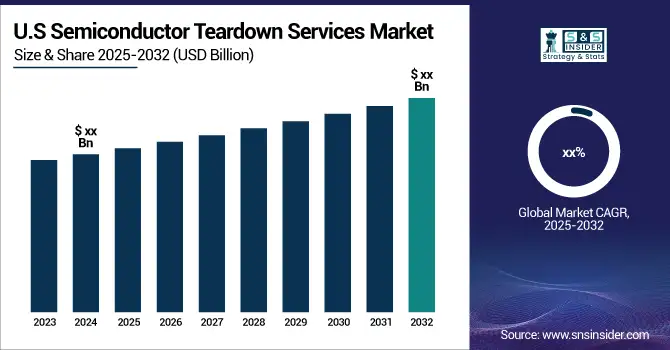
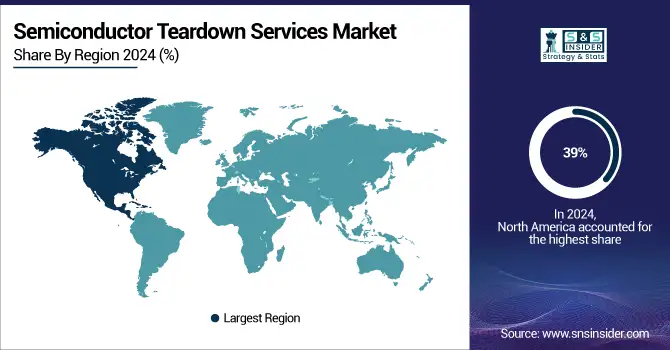
In 2024, North America held the largest share of the Semiconductor Teardown Services Market, capturing around 39% of the revenue. This dominance is primarily driven by the United States, home to major semiconductor manufacturers like Intel, AMD, and NVIDIA, as well as tech giants such as Apple and Google. The U.S. leads in advanced semiconductor technologies, creating a significant demand for teardown services like reverse engineering and circuit extraction. Government initiatives, notably the CHIPS Act, further support domestic semiconductor innovation, boosting the need for detailed chip analysis. Moreover, the increasing complexity of semiconductors, fueled by AI, IoT, and 5G developments, intensifies the demand for teardown services to gain a competitive edge. While Canada’s role in semiconductor manufacturing is smaller, its growing tech sector, especially in AI, also drives the region’s reliance on teardown services. With strategic positioning, robust supply chains, and favorable IP laws, North America is poised to maintain its market leadership.

Get Customized Report as per Your Business Requirement - Enquiry Now
Asia-Pacific Semiconductor Teardown Services Market Trends:
Asia-Pacific is expected to be the fastest-growing region in the Semiconductor Teardown Services Market during the forecast period from 2025 to 2032. This growth is driven by the rapid expansion of semiconductor manufacturing in countries like China, South Korea, Japan, and Taiwan, which are major players in global chip production. The region’s growing demand for advanced semiconductors in industries such as AI, automotive, and telecommunications, especially with the rise of 5G and IoT technologies, is propelling the need for teardown services. Additionally, the increasing complexity of chip designs and a strong focus on innovation are driving the need for reverse engineering and circuit extraction services. The strategic push for self-reliance in semiconductor manufacturing by governments like China's "Made in China 2025" initiative further accelerates the demand for teardown analysis in the region.
Europe Semiconductor Teardown Services Market Trends:
In 2024, Europe accounted for a significant share of the Semiconductor Teardown Services Market, driven by its strong focus on semiconductor research, automotive electronics, and industrial automation. Key countries such as Germany, France, and the Netherlands lead innovation in microelectronics and automotive-grade chips, creating a steady demand for reverse engineering, circuit extraction, and teardown analysis. The European Union’s semiconductor initiatives, including the EU Chips Act, aim to strengthen local manufacturing and reduce dependence on imports, further fueling the requirement for teardown services. The increasing adoption of AI, EV technologies, and IoT-based solutions also intensifies the need for detailed chip analysis to ensure design optimization and compliance with evolving safety and sustainability standards.
Latin America Semiconductor Teardown Services Market Trends:
In 2024, Latin America represented a growing market for Semiconductor Teardown Services, primarily supported by emerging semiconductor activities in Brazil and Mexico. The region’s increasing adoption of electronics in automotive, telecommunications, and consumer electronics sectors has driven demand for reverse engineering and teardown analysis. Government efforts to attract foreign investments in electronics manufacturing, combined with the rise of IoT-enabled devices, are expanding the market potential. While the semiconductor manufacturing base is relatively small compared to Asia-Pacific or North America, partnerships with global chipmakers and increased focus on supply chain resilience are creating opportunities for specialized teardown services in the region.
Middle East & Africa Semiconductor Teardown Services Market Trends:
In 2024, the Middle East & Africa (MEA) market for Semiconductor Teardown Services remained at a nascent stage but is witnessing gradual growth due to increasing investments in smart infrastructure, telecommunications, and defense electronics. Countries such as the UAE, Saudi Arabia, and South Africa are driving demand through their initiatives in AI, 5G deployment, and digital transformation projects. The region’s focus on establishing localized electronics manufacturing and enhancing technological independence has led to a rising need for reverse engineering and circuit extraction services. While the semiconductor ecosystem is still developing, strategic collaborations with global players and government-led innovation programs are expected to accelerate teardown service adoption in the coming years.
Semiconductor Teardown Services Market Key Players:
-
Benchmark Mineral Intelligence (Teardown and Recycling Analysis for EV Batteries)
-
Amadeus Capital Partners (Semiconductor Device Reverse Engineering)
-
Jabil (Product Development, Teardown Services for Electronic Components)
-
Keysight Technologies (Semiconductor Device Testing, Reverse Engineering)
-
Microchip Technology (Microcontroller, Semiconductor Teardowns and Analysis)
-
Broadcom (Networking, Storage Semiconductors Teardowns)
-
Texas Instruments (Semiconductor Component Analysis and Reverse Engineering)
-
Xilinx (FPGA Device Teardowns and Reverse Engineering for AI/ML Applications)
-
BELFOR USA Group Inc. (Disaster Recovery, Teardown Services)
-
Chip One Stop, Inc. (Electronic Component Supply and Analysis)
-
Copperpod IP (Semiconductor IP Services and Analysis)
-
Fictiv Inc. (Rapid Prototyping, Teardown Services)
-
iFixit (Device Teardowns and Repair Solutions)
-
Informa Tech Holdings LLC (Technology Research and Teardown Services)
-
Insight Analytical Labs (Material Testing, Reverse Engineering)
-
Integrated Equipment Services Inc. (Electronics Equipment, Teardown Services)
-
Knometa Research Corp. (Semiconductor and Electronic Device Analysis)
-
Lumenci (3D Printing and Teardown Services)
-
Marvell Semiconductor (Networking Semiconductor Teardowns)
-
NanoPhysics B.V. (Nanoelectronics and Teardown Analysis)
-
Nebula 3D Services (3D Scanning and Teardown Services)
-
PennEngineering (Electronics Teardowns and Components Testing)
-
Power Products International Ltd. (Semiconductor Device Testing and Analysis)
-
Prescient Technologies (Semiconductor Reverse Engineering and IP Analysis)
-
Prestige Technology (S) Pte. Ltd. (Electronics Teardown and Analysis)
-
PSI Semicon Services, Inc. (Semiconductor Testing and Teardown Services)
-
RASCO Automotive Systems Private Limited (Automotive Electronics Teardowns)
-
Sofeast Limited (Electronics Teardowns, Reverse Engineering)
-
Symmetry Electronics by Exponential Technology Group (Electronic Components and Teardowns)
-
TechPats (IP and Reverse Engineering Services for Semiconductors)
-
Tektronix, Inc. (Semiconductor Testing, Reverse Engineering, and Teardowns)
List of Potential customers for the Semiconductor Teardown Services Market:
-
Apple
-
Samsung
-
Intel
-
Qualcomm
-
NVIDIA
-
Broadcom
-
Texas Instruments
-
Micron Technology
-
AMD
-
MediaTek
-
Huawei
-
Sony
-
LG Electronics
-
Toshiba
-
STMicroelectronics
-
Arm Holdings
-
Cisco Systems
-
IBM
-
Xilinx
-
NXP Semiconductors
Semiconductor Teardown Services Market Competitive Landscape:
Taiwan Semiconductor Manufacturing Company (TSMC), established in 1987, is the world’s leading dedicated semiconductor foundry headquartered in Hsinchu, Taiwan. It specializes in advanced chip manufacturing, including 5nm and 3nm process technologies, serving industries such as consumer electronics, automotive, AI, and 5G. TSMC partners with major global tech companies, driving innovation in high-performance and energy-efficient semiconductor solutions.
-
October 23, 2024 – Taiwan Semiconductor Manufacturing Company (TSMC) notified the US government after TechInsights discovered one of its chips in a Huawei product, potentially violating export restrictions. The teardown, which involved Huawei's Ascend 910B AI chip, was conducted by TechInsights, leading to the report of the TSMC chip within a multi-chip system.
TechInsights, established in 1989, is a leading provider of semiconductor and electronics analysis services. Specializing in reverse engineering, intellectual property insights, and market intelligence, the company supports innovation across the semiconductor industry. TechInsights conducted a detailed teardown of Huawei’s MDC (Mobile Data Center) platform, revealing advanced design and component integration for automotive and AI-driven applications.
-
August 5, 2024 – TechInsights conducted a teardown of Huawei’s MDC Pro 610 ADAS controller, revealing its role in advanced driver assistance systems (ADAS) by handling fusion, identification, and classification tasks within vehicles. The teardown highlights the increasing demand for ADAS technologies as consumers prioritize safety features in modern automobiles.
Report Attributes | Details |
---|---|
Market Size in 2024 | USD 1.47 Billion |
Market Size by 2032 | USD 2.60 Billion |
CAGR | CAGR of 7.37% From 2024 to 2032 |
Base Year | 2024 |
Forecast Period | 2025-2032 |
Historical Data | 2021-2023 |
Report Scope & Coverage | Market Size, Segments Analysis, Competitive Landscape, Regional Analysis, DROC & SWOT Analysis, Forecast Outlook |
Key Segments | • By Method (Force Flow Diagrams, Measurement & Experimentation, Subtract & Operate Procedure) • By Device Type (Cameras, Earphones, LEDs, Microphones, Smart Doors & Locks, Smartphones & Laptops, Televisions, Wearables) • By Application (Circuit Extraction & Reverse Engineering, Competitive Intelligence Analysis, Counterfeit screening Database, Semiconductor Patent Identification • By End-User (Automotive, Building & Construction, Consumer Electronics, Healthcare, IT & Telecommunications) |
Regional Analysis/Coverage | North America (US, Canada), Europe (Germany, UK, France, Italy, Spain, Russia, Poland, Rest of Europe), Asia Pacific (China, India, Japan, South Korea, Australia, ASEAN Countries, Rest of Asia Pacific), Middle East & Africa (UAE, Saudi Arabia, Qatar, South Africa, Rest of Middle East & Africa), Latin America (Brazil, Argentina, Mexico, Colombia, Rest of Latin America). |
Company Profiles | Benchmark Mineral Intelligence, Amadeus Capital Partners, Jabil, Keysight Technologies, Microchip Technology, Broadcom, Texas Instruments, Xilinx, BELFOR USA Group Inc., Chip One Stop, Inc., Copperpod IP, Fictiv Inc., iFixit, Informa Tech Holdings LLC, Insight Analytical Labs, Integrated Equipment Services Inc., Knometa Research Corp., Lumenci, Marvell Semiconductor, NanoPhysics B.V., Nebula 3D Services, PennEngineering, Power Products International Ltd., Prescient Technologies, Prestige Technology (S) Pte. Ltd., PSI Semicon Services, Inc., RASCO Automotive Systems Private Limited, Sofeast Limited, Symmetry Electronics by Exponential Technology Group, TechPats, and Tektronix, Inc. |
Table Of Contents
1. Introduction
1.1 Market Definition & Scope
1.2 Research Assumptions & Abbreviations
1.3 Research Methodology
2. Executive Summary
2.1 Market Snapshot
2.2 Market Absolute $ Opportunity Assessment & Y-o-Y Analysis, 2021–2032
2.3 Market Size & Forecast, By Segmentation, 2021–2032
2.3.1 Market Size By Method
2.3.2 Market Size By Device Type
2.3.2 Market Size By End-User
2.3.2 Market Size By Application
2.4 Market Share & BPS Analysis By Region, 2024
2.5 Industry Growth Scenarios – Conservative, Likely & Optimistic
2.6 Industry CxO’s Perspective
3. Market Overview
3.1 Market Dynamics
3.1.1 Drivers
3.1.2 Restraints
3.1.3 Opportunities
3.1.4 Key Market Trends
3.2 Industry PESTLE Analysis
3.3 Key Industry Forces (Porter’s) Impacting Market Growth
3.4 Industry Supply Chain Analysis
3.4.1 Raw Material Suppliers
3.4.2 Manufacturers
3.4.3 Distributors/Suppliers
3.4.4 Customers/End-Users
3.5 Industry Life Cycle Assessment
3.6 Parent Market Overview
3.7 Market Risk Assessment
4. Statistical Insights & Trends Reporting
4.1 Operational & Analytical Metrics
4.1.1 Average number of components analyzed per teardown project
4.1.2 Turnaround time (days/weeks) for standard vs. complex teardown services
4.1.3 Failure analysis rate (%) by semiconductor category (ICs, SoCs, memory, analog, RF)
4.1.4 Average depth of analysis (layers, nodes, package types)
4.2 Adoption & Utilization Trends
4.2.1 Market share by end-user: OEMs, semiconductor manufacturers, R&D institutions, reverse engineering firms (%)
4.2.2 Percentage of teardowns conducted for competitive intelligence vs. IP analysis vs. cost benchmarking
4.2.3 Year-on-year growth of teardown service utilization across industries (consumer electronics, automotive, industrial, telecom)
4.2.4 Share of one-time projects vs. recurring service contracts (%)
4.3 Technology & Methodology Metrics
4.3.1 Adoption rate of advanced techniques: X-ray, SEM, FIB, TEM, SAM (%)
4.3.2 Percentage of 2D vs. 3D integrated circuit teardown projects
4.3.3 Average node size (nm) analyzed in teardown reports
4.3.4 Cost analysis accuracy (%) for BOM (bill of materials) estimations
4.4 Cost & Pricing Indicators
4.4.1 Average teardown cost per project by semiconductor type (USD/project)
4.4.2 Pricing trends based on complexity (standard IC vs. advanced SoC/SiP)
4.4.3 Cost breakdown of teardown services (labor, equipment usage, reporting, testing) (%)
4.4.4 Pricing variation across key regions (%)
5. Semiconductor Teardown Services Market Segmental Analysis & Forecast, By Method, 2021 – 2032, Value (USD Billion)
5.1 Introduction
5.2 Force Flow (Energy Flow Field) Diagrams
5.2.1 Key Trends
5.2.2 Market Size & Forecast, 2021 – 2032
5.3 Measurement & Experimentation
5.3.1 Key Trends
5.3.2 Market Size & Forecast, 2021 – 2032
5.4 Subtract & Operate Procedure
5.4.1 Key Trends
5.4.2 Market Size & Forecast, 2021 – 2032
6. Semiconductor Teardown Services Market Segmental Analysis & Forecast, By Device Type, 2021 – 2032, Value (USD Billion)
6.1 Introduction
6.2 Cameras
6.2.1 Key Trends
6.2.2 Market Size & Forecast, 2021 – 2032
6.3 Earphones
6.3.1 Key Trends
6.3.2 Market Size & Forecast, 2021 – 2032
6.4 LEDs
6.4.1 Key Trends
6.4.2 Market Size & Forecast, 2021 – 2032
6.5 Microphones
6.5.1 Key Trends
6.5.2 Market Size & Forecast, 2021 – 2032
6.6 Smart Doors & Locks
6.6.1 Key Trends
6.6.2 Market Size & Forecast, 2021 – 2032
6.7 Smartphones & Laptops
6.7.1 Key Trends
6.7.2 Market Size & Forecast, 2021 – 2032
6.8 Televisions
6.8.1 Key Trends
6.8.2 Market Size & Forecast, 2021 – 2032
6.9 Wearables
6.9.1 Key Trends
6.9.2 Market Size & Forecast, 2021 – 2032
7. Semiconductor Teardown Services Market Segmental Analysis & Forecast, By Application, 2021 – 2032, Value (USD Billion)
7.1 Introduction
7.2 Circuit Extraction & Reverse Engineering
7.2.1 Key Trends
7.2.2 Market Size & Forecast, 2021 – 2032
7.3 Competitive Intelligence Analysis
7.3.1 Key Trends
7.3.2 Market Size & Forecast, 2021 – 2032
7.4 Counterfeit screening Database
7.4.1 Key Trends
7.4.2 Market Size & Forecast, 2021 – 2032
7.5 Semiconductor Patent Identification
7.5.1 Key Trends
7.5.2 Market Size & Forecast, 2021 – 2032
8. Semiconductor Teardown Services Market Segmental Analysis & Forecast, By End-User, 2021 – 2032, Value (USD Billion)
8.1 Introduction
8.2 Automotive
8.2.1 Key Trends
8.2.2 Market Size & Forecast, 2021 – 2032
8.3 Building & Construction
8.3.1 Key Trends
8.3.2 Market Size & Forecast, 2021 – 2032
8.4 Consumer Electronics
8.4.1 Key Trends
8.4.2 Market Size & Forecast, 2021 – 2032
8.5 Healthcare
8.5.1 Key Trends
8.5.2 Market Size & Forecast, 2021 – 2032
8.6 IT & Telecommunications
8.6.1 Key Trends
8.6.2 Market Size & Forecast, 2021 – 2032
9. Semiconductor Teardown Services Market Segmental Analysis & Forecast By Region, 2021 – 2025, Value (USD Billion)
9.1 Introduction
9.2 North America
9.2.1 Key Trends
9.2.2 Semiconductor Teardown Services Market Size & Forecast, By Method, 2021 – 2032
9.2.3 Semiconductor Teardown Services Market Size & Forecast, By Device Type, 2021 – 2032
9.2.4 Semiconductor Teardown Services Market Size & Forecast, By Application, 2021 – 2032
9.2.5 Semiconductor Teardown Services Market Size & Forecast, By End-User, 2021 – 2032
9.2.6 Semiconductor Teardown Services Market Size & Forecast, By Country, 2021 – 2032
9.2.6.1 USA
9.2.6.1.1 Semiconductor Teardown Services Market Size & Forecast, By Method, 2021 – 2032
9.2.6.1.2 Semiconductor Teardown Services Market Size & Forecast, By Device Type, 2021 – 2032
9.2.6.1.3 Semiconductor Teardown Services Market Size & Forecast, By Application, 2021 – 2032
9.2.6.1.4 Semiconductor Teardown Services Market Size & Forecast, By End-User, 2021 – 2032
9.2.6.2 Canada
9.2.6.2.1 Semiconductor Teardown Services Market Size & Forecast, By Method, 2021 – 2032
9.2.6.2.2 Semiconductor Teardown Services Market Size & Forecast, By Device Type, 2021 – 2032
9.2.6.2.3 Semiconductor Teardown Services Market Size & Forecast, By Application, 2021 – 2032
9.2.6.2.4 Semiconductor Teardown Services Market Size & Forecast, By End-User, 2021 – 2032
9.3 Europe
9.3.1 Key Trends
9.3.2 Semiconductor Teardown Services Market Size & Forecast, By Method, 2021 – 2032
9.3.3 Semiconductor Teardown Services Market Size & Forecast, By Device Type, 2021 – 2032
9.3.4 Semiconductor Teardown Services Market Size & Forecast, By Application, 2021 – 2032
9.3.5 Semiconductor Teardown Services Market Size & Forecast, By End-User, 2021 – 2032
9.3.6 Semiconductor Teardown Services Market Size & Forecast, By Country, 2021 – 2032
9.3.6.1 Germany
9.3.6.1.1 Semiconductor Teardown Services Market Size & Forecast, By Method, 2021 – 2032
9.3.6.1.2 Semiconductor Teardown Services Market Size & Forecast, By Device Type, 2021 – 2032
9.3.6.1.3 Semiconductor Teardown Services Market Size & Forecast, By Application, 2021 – 2032
9.3.6.1.4 Semiconductor Teardown Services Market Size & Forecast, By End-User, 2021 – 2032
9.3.6.2 UK
9.3.6.2.1 Semiconductor Teardown Services Market Size & Forecast, By Method, 2021 – 2032
9.3.6.2.2 Semiconductor Teardown Services Market Size & Forecast, By Device Type, 2021 – 2032
9.3.6.2.3 Semiconductor Teardown Services Market Size & Forecast, By Application, 2021 – 2032
9.3.6.2.4 Semiconductor Teardown Services Market Size & Forecast, By End-User, 2021 – 2032
9.3.6.3 France
9.3.6.3.1 Semiconductor Teardown Services Market Size & Forecast, By Method, 2021 – 2032
9.3.6.3.2 Semiconductor Teardown Services Market Size & Forecast, By Device Type, 2021 – 2032
9.3.6.3.3 Semiconductor Teardown Services Market Size & Forecast, By Application, 2021 – 2032
9.3.6.3.4 Semiconductor Teardown Services Market Size & Forecast, By End-User, 2021 – 2032
9.3.6.4 Italy
9.3.6.4.1 Semiconductor Teardown Services Market Size & Forecast, By Method, 2021 – 2032
9.3.6.4.2 Semiconductor Teardown Services Market Size & Forecast, By Device Type, 2021 – 2032
9.3.6.4.3 Semiconductor Teardown Services Market Size & Forecast, By Application, 2021 – 2032
9.3.6.4.4 Semiconductor Teardown Services Market Size & Forecast, By End-User, 2021 – 2032
9.3.6.5 Spain
9.3.6.5.1 Semiconductor Teardown Services Market Size & Forecast, By Method, 2021 – 2032
9.3.6.5.2 Semiconductor Teardown Services Market Size & Forecast, By Device Type, 2021 – 2032
9.3.6.5.3 Semiconductor Teardown Services Market Size & Forecast, By Application, 2021 – 2032
9.3.6.5.4 Semiconductor Teardown Services Market Size & Forecast, By End-User, 2021 – 2032
9.3.6.6 Russia
9.3.6.6.1 Semiconductor Teardown Services Market Size & Forecast, By Method, 2021 – 2032
9.3.6.6.2 Semiconductor Teardown Services Market Size & Forecast, By Device Type, 2021 – 2032
9.3.6.6.3 Semiconductor Teardown Services Market Size & Forecast, By Application, 2021 – 2032
9.3.6.6.4 Semiconductor Teardown Services Market Size & Forecast, By End-User, 2021 – 2032
9.3.6.7 Poland
9.3.6.7.1 Semiconductor Teardown Services Market Size & Forecast, By Method, 2021 – 2032
9.3.6.7.2 Semiconductor Teardown Services Market Size & Forecast, By Device Type, 2021 – 2032
9.3.6.7.3 Semiconductor Teardown Services Market Size & Forecast, By Application, 2021 – 2032
9.3.6.7.4 Semiconductor Teardown Services Market Size & Forecast, By End-User, 2021 – 2032
9.3.6.8 Rest of Europe
9.3.6.8.1 Semiconductor Teardown Services Market Size & Forecast, By Method, 2021 – 2032
9.3.6.8.2 Semiconductor Teardown Services Market Size & Forecast, By Device Type, 2021 – 2032
9.3.6.8.3 Semiconductor Teardown Services Market Size & Forecast, By Application, 2021 – 2032
9.3.6.8.4 Semiconductor Teardown Services Market Size & Forecast, By End-User, 2021 – 2032
9.4 Asia-Pacific
9.4.1 Key Trends
9.4.2 Semiconductor Teardown Services Market Size & Forecast, By Method, 2021 – 2032
9.4.3 Semiconductor Teardown Services Market Size & Forecast, By Device Type, 2021 – 2032
9.4.4 Semiconductor Teardown Services Market Size & Forecast, By Application, 2021 – 2032
9.4.5 Semiconductor Teardown Services Market Size & Forecast, By End-User, 2021 – 2032
9.4.6 Semiconductor Teardown Services Market Size & Forecast, By Country, 2021 – 2032
9.4.6.1 China
9.4.6.1.1 Semiconductor Teardown Services Market Size & Forecast, By Method, 2021 – 2032
9.4.6.1.2 Semiconductor Teardown Services Market Size & Forecast, By Device Type, 2021 – 2032
9.4.6.1.3 Semiconductor Teardown Services Market Size & Forecast, By Application, 2021 – 2032
9.4.6.1.4 Semiconductor Teardown Services Market Size & Forecast, By End-User, 2021 – 2032
9.4.6.2 India
9.4.6.2.1 Semiconductor Teardown Services Market Size & Forecast, By Method, 2021 – 2032
9.4.6.2.2 Semiconductor Teardown Services Market Size & Forecast, By Device Type, 2021 – 2032
9.4.6.2.3 Semiconductor Teardown Services Market Size & Forecast, By Application, 2021 – 2032
9.4.6.2.4 Semiconductor Teardown Services Market Size & Forecast, By End-User, 2021 – 2032
9.4.6.3 Japan
9.4.6.3.1 Semiconductor Teardown Services Market Size & Forecast, By Method, 2021 – 2032
9.4.6.3.2 Semiconductor Teardown Services Market Size & Forecast, By Device Type, 2021 – 2032
9.4.6.3.3 Semiconductor Teardown Services Market Size & Forecast, By Application, 2021 – 2032
9.4.6.3.4 Semiconductor Teardown Services Market Size & Forecast, By End-User, 2021 – 2032
9.4.6.4 South Korea
9.4.6.4.1 Semiconductor Teardown Services Market Size & Forecast, By Method, 2021 – 2032
9.4.6.4.2 Semiconductor Teardown Services Market Size & Forecast, By Device Type, 2021 – 2032
9.4.6.4.3 Semiconductor Teardown Services Market Size & Forecast, By Application, 2021 – 2032
9.4.6.4.4 Semiconductor Teardown Services Market Size & Forecast, By End-User, 2021 – 2032
9.4.6.5 Australia
9.4.6.5.1 Semiconductor Teardown Services Market Size & Forecast, By Method, 2021 – 2032
9.4.6.5.2 Semiconductor Teardown Services Market Size & Forecast, By Device Type, 2021 – 2032
9.4.6.5.3 Semiconductor Teardown Services Market Size & Forecast, By Application, 2021 – 2032
9.4.6.5.4 Semiconductor Teardown Services Market Size & Forecast, By End-User, 2021 – 2032
9.4.6.6 ASEAN Countries
9.4.6.6.1 Semiconductor Teardown Services Market Size & Forecast, By Method, 2021 – 2032
9.4.6.6.2 Semiconductor Teardown Services Market Size & Forecast, By Device Type, 2021 – 2032
9.4.6.6.3 Semiconductor Teardown Services Market Size & Forecast, By Application, 2021 – 2032
9.4.6.6.4 Semiconductor Teardown Services Market Size & Forecast, By End-User, 2021 – 2032
9.4.6.7 Rest of Asia-Pacific
9.4.6.7.1 Semiconductor Teardown Services Market Size & Forecast, By Method, 2021 – 2032
9.4.6.7.2 Semiconductor Teardown Services Market Size & Forecast, By Device Type, 2021 – 2032
9.4.6.7.3 Semiconductor Teardown Services Market Size & Forecast, By Application, 2021 – 2032
9.4.6.7.4 Semiconductor Teardown Services Market Size & Forecast, By End-User, 2021 – 2032
9.5 Latin America
9.5.1 Key Trends
9.5.2 Semiconductor Teardown Services Market Size & Forecast, By Method, 2021 – 2032
9.5.3 Semiconductor Teardown Services Market Size & Forecast, By Device Type, 2021 – 2032
9.5.4 Semiconductor Teardown Services Market Size & Forecast, By Application, 2021 – 2032
9.5.5 Semiconductor Teardown Services Market Size & Forecast, By End-User, 2021 – 2032
9.5.6 Semiconductor Teardown Services Market Size & Forecast, By Country, 2021 – 2032
9.5.6.1 Brazil
9.5.6.1.1 Semiconductor Teardown Services Market Size & Forecast, By Method, 2021 – 2032
9.5.6.1.2 Semiconductor Teardown Services Market Size & Forecast, By Device Type, 2021 – 2032
9.5.6.1.3 Semiconductor Teardown Services Market Size & Forecast, By Application, 2021 – 2032
9.5.6.1.4 Semiconductor Teardown Services Market Size & Forecast, By End-User, 2021 – 2032
9.5.6.2 Argentina
9.5.6.2.1 Semiconductor Teardown Services Market Size & Forecast, By Method, 2021 – 2032
9.5.6.2.2 Semiconductor Teardown Services Market Size & Forecast, By Device Type, 2021 – 2032
9.5.6.2.3 Semiconductor Teardown Services Market Size & Forecast, By Application, 2021 – 2032
9.5.6.2.4 Semiconductor Teardown Services Market Size & Forecast, By End-User, 2021 – 2032
9.5.6.3 Mexico
9.5.6.3.1 Semiconductor Teardown Services Market Size & Forecast, By Method, 2021 – 2032
9.5.6.3.2 Semiconductor Teardown Services Market Size & Forecast, By Device Type, 2021 – 2032
9.5.6.3.3 Semiconductor Teardown Services Market Size & Forecast, By Application, 2021 – 2032
9.5.6.3.4 Semiconductor Teardown Services Market Size & Forecast, By End-User, 2021 – 2032
9.5.6.4 Colombia
9.5.6.4.1 Semiconductor Teardown Services Market Size & Forecast, By Method, 2021 – 2032
9.5.6.4.2 Semiconductor Teardown Services Market Size & Forecast, By Device Type, 2021 – 2032
9.5.6.4.3 Semiconductor Teardown Services Market Size & Forecast, By Application, 2021 – 2032
9.5.6.4.4 Semiconductor Teardown Services Market Size & Forecast, By End-User, 2021 – 2032
9.5.6.5 Rest of Latin America
9.5.6.5.1 Semiconductor Teardown Services Market Size & Forecast, By Method, 2021 – 2032
9.5.6.5.2 Semiconductor Teardown Services Market Size & Forecast, By Device Type, 2021 – 2032
9.5.6.5.3 Semiconductor Teardown Services Market Size & Forecast, By Application, 2021 – 2032
9.5.6.5.4 Semiconductor Teardown Services Market Size & Forecast, By End-User, 2021 – 2032
9.6 Middle East & Africa
9.6.1 Key Trends
9.6.2 Semiconductor Teardown Services Market Size & Forecast, By Method, 2021 – 2032
9.6.3 Semiconductor Teardown Services Market Size & Forecast, By Device Type, 2021 – 2032
9.6.4 Semiconductor Teardown Services Market Size & Forecast, By Application, 2021 – 2032
9.6.5 Semiconductor Teardown Services Market Size & Forecast, By End-User, 2021 – 2032
9.6.6 Semiconductor Teardown Services Market Size & Forecast, By Country, 2021 – 2032
9.6.6.1 UAE
9.6.6.1.1 Semiconductor Teardown Services Market Size & Forecast, By Method, 2021 – 2032
9.6.6.1.2 Semiconductor Teardown Services Market Size & Forecast, By Device Type, 2021 – 2032
9.6.6.1.3 Semiconductor Teardown Services Market Size & Forecast, By Application, 2021 – 2032
9.6.6.1.4 Semiconductor Teardown Services Market Size & Forecast, By End-User, 2021 – 2032
9.6.6.2 Saudi Arabia
9.6.6.2.1 Semiconductor Teardown Services Market Size & Forecast, By Method, 2021 – 2032
9.6.6.2.2 Semiconductor Teardown Services Market Size & Forecast, By Device Type, 2021 – 2032
9.6.6.2.3 Semiconductor Teardown Services Market Size & Forecast, By Application, 2021 – 2032
9.6.6.2.4 Semiconductor Teardown Services Market Size & Forecast, By End-User, 2021 – 2032
9.6.6.3 Qatar
9.6.6.3.1 Semiconductor Teardown Services Market Size & Forecast, By Method, 2021 – 2032
9.6.6.3.2 Semiconductor Teardown Services Market Size & Forecast, By Device Type, 2021 – 2032
9.6.6.3.3 Semiconductor Teardown Services Market Size & Forecast, By Application, 2021 – 2032
9.6.6.3.4 Semiconductor Teardown Services Market Size & Forecast, By End-User, 2021 – 2032
9.6.6.4 Egypt
9.6.6.4.1 Semiconductor Teardown Services Market Size & Forecast, By Method, 2021 – 2032
9.6.6.4.2 Semiconductor Teardown Services Market Size & Forecast, By Device Type, 2021 – 2032
9.6.6.4.3 Semiconductor Teardown Services Market Size & Forecast, By Application, 2021 – 2032
9.6.6.4.4 Semiconductor Teardown Services Market Size & Forecast, By End-User, 2021 – 2032
9.6.6.5 South Africa
9.6.6.5.1 Semiconductor Teardown Services Market Size & Forecast, By Method, 2021 – 2032
9.6.6.5.2 Semiconductor Teardown Services Market Size & Forecast, By Device Type, 2021 – 2032
9.6.6.5.3 Semiconductor Teardown Services Market Size & Forecast, By Application, 2021 – 2032
9.6.6.5.4 Semiconductor Teardown Services Market Size & Forecast, By End-User, 2021 – 2032
9.6.6.6 Rest of Middle East & Africa
9.6.6.6.1 Semiconductor Teardown Services Market Size & Forecast, By Method, 2021 – 2032
9.6.6.6.2 Semiconductor Teardown Services Market Size & Forecast, By Device Type, 2021 – 2032
9.6.6.6.3 Semiconductor Teardown Services Market Size & Forecast, By Application, 2021 – 2032
9.6.6.6.4 Semiconductor Teardown Services Market Size & Forecast, By End-User, 2021 – 2032
10. Competitive Landscape
10.1 Key Players' Positioning
10.2 Competitive Developments
10.2.1 Key Strategies Adopted (%), By Key Players, 2024
10.2.2 Year-Wise Strategies & Development, 2021 – 2025
10.2.3 Number of Strategies Adopted by Key Players, 2024
10.3 Market Share Analysis, 2024
10.4 Product/Service & Application Benchmarking
10.4.1 Product/Service Specifications & Features By Key Players
10.4.2 Product/Service Heatmap By Key Players
10.4.3 Application Heatmap By Key Players
10.5 Industry Start-Up & Innovation Landscape
10.6 Key Company Profiles
10.6.1 Benchmark Mineral Intelligence
10.6.1.1 Company Overview & Snapshot
10.6.1.2 Product/Service Portfolio
10.6.1.3 Key Company Financials
10.6.1.4 SWOT Analysis
10.6.2 Amadeus Capital Partners
10.6.2.1 Company Overview & Snapshot
10.6.2.2 Product/Service Portfolio
10.6.2.3 Key Company Financials
10.6.2.4 SWOT Analysis
10.6.3 Jabil
10.6.3.1 Company Overview & Snapshot
10.6.3.2 Product/Service Portfolio
10.6.3.3 Key Company Financials
10.6.3.4 SWOT Analysis
10.6.4 Keysight Technologies
10.6.4.1 Company Overview & Snapshot
10.6.4.2 Product/Service Portfolio
10.6.4.3 Key Company Financials
10.6.4.4 SWOT Analysis
10.6.5 Microchip Technology
10.6.5.1 Company Overview & Snapshot
10.6.5.2 Product/Service Portfolio
10.6.5.3 Key Company Financials
10.6.5.4 SWOT Analysis
10.6.6 Broadcom
10.6.6.1 Company Overview & Snapshot
10.6.6.2 Product/Service Portfolio
10.6.6.3 Key Company Financials
10.6.6.4 SWOT Analysis
10.6.7 Texas Instruments
10.6.7.1 Company Overview & Snapshot
10.6.7.2 Product/Service Portfolio
10.6.7.3 Key Company Financials
10.6.7.4 SWOT Analysis
10.6.8 Xilinx
10.6.8.1 Company Overview & Snapshot
10.6.8.2 Product/Service Portfolio
10.6.8.3 Key Company Financials
10.6.8.4 SWOT Analysis
10.6.9 BELFOR USA Group Inc.
10.6.9.1 Company Overview & Snapshot
10.6.9.2 Product/Service Portfolio
10.6.9.3 Key Company Financials
10.6.9.4 SWOT Analysis
10.6.10 Chip One Stop, Inc.
10.6.10.1 Company Overview & Snapshot
10.6.10.2 Product/Service Portfolio
10.6.10.3 Key Company Financials
10.6.10.4 SWOT Analysis
10.6.11 Copperpod IP
10.6.11.1 Company Overview & Snapshot
10.6.11.2 Product/Service Portfolio
10.6.11.3 Key Company Financials
10.6.11.4 SWOT Analysis
10.6.12 Fictiv Inc.
10.6.12.1 Company Overview & Snapshot
10.6.12.2 Product/Service Portfolio
10.6.12.3 Key Company Financials
10.6.12.4 SWOT Analysis
10.6.13 iFixit
10.6.13.1 Company Overview & Snapshot
10.6.13.2 Product/Service Portfolio
10.6.13.3 Key Company Financials
10.6.13.4 SWOT Analysis
10.6.14 Informa Tech Holdings LLC
10.6.14.1 Company Overview & Snapshot
10.6.14.2 Product/Service Portfolio
10.6.14.3 Key Company Financials
10.6.14.4 SWOT Analysis
10.6.15 Insight Analytical Labs
10.6.15.1 Company Overview & Snapshot
10.6.15.2 Product/Service Portfolio
10.6.15.3 Key Company Financials
10.6.15.4 SWOT Analysis
10.6.16 Integrated Equipment Services Inc.
10.6.16.1 Company Overview & Snapshot
10.6.16.2 Product/Service Portfolio
10.6.16.3 Key Company Financials
10.6.16.4 SWOT Analysis
10.6.17 Knometa Research Corp.
10.6.17.1 Company Overview & Snapshot
10.6.17.2 Product/Service Portfolio
10.6.17.3 Key Company Financials
10.6.17.4 SWOT Analysis
10.6.18 Lumenci
10.6.18.1 Company Overview & Snapshot
10.6.18.2 Product/Service Portfolio
10.6.18.3 Key Company Financials
10.6.18.4 SWOT Analysis
10.6.19 Marvell Semiconductor
10.6.19.1 Company Overview & Snapshot
10.6.19.2 Product/Service Portfolio
10.6.19.3 Key Company Financials
10.6.19.4 SWOT Analysis
10.6.20 NanoPhysics B.V.
10.6.20.1 Company Overview & Snapshot
10.6.20.2 Product/Service Portfolio
10.6.20.3 Key Company Financials
10.6.20.4 SWOT Analysis
11. Analyst Recommendations
11.1 SNS Insider Opportunity Map
11.2 Industry Low-Hanging Fruit Assessment
11.3 Market Entry & Growth Strategy
11.4 Analyst Viewpoint & Suggestions On Market Growth
12. Assumptions
13. Disclaimer
14. Appendix
14.1 List Of Tables
14.2 List Of Figures
Key Market Segments:
by Method
-
Force Flow (Energy Flow Field) Diagrams
-
Measurement & Experimentation
-
Subtract & Operate Procedure
by Device Type
-
Cameras
-
Earphones
-
LEDs
-
Microphones
-
Smart Doors & Locks
-
Smartphones & Laptops
-
Televisions
-
Wearables
by Application
-
Circuit Extraction & Reverse Engineering
-
Competitive Intelligence Analysis
-
Counterfeit screening Database
-
Semiconductor Patent Identification
by End-User
-
Automotive
-
Building & Construction
-
Consumer Electronics
-
Healthcare
-
IT & Telecommunications
Request for Segment Customization as per your Business Requirement: Segment Customization Request
REGIONAL COVERAGE:
North America
-
US
-
Canada
-
Mexico
Europe
-
Eastern Europe
-
Poland
-
Romania
-
Hungary
-
Turkey
-
Rest of Eastern Europe
-
-
Western Europe
-
Germany
-
France
-
UK
-
Italy
-
Spain
-
Netherlands
-
Switzerland
-
Austria
-
Rest of Western Europe
-
Asia Pacific
-
China
-
India
-
Japan
-
South Korea
-
Vietnam
-
Singapore
-
Australia
-
Rest of Asia Pacific
Middle East & Africa
-
Middle East
-
UAE
-
Egypt
-
Saudi Arabia
-
Qatar
-
Rest of the Middle East
-
-
Africa
-
Nigeria
-
South Africa
-
Rest of Africa
-
Latin America
-
Brazil
-
Argentina
-
Colombia
Request for Country Level Research Report: Country Level Customization Request
Available Customization
With the given market data, SNS Insider offers customization as per the company’s specific needs. The following customization options are available for the report:
-
Product Analysis
-
Criss-Cross segment analysis (e.g. Product X Application)
-
Product Matrix which gives a detailed comparison of the product portfolio of each company
-
Geographic Analysis
-
Additional countries in any of the regions
-
Company Information
-
Detailed analysis and profiling of additional market players (Up to five)
An accurate research report requires proper strategizing as well as implementation. There are multiple factors involved in the completion of good and accurate research report and selecting the best methodology to compete the research is the toughest part. Since the research reports we provide play a crucial role in any company’s decision-making process, therefore we at SNS Insider always believe that we should choose the best method which gives us results closer to reality. This allows us to reach at a stage wherein we can provide our clients best and accurate investment to output ratio.
Each report that we prepare takes a timeframe of 350-400 business hours for production. Starting from the selection of titles through a couple of in-depth brain storming session to the final QC process before uploading our titles on our website we dedicate around 350 working hours. The titles are selected based on their current market cap and the foreseen CAGR and growth.
The 5 steps process:
Step 1: Secondary Research:
Secondary Research or Desk Research is as the name suggests is a research process wherein, we collect data through the readily available information. In this process we use various paid and unpaid databases which our team has access to and gather data through the same. This includes examining of listed companies’ annual reports, Journals, SEC filling etc. Apart from this our team has access to various associations across the globe across different industries. Lastly, we have exchange relationships with various university as well as individual libraries.

Step 2: Primary Research
When we talk about primary research, it is a type of study in which the researchers collect relevant data samples directly, rather than relying on previously collected data. This type of research is focused on gaining content specific facts that can be sued to solve specific problems. Since the collected data is fresh and first hand therefore it makes the study more accurate and genuine.
We at SNS Insider have divided Primary Research into 2 parts.
Part 1 wherein we interview the KOLs of major players as well as the upcoming ones across various geographic regions. This allows us to have their view over the market scenario and acts as an important tool to come closer to the accurate market numbers. As many as 45 paid and unpaid primary interviews are taken from both the demand and supply side of the industry to make sure we land at an accurate judgement and analysis of the market.
This step involves the triangulation of data wherein our team analyses the interview transcripts, online survey responses and observation of on filed participants. The below mentioned chart should give a better understanding of the part 1 of the primary interview.

Part 2: In this part of primary research the data collected via secondary research and the part 1 of the primary research is validated with the interviews from individual consultants and subject matter experts.
Consultants are those set of people who have at least 12 years of experience and expertise within the industry whereas Subject Matter Experts are those with at least 15 years of experience behind their back within the same space. The data with the help of two main processes i.e., FGDs (Focused Group Discussions) and IDs (Individual Discussions). This gives us a 3rd party nonbiased primary view of the market scenario making it a more dependable one while collation of the data pointers.
Step 3: Data Bank Validation
Once all the information is collected via primary and secondary sources, we run that information for data validation. At our intelligence centre our research heads track a lot of information related to the market which includes the quarterly reports, the daily stock prices, and other relevant information. Our data bank server gets updated every fortnight and that is how the information which we collected using our primary and secondary information is revalidated in real time.

Step 4: QA/QC Process
After all the data collection and validation our team does a final level of quality check and quality assurance to get rid of any unwanted or undesired mistakes. This might include but not limited to getting rid of the any typos, duplication of numbers or missing of any important information. The people involved in this process include technical content writers, research heads and graphics people. Once this process is completed the title gets uploader on our platform for our clients to read it.
Step 5: Final QC/QA Process:
This is the last process and comes when the client has ordered the study. In this process a final QA/QC is done before the study is emailed to the client. Since we believe in giving our clients a good experience of our research studies, therefore, to make sure that we do not lack at our end in any way humanly possible we do a final round of quality check and then dispatch the study to the client.