Torque Sensor Market Size & Overview:
Get more information on Torque Sensor Market - Request Sample Report
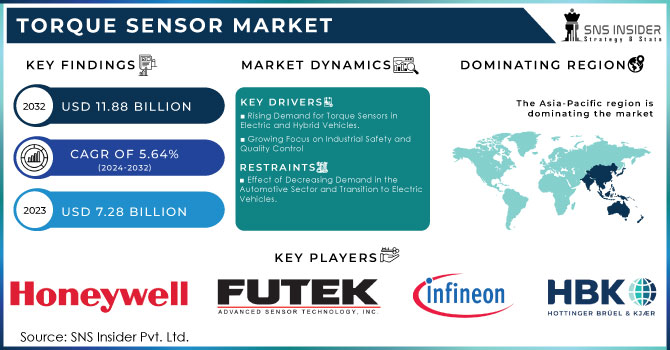
The Torque Sensor Market size is expected to be valued at USD 7.28 Billion in 2023. It is estimated to reach USD 11.88 Billion by 2032, growing at a CAGR of 5.64% during 2024-2032.
The torque sensor market is growing rapidly due to rising demand in industries that depend on accurate torque measurement for quality assurance, performance enhancement, and safety validation. Torque sensors play a crucial role in the automotive sector by ensuring engines, transmissions, and drivetrains operate correctly. In 2024, around 87 million vehicle sales are expected in the diverse global automotive sector, including passenger cars, trucks, and buses. China remains the top player in the automotive industry, maintaining its position as the leading market with approximately 23 million vehicle sales. Passenger cars remain in the top position with approximately 60 million units sold worldwide. Approximately 20 million vehicles of the total sales are made up of commercial vehicles, such as trucks and buses. Sales of electric vehicles (EVs) are on the rise with sales of 8 million units in 2024. As cars incorporate electric and hybrid power systems, the importance of precise torque measurement is growing. Torque sensors assist in tracking and managing power output to guarantee that the engine or motor provides the correct amount of torque in different operating scenarios.
In aircraft manufacturing and maintenance, these sensors are used to measure the torque applied to fasteners, ensuring that all components are securely assembled. Torque sensors are also used in testing and validating the performance of aircraft engines and other critical systems, where accurate torque measurement is essential for safety and reliability. Geographically, aircraft manufacturing in North America has the greatest share of the mentioned 40%, as it is home to the leading aerospace manufacturing industries and infrastructures, such as Boeing in the United States. The European region follows with its 30%, harboring Airbus, among others. The Asia-Pacific region is the next by market share with 20% but shows the fastest growth, as it has the highest demand for air travel and a likewise rapidly growing defense sector market. The remaining 10% is divided between South America, the Middle East, and Africa.
MARKET DYNAMICS:
Drivers
-
Rising Demand for Torque Sensors in Electric and Hybrid Vehicles.
The increased need for torque sensors in the market is largely due to the rising popularity of electric vehicles (EVs) and hybrids. With the transition of the automotive sector to electric power, there is a growing demand for accurate torque measurement to maintain the effectiveness and functionality of electric and hybrid vehicles. Torque sensors are essential for monitoring the power output and enhancing the efficiency of electric powertrains. They assist in boosting energy efficiency, prolonging battery life, and guaranteeing seamless and prompt acceleration. Torque sensors are incorporated into different parts like electric motors, transmissions, and drivetrains in electric vehicles and hybrids. In EPAS systems, torque sensors offer immediate steering input feedback, enabling accurate control and enhancing the driving experience. In the same way, torque sensors in regenerative braking systems assist in precisely measuring braking force, allowing for effective energy recovery and increasing the vehicle's range.
-
Growing Focus on Industrial Safety and Quality Control
Sectors like automotive, aerospace, and manufacturing heavily depend on torque sensors to guarantee that essential components are assembled with accurate torque specifications. In the automotive sector, precise torque measurement is crucial when putting together engines, transmission systems, and other key components to avoid potential accidents or operational inefficiencies. Likewise, within the aerospace industry, torque sensors are utilized to uphold rigorous safety regulations while assembling airplane parts, as even a small mistake could lead to disastrous outcomes. Furthermore, the use of torque sensors in quality control procedures enables industries to identify deviations from established criteria instantly, enabling prompt corrective measures. This guarantees the quality of products and reduces the chance of accidents due to incorrectly put-together equipment. The incorporation of torque sensors into automated systems improves quality control by offering ongoing monitoring and feedback, guaranteeing product quality and safety adherence.
Restraints
-
Effect of Decreasing Demand in the Automotive Sector and Transition to Electric Vehicles.
The reduction in demand from the automotive sector poses a major obstacle for the torque sensor market. Torque sensors play a crucial role in a range of automotive uses, such as testing engines and transmissions, analyzing powertrain efficiency, and developing electric vehicles (EVs). These sensors gauge the twisting force or torque in engines, gearboxes, and drivetrains, guaranteeing top performance and effectiveness. The decreased demand for torque sensors is a result of the recent decline in automotive production, especially for traditional internal combustion engine (ICE) vehicles. As the industry increasingly emphasizes electric and hybrid vehicles, which demand alternative testing and validation methods, the demand for traditional torque sensors might decrease. This change is especially noticeable in areas such as Europe and North America, where rules are pushing for the adoption of more environmentally friendly vehicles. For instance, in the progression of electric vehicles, car makers are utilizing more sophisticated testing tools that incorporate various sensor types, possibly diminishing the need for traditional torque sensors. Moreover, the automotive sector is facing further challenges due to continuing supply chain disruptions and increasing raw material costs, resulting in decreased investments in new vehicle models and testing equipment, ultimately affecting the growth of the Torque Sensor Market.
MARKET SEGMENTATION:
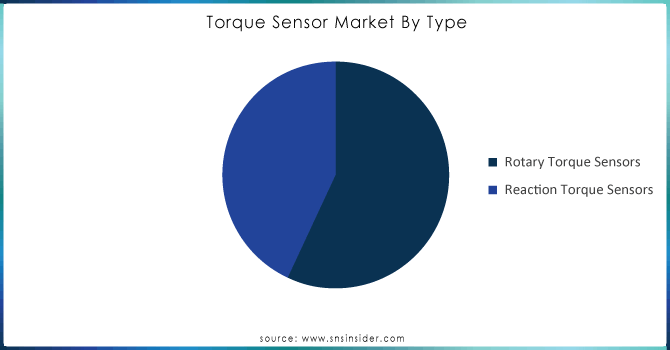
Rotary held a market share of over 54% in 2023 because of its extensive use in various sectors such as automotive, aerospace, and industrial machinery. These sensors accurately measure torque in rotating systems like motors, gearboxes, and crankshafts while providing real-time monitoring. Their essentiality in dynamic applications, especially in electric vehicles and powertrain testing, stems from their capability to offer uninterrupted data. Honeywell and HBM utilize rotary torque sensors in their automotive and aerospace testing solutions for accurate torque measurement, which is crucial for optimizing performance and ensuring safety.
The reaction segment is expected to grow at a faster rate during the forecast period, due to their use in static and semi-static systems. These sensors are essential for measuring torque in components that do not rotate or rotate slowly, like engine mounts, pumps, and conveyor systems. Reaction torque sensors are appreciated for their straightforwardness, excellent longevity, and affordability, making them well-suited for industrial automation, robotics, and medical device uses. TE Connectivity and Kistler Group have incorporated reaction torque sensors into their offerings for robotics and industrial automation to enhance operational efficiency and safety through accurate torque measurement. The increasing use of automation across different sectors is fueling the quick growth of this sector.
By Technology
The strain gauge segment captured a 40% market share in 2023 and dominated the market. This dominance is because of its widespread use in multiple industries such as automotive, aerospace, and industrial machinery. Strain gauges are the top choice for measuring torque in rotating parts such as engines and driveshafts due to their high precision, dependability, and cost efficiency. Corporations such as HBM and Kistler employ strain gauge technology in their torque sensors for automotive testing, powertrain development, and precision engineering solutions. The technology's ability to accurately measure both stationary and moving torque has cemented its leadership in the industry.
The optical segment is accounted to have a rapid growth rate during 2024-2032 because they can measure without contact, are resistant to electromagnetic interference, and have high precision. This technology is becoming more and more popular in high-tech fields like robotics, medical devices, and aerospace, where precision and dependability are crucial. Optical torque sensors are ideal for situations where conventional sensors may encounter restrictions, as they utilize light waves to measure the torque. Corporations such as ABB and Honeywell are investigating the use of optical torque sensors in advanced robotics and automated systems, essential for precise control and feedback.
By Application
The automotive segment led the market in 2023 with over 35% market share. Increasing demand for electric and hybrid vehicles, which need accurate torque measurement for effective powertrain control, drives the dominance of the automotive sector in the Torque Sensor Market. Torque sensors play a crucial role in tasks like testing engines and transmissions, analyzing vehicle dynamics, and controlling steering systems. As car manufacturers work towards better fuel efficiency and lower emissions, the demand for precise torque measurement has increased. Honeywell and TE Connectivity lead the industry with cutting-edge torque sensors for engine dynamometers, chassis dynamometers, and electric power steering systems.
The aerospace and defense sectors are to experience the most rapid growth rate during the forecast period in the Torque Sensor Market, driven by the demand for accurate torque measurement in aircraft control systems, missile guidance, and space exploration missions. There is a growing need for advanced torque sensors with lightweight and high performance in the aerospace industry, as safety, efficiency, and performance are key priorities for manufacturers. Honeywell Aerospace and ABB are creating torque sensors for uses like flight control actuators, landing gear systems, and satellite positioning systems. These improvements boost aircraft performance and safety, positioning the aerospace and defense industry as a crucial area for growth in the Torque Sensor Market.
Get Customized Report as per your Business Requirement - Request For Customized Report
REGIONAL ANALYSIS:
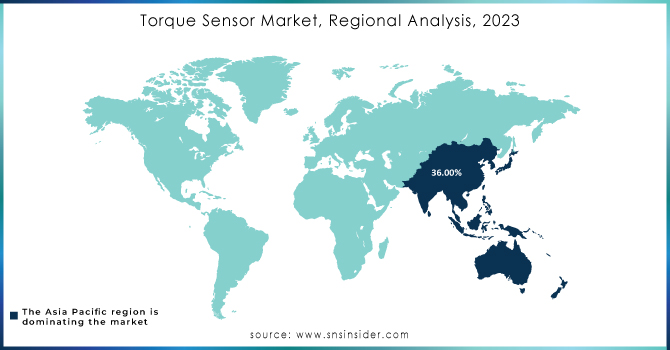
Asia-Pacific dominated the regionally in 2023 with a 36% market share. This is because of its extensive industrial foundation, fast industrial growth, and substantial funding for infrastructure enhancement. Nations such as China and India play a significant role, as their strong manufacturing industries rely on torque sensors for various purposes in machinery, automobiles, and consumer electronics. Panasonic Corporation and Vishay Precision Group are key participants in the region, providing a variety of torque sensor solutions to fulfill various industry requirements. APAC's leading position is also credited to its expanding automotive sector, in which torque sensors play a vital role in improving vehicle performance and safety.
North America is accounted to have a faster CAGR during 2024-2032, because of its advanced technology, high level of industrial automation, and rising need for precise measurement in different industries. The area's expansion is motivated by the automotive and aerospace sectors, necessitating advanced torque sensors for engine evaluation, quality assurance, and safety uses. Enterprises such as Honeywell International Inc. and PCB Piezotronics are at the forefront of the market, offering creative solutions designed to cater to the requirements of manufacturers in North America. The increase in electric car manufacturing and advances in smart manufacturing technologies are also driving the need for torque sensors, positioning North America as a rapidly growing market.
KEY PLAYERS:
The key players in Global Torque Sensor Market are Hottinger Baldwin, Messtechnik, Infineon Technologies, FUTEK Advanced Sensor Technology (US), Honeywell International, Applied Measurements (UK), Sensor Technology, Crane Electronics (UK), Norbar Torque Tools, Kistler Holding (Switzerland), ABB (Switzerland), and Other.
RECENT DEVELOPMENT
-
March 2024: HBM Launched the T40CB Torque Sensor for testing electric motors and gearboxes. The sensor provides high accuracy for measuring not only static but also dynamic torque. The machine has been designed specifically for use in the automotive and aerospace industries.
-
January 2024: Kistler – introduced KiTorq as its modular and customized torque measuring device. The system provides high precision and accuracy in the measurement and can be tailored to meet different industry applications. They include the automotive, aerospace, and industrial automation industries.
-
October 2023: HBK introduces the T40 Expanded T40 Torque series, which provides an increase in the measurement range and accuracy of the data. The system is specially designed for electric motor and transmission applications.
| Report Attributes | Details |
|---|---|
| Report Attributes | Details |
| Market Size in 2023 | USD 7.28 Billion |
| Market Size by 2032 | USD 11.88 Billion |
| CAGR | CAGR of 5.64% From 2024 to 2032 |
| Base Year | 2023 |
| Forecast Period | 2024-2032 |
| Historical Data | 2020-2022 |
| Report Scope & Coverage | Market Size, Segments Analysis, Competitive Landscape, Regional Analysis, DROC & SWOT Analysis, Forecast Outlook |
| Key Segments | • By Type (Rotary, Reaction) • By Technology (Strain Gauge, Surface Acoustic Wave (SAW), Optical, Magnetoelastic) • By Application (Automotive, Test & Measurement, Industrial, Aerospace & Defense, Others) |
| Regional Analysis/Coverage | North America (US, Canada, Mexico), Europe (Eastern Europe [Poland, Romania, Hungary, Turkey, Rest of Eastern Europe] Western Europe] Germany, France, UK, Italy, Spain, Netherlands, Switzerland, Austria, Rest of Western Europe]), Asia Pacific (China, India, Japan, South Korea, Vietnam, Singapore, Australia, Rest of Asia Pacific), Middle East & Africa (Middle East [UAE, Egypt, Saudi Arabia, Qatar, Rest of Middle East], Africa [Nigeria, South Africa, Rest of Africa], Latin America (Brazil, Argentina, Colombia, Rest of Latin America) |
| Company Profiles | Hottinger Baldwin, Messtechnik, Infineon Technologies, FUTEK Advanced Sensor Technology, Honeywell International, Applied Measurements, Sensor Technology, Crane Electronics, Norbar Torque Tools, Kistler Holding, ABB |
| Key Drivers | • Rising Demand for Torque Sensors in Electric and Hybrid Vehicles. • Growing Focus on Industrial Safety and Quality Control |
| RESTRAINTS | • Effect of Decreasing Demand in the Automotive Sector and Transition to Electric Vehicles. |
Frequently Asked Questions
Asia Pacific dominated the Torque Sensor Market in 2023.
The rotary segment dominated the Torque Sensor Market.
The growing focus on industrial safety and quality control is the major growth factor of the Torque Sensor Market.
Torque Sensor Market size was USD 7.28 Billion in 2023 and is expected to Reach USD 11.88 Billion by 2032.
The Torque Sensor Market is expected to grow at a CAGR of 5.64% during 2024-2032.
Get in Touch
