Warehouse Management System Market Size Analysis:
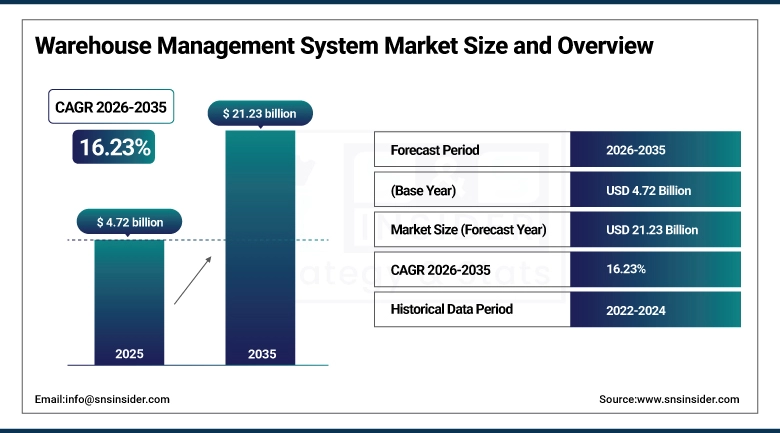
The Warehouse Management System Market Size was valued at USD 4.72 Billion in 2025 and is expected to reach USD 21.23 Billion at 16.23% CAGR by 2026-2035.
The Warehouse Management System (WMS) market is expanding gradually as organizations focus on effective inventory control, efficient business processes, and timely order fulfillment. WMS solutions provide real-time visibility, minimize operational errors, and improve supply chain performance. The rise of e-commerce and the need to adopt automation are major factors contributing to market growth. In addition, developments in cloud computing, artificial intelligence, and IoT technologies are changing the face of warehouse operations. Although the market faces challenges such as complexity and cost of implementation, it is still growing as organizations focus on improving efficiency and accuracy in logistics operations.
Warehouse Management System (WMS) Market Size and Growth:
-
Market Size in 2025: USD 4.72 Billion
-
Market Size by 2035: USD 21.23 Billion
-
CAGR: 16.23% from 2026 to 2035
-
Base Year: 2025
-
Forecast Period: 2026–2035
-
Historical Data: 2022–2024
To Get more information on Warehouse Management System Market - Request Free Sample Report
Key Warehouse Management System Market Trends:
-
Rising adoption of automation and robotics in warehouses, including autonomous guided vehicles and drones, to enhance efficiency and reduce labor dependency.
-
Increasing integration of WMS applications with automated systems for real-time inventory tracking, order execution, and cost-effective scalability.
-
Growing influence of e-commerce and omnichannel retail driving demand for WMS solutions that support multi-channel fulfillment.
-
Real-time inventory visibility enabling efficient stock transfers across locations, ensuring balanced supply for online, in-store, and mobile platforms.
-
Enhanced returns management through WMS systems, addressing the critical needs of the expanding e-commerce industry.
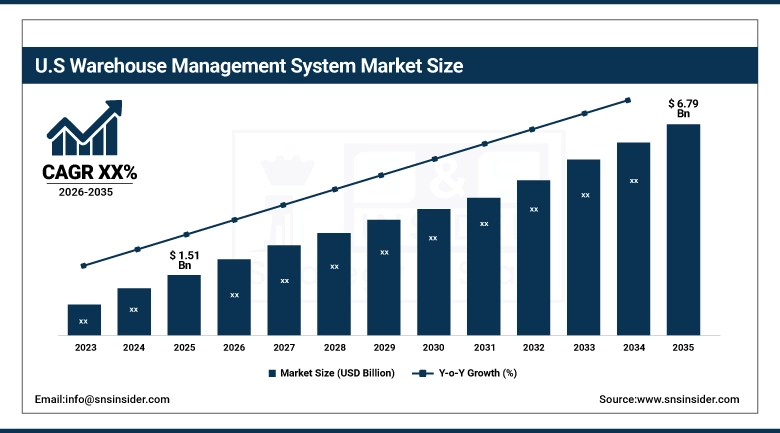
U.S. Warehouse Management System Market Size Outlook:
The U.S. Warehouse Management System Market is projected to grow from USD 1.51 Billion in 2025E to reach USD 6.79 Billion by 2035. The growth is accelerated by the e-commerce boom, the growing need for supply chain automation, and the growing demand for cloud- and AI-driven WMS solutions. Increasing labor costs coupled with demand for real-time inventory visibility and integration with robotics and IoT technologies further stimulate market expansion, providing operational efficiencies across third-party logistics, retail, manufacturing and food & beverage industries.
Warehouse Management System Market Growth Drivers:
-
Increasing Adoption of Automation and Robotics in Warehousing.
Automation and robotics have played a vital role in the rapid integration of Warehouse Management Systems applications. During the past decade, automation has been a growing trend in the business world. This is especially true in the rising popularity of automated robots and machines. In the warehouse industry, automation has provided a solution for managing the increasing number of goods and information related to the goods. Companies are also more focused on providing faster and more efficient delivery services to achieve better customer satisfaction. Therefore, WMS application will have a higher demand in integrating and tracking the inventory and in the timely direction and administration of order execution. In addition, automated systems controlled with WMS application can manage data and facilitate order and goods tracking in real-time ensuring swift delivery. There are many examples of robots and robotic systems employed for automated systems, such as autonomous guided vehicles which are used to sort and deliver products, and drones products. One main advantage of such a system is that it will be easier to increase the number of products as the need arises, which will be also a cost-effective and time-efficient operation. WMS application will also allow automated systems to be used to deal with increasingly larger and more complex warehouse tasks as the markets become global.
-
Rising demand for omnichannel fulfillment drives growth in the WMS Market.
The WMS market has been greatly influenced by the rapid expansion of e-commerce and the move towards omnichannel retail. Consumers anticipate quick and smooth delivery experiences on different platforms including online, in-store, and mobile shopping. The expectation has compelled companies to reassess their supply chain tactics to stay competitive. Warehouse Management Systems help businesses effectively handle multi-channel fulfillment processes by maximizing inventory distribution, tracking in real-time, and forecasting demand. WMS makes it easier to combine various sales channels into one system, ensuring that businesses can satisfy consumer needs for fast and precise deliveries. Having visibility of inventory in real-time enables companies to promptly transfer stock among different locations, making sure all channels are well-stocked without putting too much strain on one warehouse. Moreover, WMS systems facilitate the simple handling of returns, an essential aspect of the expanding e-commerce industry.
Warehouse Management System Market Restraints:
-
Data security concerns and legal complexities restrain the growth of cloud-based warehouse management systems.
Due to the increasing complexity and integration of Warehouse Management Systems with cloud-based technology, as well as the advances in AI and other data-driven technologies, the increased focus was placed on businesses on the security and privacy of their data. WMS systems contain extremely sensitive types of information, including stock levels, information about suppliers, and purchase orders, details of customers and their orders. For this reason, they attract the highest levels of attention from cyber-attackers, data breaches, and leaks, which eventually lead to high financial costs, lawsuits, and sanctions, as well as a bad reputation in case a company is unable to protect the data of its clients and workers. Moreover, the legal landscape is highly complex, with special data protection provisions, such as GDPR in the EU, which must be adjusted by the management and users of warehouse data. This means that companies that use WMS which stores data in the cloud may be risking non-compliance, whereas the dangers of cyber breaches may prevent them from using the storage. This type of market condition works as a major restraint of market growth, particularly for those businesses whose main concern is data security.
Warehouse Management System Market Opportunities:
-
Cloud Adoption and Digital Transformation Driving Growth Opportunities
The increased use of cloud-based WMS, businesses are able to attain greater flexibility, scalability, and cost-effectiveness. Organizations are increasingly adopting technologies such as artificial intelligence, IoT, and robotics, which are helping in improving the warehouse management system in real-time, thereby reducing operational errors and improving accuracy in inventory management. In addition, the increased focus on supply chain digitalization is also encouraging businesses to adopt newer technologies in the warehouse management system, thereby creating a growth opportunity for the Warehouse Management System Market.
Warehouse Management System Market Segment Analysis:
-
By Component: In 2025, Software dominated with 68% share; Services fastest growing segment during 2026–2035
-
By Deployment: In 2025, Cloud dominated with 61% share; On-Premises expected to witness steady growth during 2026–2035
-
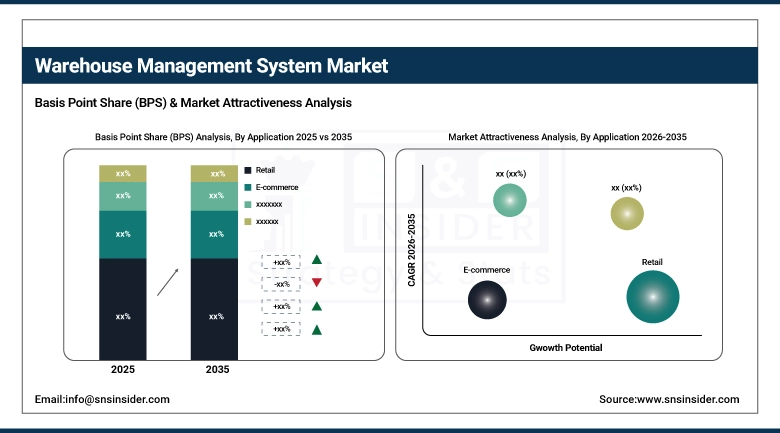
By Application: In 2025, Retail dominated with 21% share; E-commerce fastest growing segment during 2026–2035
By Application: Retail Dominates, E-commerce Fastest-Growing
Retail contributes a considerable market share of 21% to the application segment, as warehouse management systems are commonly implemented to handle high inventory levels, improve the efficiency of order fulfillment, and meet the need for timely replenishment within the retail ecosystem. The increasing complexity of retail businesses and the need for inventory management and fulfillment have led to the adoption of WMS solutions within the retail segment. In addition, the emergence of omnichannel retail has further increased the market share.
E-commerce is the most rapidly growing segment, and this growth is mainly due to the increasing rate of online shopping and the expectations of customers regarding timely and accurate delivery of products. WMS solutions assist e-commerce companies in handling large orders and optimizing the picking and packing of products. The need to improve last-mile delivery and warehouse automation is contributing to the growth of this segment.
By Component: Services Dominate, Software Fastest-Growing
The services segment was the major market segment of the market in 2025, holding a market share of 80%. The services segment offers critical support and solutions to customers. The services segment includes a range of activities such as consulting, implementation, and training. These activities are critical to the implementation of WMS solutions. This segment helps companies implement WMS solutions as per their requirements. The segment also ensures the integration of WMS solutions with existing systems. Companies such as Manhattan Associates and JDA Software offer bundles of services. These bundles include system implementation and user training, making it easier to adopt automated warehouse systems.
The software sector of the Warehouse Management System (WMS) market is to account for experiencing rapid growth, due to technological advancements and a growing demand for streamlined inventory control. More and more companies are embracing cloud-based solutions that provide scalability, flexibility, and real-time data analytics. The software helps to improve efficiency by automating tasks like order picking, keeping track of inventory, and shipping orders. This reduces errors and increases productivity. Companies like SAP and Oracle offer extensive software for WMS that can easily be integrated with existing ERP systems to ensure functions like prediction of orders, data analysis, and mobile availability.
By Deployment: Cloud Dominates, On-Premises Fastest-Growing
The cloud segment was at the forefront of the market in 2025, making up a significant share of 55%. The benefits of cloud-based WMS systems are many, including scalability, cost-effectiveness of IT, and increased accessibility from anywhere in the world as long as there is internet connectivity. Organizations can benefit from the latest analytics, live data, and version updates without having to spend on expensive hardware. SAP, for instance, has SAP S/4HANA Cloud, and Oracle has Oracle Cloud WMS.
The on-premises deployment is accounted to have a rapid growth rate during 2026-2035. This deployment method allows organizations to have full authority over their data and systems, offering increased levels of customization and security. Nonetheless, it necessitates a substantial initial investment in infrastructure and continued upkeep expenses. Companies like Manhattan Associates still favor them due to their strong data governance policies, offering robust on-premises WMS solutions.
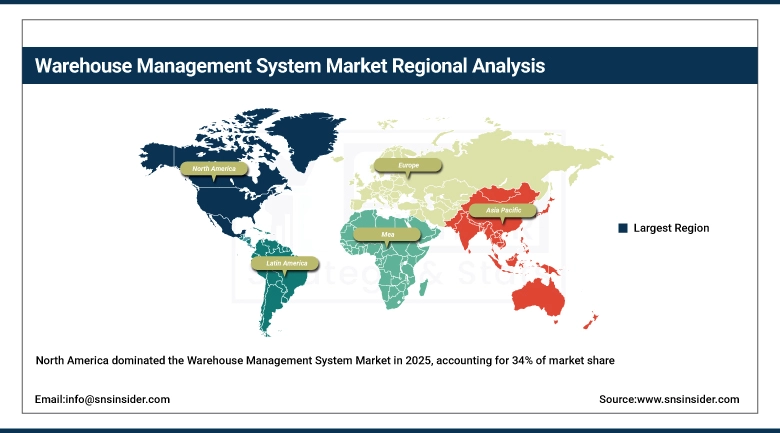
Warehouse Management System Market Regional Analysis:
North America Warehouse Management System Market Insights
North America was at the forefront of the Warehouse Management System Market in 2025, holding a market share of around 34%. The major reason for this is the early adaptation of modern technologies by the region, along with the presence of major WMS solution providers and the development of logistics and supply chain operations. The growth of e-commerce and omnichannel retailing has also fueled the demand for efficient warehouse operations. In addition, the continued investment in automation and robot technologies and cloud-based solutions has further enhanced North America’s position.
Get Customized Report as per Your Business Requirement - Enquiry Now
Europe Warehouse Management System Market Insights
Europe is the fastest-growing region in the Warehouse Management System Market and is approaching dominance, with an expected CAGR of 15% during 2026-2035. The growth is because of increased adoption of warehouse automation, emphasis on supply chain management, and increasing need for real-time inventory management. The growth of e-commerce and presence of sophisticated logistics infrastructure are also contributing to the growth of the region. Furthermore, investments in digitalization are also fueling the growth of WMS.
Asia Pacific Warehouse Management System Market Insights
Asia Pacific region is witnessing tremendous potential for the Warehouse Management System Market due to the rapid development of e-commerce and industrialization. Organizations are increasingly adopting Warehouse Management System solutions to improve efficiency in their warehouses. The increased interest in supply chain optimization and digitalization is also contributing to the rapid development of the market. Moreover, an increase in investments in warehouse automation and a large consumer base and growing logistics industry in Asia Pacific are contributing to the adoption of efficient warehouse management systems.
Latin America (LATAM) and Middle East & Africa (MEA) Warehouse Management System Market Insights
Latin America and Middle East & Africa regions are also growing in the Warehouse Management System Market, thanks to the improvement of the logistics infrastructure and the increasing rate of digitalization of the supply chain process. The business sector in these regions is adopting the WMS solution at a gradual rate to improve the overall operation of the business. The rise of the retail sector and the increase in the number of online shopping platforms are also contributing to the growth of the Warehouse Management System Market in these regions.
Competitive Landscape for Warehouse Management System Market:
Blue Yonder is a leading provider in the Warehouse Management System market, offering AI-driven and cloud-based solutions that optimize inventory, labor, and order fulfillment. Its WMS, integrated with the Luminate Platform, supports real-time visibility, predictive analytics, and automation, enabling businesses to enhance efficiency, accuracy, and responsiveness across supply chains.
-
January 2024: Blue Yonder released significant updates to its WMS, focusing on integrating artificial intelligence to improve supply chain visibility and operational efficiency. This enhancement aims to support companies in managing inventory more effectively while optimizing order fulfillment processes.
SAP is a global leader in the Warehouse Management System market, offering SAP Extended Warehouse Management (EWM) as part of its integrated supply chain solutions. Its WMS enables real-time visibility, advanced automation, and efficient inventory control. SAP supports large enterprises worldwide in optimizing warehouse operations, reducing costs, and improving fulfillment accuracy.
-
March 2023: SAP announced an upgrade to its WMS, incorporating machine learning algorithms to enhance demand forecasting and inventory management. This integration is designed to help businesses respond more quickly to market changes.
Warehouse Management System Companies are:
-
Körber AG
-
Infor
-
Made4net
-
Oracle
-
PSI Logistics
-
Reply
-
SAP
-
Softeon
-
Synergy Ltd
-
Tecsys
-
Blue Yonder Group
-
Microsoft
-
IBM
-
Descartes Systems Group
-
Ehrhardt Partner Group
-
Fishbowl Warehouse
-
Infoplus
-
ShipHero
| Report Attributes | Details |
|---|---|
| Market Size in 2025 | USD 4.72 Billion |
| Market Size by 2035 | USD 21.23 Billion |
| CAGR | CAGR of 16.23% From 2026 to 2035 |
| Base Year | 2025 |
| Forecast Period | 2026-2035 |
| Historical Data | 2022-2024 |
| Report Scope & Coverage | Market Size, Segments Analysis, Competitive Landscape, Regional Analysis, DROC & SWOT Analysis, Forecast Outlook |
| Key Segments | • By Component (Software and Services) • By Deployment (Cloud, On-Premises) • By Application (Third-Party Logistics, Food & Beverages, Retail, Chemicals, Metals & Machinery, Automotive, Healthcare, E-commerce, Electricals & Electronics, Others) |
| Regional Analysis/Coverage | North America (US, Canada), Europe (Germany, UK, France, Italy, Spain, Russia, Poland, Rest of Europe), Asia Pacific (China, India, Japan, South Korea, Australia, ASEAN Countries, Rest of Asia Pacific), Middle East & Africa (UAE, Saudi Arabia, Qatar, South Africa, Rest of Middle East & Africa), Latin America (Brazil, Argentina, Mexico, Colombia, Rest of Latin America). |
| Company Profiles | Epicor, Körber AG, Infor, Made4net, Manhattan Associates, Oracle, PSI Logistics, Reply, SAP, Softeon, Synergy Ltd, Tecsys, Blue Yonder Group, Microsoft, IBM, Descartes Systems Group, Ehrhardt Partner Group, Fishbowl Warehouse, Infoplus, ShipHero. |
Frequently Asked Questions
Ans: The Warehouse Management System Market is expected to grow at a CAGR of 16.23% during 2026-2035.
Ans. The Warehouse Management System Market Size was valued at USD 4.72 Billion in 2025 and is expected to reach USD 21.23 Billion by 2035.
Ans: Rising demand for omnichannel fulfillment drives growth in the WMS Market.
Ans: The Food & Beverages segment dominated the Warehouse Management System Market.
Ans: North America dominated the Warehouse Management System Market in 2025.
Get in Touch
