Smart Playground Safety Sensor Market Size Analysis:
The Smart Playground Safety Sensor Market was valued at USD 1.38 billion in 2025 and is expected to reach USD 4.57 billion by 2035, growing at a CAGR of 12.98% from 2026-2035.
The Smart Playground Safety Sensor market is rapidly growing due to increasing focus on child safety and advancements in sensor technology. These sensors, which may include motion, pressure, environmental and proximity types, play an important role in increasing playground safety by monitoring movement, detecting falls and detecting environmental data. Combined with wireless connectivity and IoT platforms, the integration allows monitoring and data analytics in real-time, increasing efficiency in the incident prevention and maintenance.
In 2024, Milton opened a new inclusive play area, where new wetpour surfacing and accessible equipment will mean the space is safer and more accessible for all. This installation, designed by eibe, centred around community needs, sensory play, and visual guidance for sight-challenged users.
Smart Playground Safety Sensor Market Size and Forecast
-
Market Size in 2025: USD 1.38 Billion
-
Market Size by 2035: USD 4.57 Billion
-
CAGR: 12.98% from 2026 to 2035
-
Base Year: 2025
-
Forecast Period: 2026–2035
-
Historical Data: 2022–2024

To Get more information On Smart Playground Safety Sensor Market - Request Free Sample Report
Smart Playground Safety Sensor Market Trends
-
Rising demand for enhanced child safety in schools, parks, and recreational areas is driving the smart playground safety sensor market.
-
Growing adoption of IoT-enabled sensors for real-time monitoring of equipment and play areas is boosting market growth.
-
Expansion across public, private, and commercial playgrounds is fueling deployment.
-
Increasing focus on injury prevention, compliance with safety standards, and risk management is shaping adoption trends.
-
Advancements in AI, motion detection, and wireless connectivity are improving sensor accuracy and responsiveness.
-
Rising investments in smart city initiatives and safe infrastructure development are supporting market expansion.
-
Collaborations between sensor manufacturers, playground equipment providers, and municipal authorities are accelerating innovation and global adoption.
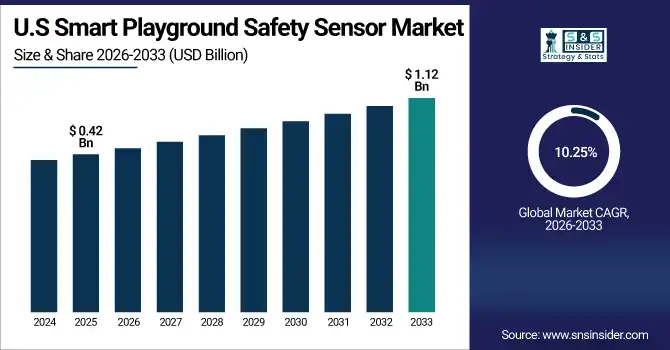
The U.S. Smart Playground Safety Sensor Market was valued at USD 0.42 billion in 2025 and is expected to reach USD 1.12 billion by 2035, growing at a CAGR of 10.25% from 2026-2035. Smart Playground Safety Sensor Market Growth driven by increasing investments in child safety, advancements in sensor technologies, and the adoption of IoT-enabled smart playground solutions. Rising awareness about inclusive and accessible play spaces, along with stringent safety regulations, are further fueling market demand.
Smart Playground Safety Sensor Market Growth Drivers:
-
AI-Powered Edge Computing Drives Growth in Smart Playground Safety Sensor Market
AI-based edge computing integration and advanced sensor technologies that will change traditional playgrounds into smart and dynamic environments are fueling the growth of Smart Playground Safety Sensor market. Using intelligent motion and proximity sensors along with machine learning algorithms and computer vision, these AI-powered solutions monitor child interactions in real-time so anything potentially unsafe can be pre-identified and accidents avoided. The adoption of AI edge technologies (the cause) translates into a growing demand for advanced safety sensors that not only make playgrounds safer but also more engaging and inclusive These responsive and secure playgrounds in turn have the potential to further garner the same technology-based approach to proffer smart safety systems, thus driving the adoption rate of Smart Playground Safety Sensor within the globe, which will eventually drive the growth of the market.
AI transforms playgrounds into Smart Playground and Playground with real-time adaptive safety and engagement experience enhanced by advanced sensors and Machine learning —apr 25, 2025 Using technology to identify risks and to maximise play, we are building safe and healthier play spaces for children.
Smart Playground Safety Sensor Market Restraints:
-
Safety and Privacy Concerns Limit Growth in Smart Playground Safety Sensor Market
Safety and privacy issues form a considerable barrier on the adoption rate of Smart Playground Safety Sensor market. Data misuse and ambiguous data privacy regulations in many countries beset liabilities of continuous monitoring systems. the cost of installation and maintenance hampers its deployment and you hardly build such a large playground in public schools and practical fields with a budget. Additional obstacles are technical challenges like sensor accuracy in various outdoor settings and integration with current playground infrastructure. A market with limited scalability The factors that slow the market collectively, even when awareness about child safety among the adult population is rising and demand for advanced monitoring solutions is also growing.
Smart Playground Safety Sensor Market Opportunities:
-
Smart City Initiatives Drive Large-Scale Adoption and Collaboration in Smart Playground Safety Sensor Market
Smart city initiatives are creating significant opportunities for the Smart Playground Safety Sensor market by promoting the integration of intelligent playground systems within broader urban infrastructure. Smart playgrounds are critical building blocks of an ecosystem as cities employ connected technologies to enhance public safety, public health and community connectivity. This cause the emergence of smart city architectures results in the effect of more city governments working together with technology vendors as well as playground equipment manufacturers for mass implementation. Therefore, advanced safety sensors, as well as IoT-enabled offers for playgrounds, would be in demand for technologies that facilitate safe, interactive and data focused play spaces, which can be integrated into sustainable standards for urban development.
Smart Playground Safety Sensor Market Challenges:
-
High Costs and Privacy Concerns Slow Adoption and Limit Scalability in Smart Playground Safety Sensor Market
The Smart Playground Safety Sensor market faces challenges related to high initial costs and technical complexities involved in integrating advanced AI and IoT technologies into playground environments. Although it expedites the adoption, this creates high initial cost and high-end system dependency causing slow uptick in some municipalities and private organizations which is budget constraint. Moreover, the challenges of data privacy and security also be an obstacle as real-time monitoring needs to manage sensitive data regarding children’s activities. For the results, we see apprehensive growth of market as stakeholders always try to stay in line for reliable and reasonably priced solutions that provides necessary safety benefits without compromising with privacy-centric data.
Smart Playground Safety Sensor Market Segmentation Analysis:
By Product Type
In 2025, the Motion Sensors segment accounted for approximately 35% of the Smart Playground Safety Sensor Market share, due to its critical role in detecting movement and ensuring real-time safety monitoring. This cause widespread adoption of motion sensor technology led to increased demand for accurate and responsive safety solutions in playgrounds. As a result, motion sensors became essential for preventing accidents and enhancing interactive play experiences. Their ability to provide reliable data on children’s activities drove significant market growth, making this segment the largest contributor to the overall market revenue in 2024.
The Proximity Sensors segment is expected to experience the fastest growth in Smart Playground Safety Sensor Market over 2026-2035 with a CAGR of 13.66%. due to its ability to detect rapid activity, increasing trends for accurate detection of objects/floating objects and safety monitoring boosts the demand for proximity sensors in playgrounds at a faster pace. Such sensors offer real-time alerts and improved prevention of collisions by detecting when kids or objects enter a danger zone. Thus, the growing emphasis on maintaining playground safety and the development of sensors technology leads to a substantial increase in proximity sensors market growth in this time frame.
By Application
In 2025, the Public Parks segment accounted for approximately 40% of the Smart Playground Safety Sensor Market share, driven by widespread government investments in public recreational infrastructure. This cause the prioritization of safety and modernization in public spaces resulted in increased installation of advanced safety sensors to protect children and enhance play experiences. Public parks, being accessible to large community populations, demand robust safety measures, fueling strong market demand. Consequently, the focus on creating safer, more inclusive outdoor environments has solidified public parks as the dominant application segment, contributing significantly to overall market growth in 2025.
The Amusement Parks segment is expected to experience the fastest growth in Smart Playground Safety Sensor Market over 2026-2035 with a CAGR of 14.01%. The growth can be attributed to increasing safety regulations and the need for improved visitor protection in high-traffic entertainment venues. Amusement parks are investing in next-gen smart safety sensors that help with crowd movement, hazard detection, and accident emergence while prioritizing safer, fun-filled rides. This lead to growing focus on Safety Compliance and Visitor Satisfaction, which results into fast adoption of smart sensor technologies which makes Amusement Parks one of the prominent driver for the growth of the market during forecast period.
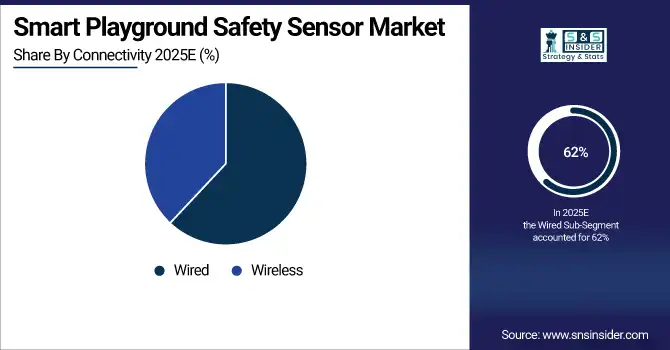
By Connectivity
In 2025, the Wired segment accounted for approximately 62% of the Smart Playground Safety Sensor Market share, driven by its reliable and stable connectivity essential for continuous safety monitoring. This preference for wired solutions is a key market driver, as wired systems offer reduced interference and higher data security compared to wireless alternatives. The segment is also expected to experience the fastest growth from 2026 to 2035, with a CAGR of 14.61%. Market growth is fueled by increasing infrastructure investments, stricter safety regulations, and rising demand for robust, dependable sensor networks in public parks, schools, and recreational facilities, supporting safer playground environments.
By End-User
In 2025, the Municipalities segment accounted for approximately 45% of the Smart Playground Safety Sensor Market share, owing to significant investments by the government in public safety facilities and recreational areas around the community. For this reason, rising inclination towards child safety & public welfare results in high penetration of high-end sensor technology in municipal playground. There is a constant growth in the market due to strict corporate compliance for child protection in the municipalities which are the greatest end-users of these types of safety solutions.
The Private Organizations segment is expected to experience the fastest growth in Smart Playground Safety Sensor Market over 2026-2035 with a CAGR of 14.91%. This growth is attributed to the rise in investments for child protection and improved user experience from private school, residential complexes, and commercial recreation establishments respectively. Growing awareness about liability risks and the need for new technology-based safety solutions are some of the leading market drivers that are causing swift adoption of this element in this segment.
Smart Playground Safety Sensor Market Regional Outlook:
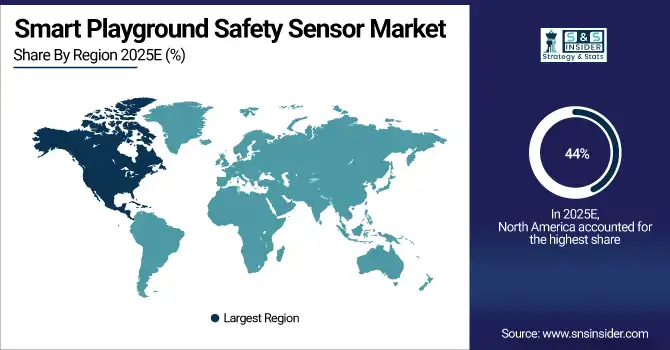
North America Smart Playground Safety Sensor Market Insights
In 2025 North America dominated the Smart Playground Safety Sensor Market and accounted for 44% of revenue share, due to stringent safety standards and increasing safety awareness among general population regarding child safety. Moreover, the market growth was aided by the existing of advanced technological infrastructure in the region and a huge share coming from investments in upgrading public play grounds. Furthermore, the rise in adoption of Internet of Things (IoT) and smart sensor technologies in public and private sectors is contributing to the large share of the region, thereby still leading North America as a major catalyst for innovation and expansion of the market worldwide.
Get Customized Report as per Your Business Requirement - Enquiry Now
Asia Pacific Smart Playground Safety Sensor Market Insights
The Asia-Pacific region is anticipated to experience the fastest growth in the Smart Playground Safety Sensor Market between 2026 and 2035, with a projected CAGR of 14.74%. This growth is fueled by rapid urbanization, increased government investment in public infrastructure, and a rising focus on child safety awareness. Among the countries in this region, China is expected to dominate the market, driven by its large-scale urban development projects and significant investments in smart city initiatives.
Europe Smart Playground Safety Sensor Market Insights
In 2025, Europe emerged as a promising region in the Smart Playground Safety Sensor Market, driven by stringent child safety regulations and increasing investments in public recreational infrastructure. Growing awareness of the importance of safe and inclusive play environments is encouraging the adoption of advanced sensor technologies in schools, parks, and residential complexes. Additionally, government initiatives focused on sustainability and accessibility further boost market growth, making Europe a key hub for innovation and expansion in smart playground safety solutions.
Middle East & Africa and Latin America Smart Playground Safety Sensor Market Insights
Latin America (LATAM) and the Middle East & Africa (MEA) regions are witnessing steady growth in the Smart Playground Safety Sensor Market, due to growing urbanization and rising public spending on domestic infrastructure. The increasing awareness of child safety and the initiative taken by the government to upgrade the existing recreational structure are the major growth factors for the market. Moreover, the growth smart city projects and technological penetration in these regions aid steady demand for sophisticated playground safety sensor solutions.
Smart Playground Safety Sensor Market Competitive Landscape:
Kompan
Kompan is a global playground equipment leader known for designing innovative, safety‑compliant play systems used worldwide. The company integrates durable components, inclusive designs, and interactive tech that can support smart safety sensor integration in playgrounds. With a research‑driven approach and compliance with international safety standards, Kompan’s solutions enhance monitoring, reduce risk, and promote active play in public parks, schools, and community spaces.
PlayCore
PlayCore is a major U.S. playground manufacturer driving safety, inclusivity, and innovation across its product portfolio. Through evidence‑based designs and modular systems, PlayCore supports the deployment of smart sensor technologies for real‑time safety monitoring and maintenance alerts. The company’s emphasis on durable, accessible play environments makes it a key player in modern playground safety ecosystems, serving municipal, educational, and commercial clients.
Playworld Systems
Playworld Systems, headquartered in the U.S., produces commercial playground equipment with a strong safety and durability focus. Known for inclusive, ASTM‑ and CPSC‑compliant designs, the company’s systems can incorporate smart playground safety sensors that monitor equipment integrity and environmental risk factors. Playworld’s global reach and commitment to quality make it a trusted partner for parks, schools, and communities prioritizing child safety and connected play solutions.
Key Players
Some of the Smart Playground Safety Sensor Market Companies
-
Kompan
-
PlayCore
-
Playworld Systems
-
Landscape Structures
-
Miracle Recreation Equipment Company
-
Proludic
-
Eibe
-
HAGS
-
Berliner Seilfabrik
-
Little Tikes Commercial
-
PlayPower
-
Yalp Interactive
-
Lappset Group
-
GameTime
-
VinciPlay
-
ABC Team
-
Wicksteed Playgrounds
-
Henderson Recreation Equipment
-
Dynamo Playgrounds
-
SMP Playgrounds
| Report Attributes | Details |
|---|---|
| Market Size in 2025 | USD 1.38 Billion |
| Market Size by 2035 | USD 4.57 Billion |
| CAGR | CAGR of 12.98% From 2026 to 2035 |
| Base Year | 2024 |
| Forecast Period | 2026-2035 |
| Historical Data | 2022-2024 |
| Report Scope & Coverage | Market Size, Segments Analysis, Competitive Landscape, Regional Analysis, DROC & SWOT Analysis, Forecast Outlook |
| Key Segments | • By Product Type(Motion Sensors, Pressure Sensors, Environmental Sensors, Proximity Sensors and Others) • By Application(Public Parks, Schools, Residential Complexes, Amusement Parks and Others) • By Connectivity(Wired and Wireless) • By End-User(Municipalities, Educational Institutions, Private Organizations and Others) |
| Regional Analysis/Coverage | North America (US, Canada), Europe (Germany, UK, France, Italy, Spain, Russia, Poland, Rest of Europe), Asia Pacific (China, India, Japan, South Korea, Australia, ASEAN Countries, Rest of Asia Pacific), Middle East & Africa (UAE, Saudi Arabia, Qatar, South Africa, Rest of Middle East & Africa), Latin America (Brazil, Argentina, Mexico, Colombia, Rest of Latin America). |
| Company Profiles | The Smart Playground Safety Sensor Market Companies are Kompan, PlayCore, Playworld Systems, Landscape Structures, Miracle Recreation Equipment Company, Proludic, Eibe, HAGS, Berliner Seilfabrik, Little Tikes Commercial, PlayPower, Yalp Interactive, Lappset Group, GameTime, VinciPlay, ABC Team, Wicksteed Playgrounds, Henderson Recreation Equipment, Dynamo Playgrounds, SMP Playgrounds. and Others. |
Frequently Asked Questions
North America dominated the Smart Playground Safety Sensor Market in 2025.
The “Motion Sensors” segment dominated the Smart Playground Safety Sensor Market
Rising focus on child safety and advancements in sensor technology are key drivers of the Smart Playground Safety Sensor Market.
The Smart Playground Safety Sensor Market was valued at USD 1.38 billion in 2025 and is expected to reach USD 4.57 billion by 2035
The Smart Playground Safety Sensor Market is expected to grow at a CAGR of 12.98% during 2026-2035.
Get in Touch
