Thyristor Market Size & Overview:
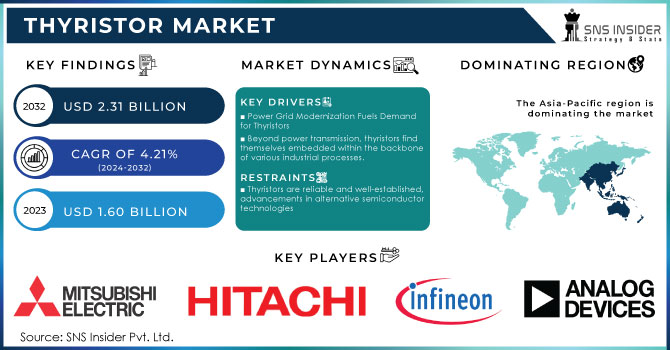
The Thyristor Market Size was valued at USD 1.55 billion in 2023 and is projected to reach USD 2.21 billion by 2032, growing at a CAGR of 4.04 % during the forecast period of 2024-2032.
The Thyristor Market is poised for significant growth, driven by increasing demand for high-power electronic solutions in sectors such as renewable energy, electric vehicles, and industrial automation. However, while thyristors are crucial for efficient power conversion and regulation, their use in electrolysis applications, such as in green hydrogen production, reveals a critical inefficiency thyristor-based rectifiers have a poor AC power factor, leading to suboptimal specific energy consumption (SEC) and the need for additional reactive power compensation. This inefficiency can be mitigated with transistor-based topologies, which are anticipated to reduce SEC by up to 4.5% in electrolyzers.
Get More Information on Thyristor Market - Request Sample Report
Despite these improvements, thyristors remain essential due to their key role in high-temperature power electronics and power regulation, especially with the increasing deployment of silicon carbide (SiC) and gallium nitride (GaN) semiconductors. These materials allow thyristors to operate at much higher temperatures (over 500°C), making them ideal for applications such as electric vehicle powertrains, aerospace systems (e.g., jet engines), and deep oil and gas drilling, where reliable, high-temperature operation is critical. The transition to greener energy systems, coupled with innovations in wide-bandgap semiconductor technology, continues to drive the demand for thyristors. The global Thyristor Market is expected to expand further, fueled by the increasing adoption of energy-efficient power systems, the growing focus on sustainability, and the continuous advancements in semiconductor technology that enhance the efficiency and reliability of high-power applications.
Thyristor Market Dynamics
Drivers
-
Industrial automation drives Thyristor Market growth by requiring precise power control in motor drives and industrial equipment.
Thyristors are critical in controlling high-power electrical systems, enhancing the efficiency and reliability of industrial operations. These devices are widely used in controlling AC motors, induction heating, and in switch-mode power supplies (SMPS) to ensure optimal performance. As industries adopt automation technologies, there is a growing need for thyristor controllers to maintain performance while reducing energy consumption. Thyristors offer advantages such as low-loss high-power switching for industrial applications, which is vital for sectors aiming to cut energy costs and meet sustainability targets, as discussed in resources like InnoMaint and United Automation. However, the demand for thyristors is not without challenges. One of the significant market restraints is the complexity of integration with modern automation systems and the high cost of maintenance and installation. Additionally, the lack of standardization in industrial automation systems can lead to inefficiencies, as highlighted in several industry studies. Moreover, the shift toward transistor-based power control technologies could further limit the expansion of the thyristor market, as these alternatives offer greater efficiency in specific applications, reducing the reliance on thyristors. Despite these challenges, thyristors remain indispensable in high-power industrial settings due to their robustness and ability to operate under demanding conditions, offering a sustainable choice for energy-efficient automation systems.
Restraints
-
Efficiency Challenges and Restraints in the Thyristor Market Amid Rising Competition
A significant restraint in the Thyristor Market is its limited efficiency in certain applications, particularly when compared to newer power electronic devices such as Insulated Gate Bipolar Transistors (IGBTs). While thyristors remain highly effective in high-power applications such as motor drives, industrial equipment, and high-voltage power systems, they tend to be less efficient in low-power or fast-switching applications. This inefficiency can lead to higher energy consumption and heat generation, which are concerns in industries aiming to reduce operational costs and improve energy efficiency. Moreover, with the rise of alternative technologies such as IGBTs and MOSFETs, which offer superior efficiency and faster switching capabilities, the demand for traditional thyristors may decrease, especially in sectors that require high-speed switching or minimal energy loss. The challenge of designing and integrating thyristors to meet modern performance standards further limits their adoption in some applications. As the industry increasingly focuses on minimizing energy consumption and improving power density, alternatives like IGBTs, which offer improved efficiency, could hinder the growth of the thyristor market. Additionally, ongoing advancements in semiconductor technologies may further reduce thyristor adoption. The Thyristor Market must address these efficiency concerns to maintain its relevance as competition intensifies from more efficient semiconductor solutions, such as IGBTs and MOSFETs, in high-performance power control applications.
Thyristor Market Segment Analysis
By Power Rating
In 2023, the 1000 MV segment dominated the Thyristor Market, accounting for approximately 45% of the market share. This segment's growth is primarily driven by its crucial role in high-power applications such as electric power transmission, industrial equipment, and renewable energy systems. Thyristors in this power rating are essential for controlling and managing the flow of electricity in large-scale systems, offering improved efficiency and reliability. These devices are particularly favored in sectors like electric vehicles, grid infrastructure, and industrial automation, where high voltage and high-power handling capabilities are necessary. The demand for 1000 MV thyristors is further fueled by ongoing developments in renewable energy and the need for robust power control solutions across diverse industries.
By Application
In 2023, the Static VAR Compensators (SVCs) segment dominated the Thyristor Market, holding approximately 59% of the market share. SVCs are essential for maintaining voltage stability and power quality in electrical grids, particularly in areas with fluctuating loads and variable power generation sources. Thyristors play a pivotal role in controlling the reactive power within these systems, enabling quick and efficient adjustments to voltage levels. As renewable energy sources like wind and solar gain prominence, SVCs are increasingly utilized to mitigate the intermittency of power supply, ensuring grid stability. The continued demand for SVCs is supported by their ability to improve the reliability and efficiency of power systems, particularly in industrial, transmission, and distribution applications. This has led to significant investments and growth within this segment of the Thyristor Market.
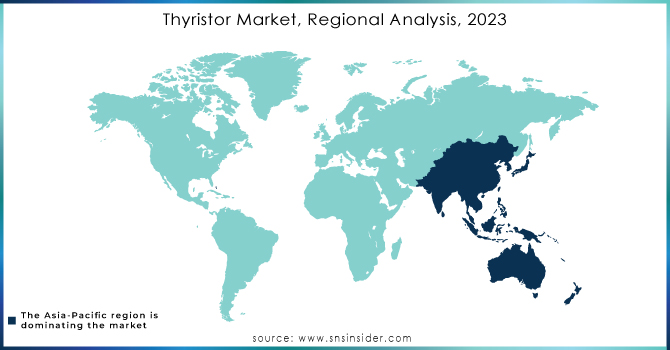
Thyristor Market Regional Overview
North America, with a dominant share of approximately 35% in the Thyristor Market in 2023, continues to lead due to its advanced technological infrastructure and strong demand across key sectors. The United States, as a key player, drives the market with its robust industrial automation, renewable energy initiatives, and the growing electric vehicle (EV) sector. Government policies promoting clean energy, such as the U.S. Clean Energy Standard and tax incentives for EVs, significantly boost the adoption of thyristors for energy-efficient systems like Static VAR Compensators (SVCs) and power control solutions. In Canada, there is a rising focus on hydroelectric and wind energy, which further drives demand for high-power electronics, including thyristors. The region’s well-established automotive industry also requires sophisticated power electronics for electric vehicles, adding to the market growth. North America's emphasis on innovation, sustainability, and infrastructure development continues to solidify its position as a leader in the global thyristor market.
Asia-Pacific is poised to be the fastest-growing region in the Thyristor Market from 2024 to 2032, driven by rapid industrialization, urbanization, and significant investments in infrastructure development across key countries. China, India, Japan, and South Korea are key players in this region. China, being a global manufacturing hub, is witnessing robust demand for thyristors in industries such as renewable energy, industrial automation, and electric vehicles. India’s expanding power sector, alongside government initiatives like “Make in India,” is fueling the growth of high-power electronics, including thyristors. Japan and South Korea's advanced technologies in industrial automation and renewable energy further drive the adoption of thyristors. With increasing power demands, renewable energy installations, and automation projects, Asia-Pacific is expected to lead the thyristor market in the coming years, supported by favorable policies and high-tech infrastructure developments.
Need any customization research on Gaming Hardware Market - Inquiry Now
Key Players
Some of the Major Players in Thyristor Market along with their product:
-
Infineon Technologies AG (Power thyristors for industrial and automotive applications)
-
ABB Ltd. (High-power thyristors for HVDC and FACTS systems)
-
ON Semiconductor (Thyristors for motor control and power regulation)
-
STMicroelectronics (Silicon-controlled rectifiers (SCRs) and GTO thyristors)
-
Mitsubishi Electric Corp. (Thyristors for power transmission and industrial drives)
-
Toshiba Corporation (High-speed thyristors for consumer and industrial electronics)
-
Fuji Electric Co., Ltd. (Fast-switching thyristors for renewable energy systems)
-
Littelfuse, Inc. (Low-power thyristors for consumer electronics)
-
Renesas Electronics (Thyristors for automotive and IoT applications)
-
Vishay Intertechnology (High-temperature thyristors for energy management systems)
-
Semikron International (Thyristor modules for industrial motor drives)
-
Hitachi Energy (Thyristors for power grids and HVDC systems)
-
Dynex Semiconductor Ltd. (High-power thyristors for rail traction and power grids)
-
NXP Semiconductors (Thyristors for automotive and lighting systems)
-
Eaton Corporation (Thyristor-based power controllers for industrial use)
-
Diodes Incorporated (General-purpose thyristors for circuit protection)
-
CRRC Corporation (Thyristors for rail and transportation systems)
-
IXYS Corporation (Fast-recovery thyristors for solar inverters)
-
Microsemi Corporation (Radiation-hardened thyristors for aerospace applications)
-
WeEn Semiconductors (Bidirectional thyristors for AC control systems)
List of suppliers who provide raw materials and components for the thyristor market, which includes materials like silicon, substrates, wafers, and other essential components used in the production of thyristors:
-
GlobalWafers Co., Ltd.
-
SUMCO Corporation
-
Mitsubishi Materials Corporation
-
Siltronic AG
-
SK Siltron
-
Applied Materials, Inc.
-
Albemarle Corporation
-
Dow Inc.
-
DuPont de Nemours, Inc.
-
Tokuyama Corporation
-
Lattice Semiconductor Corporation
-
NTT Advanced Technology Corporation
-
Imerys S.A.
-
Saint-Gobain
-
Kyocera Corporation
-
Semikron
-
Panasonic Corporation
-
LG Chem
-
Shin-Etsu Chemical Co., Ltd.
-
Murata Manufacturing Co., Ltd.
RECENT DEVELOPMENT
-
April 16, 2024 – ABB has supplied a critical thyristor rectifier system for Mitsubishi Heavy Industries' Solid Oxide Electrolysis Cell (SOEC) test platform, supporting advancements in hydrogen production technology.
-
June 6, 2024 – Panasonic Connect expands its AV solution suite at InfoComm 2024 to enhance immersive visual experiences across various industries. The new solutions offer flexible, reliable technology for entertainment, education, corporate, and worship settings.
| Report Attributes | Details |
| Market Size in 2023 | USD 1.55 Billion |
| Market Size by 2032 | USD 2.21 Billion |
| CAGR | CAGR of 4.04% From 2024 to 2032 |
| Base Year | 2023 |
| Forecast Period | 2024-2032 |
| Historical Data | 2020-2022 |
| Report Scope & Coverage | Market Size, Segments Analysis, Competitive Landscape, Regional Analysis, DROC & SWOT Analysis, Forecast Outlook |
| Key Segments | • By Power Rating (500 MV, 500 MV-1000 MV And 1000 MV) • By Application (Static VAR Compensators SVCs, Static Synchronous Compensators (STATCOMs) • By End Use (Consumer Electronics, Telecommunication And Networking, Industrial Automotive, Aerospace & Defence, Healthcare, Manufacturing And Others) |
| Regional Analysis/Coverage | North America (US, Canada, Mexico), Europe (Eastern Europe [Poland, Romania, Hungary, Turkey, Rest of Eastern Europe] Western Europe] Germany, France, UK, Italy, Spain, Netherlands, Switzerland, Austria, Rest of Western Europe]), Asia Pacific (China, India, Japan, South Korea, Vietnam, Singapore, Australia, Rest of Asia Pacific), Middle East & Africa (Middle East [UAE, Egypt, Saudi Arabia, Qatar, Rest of Middle East], Africa [Nigeria, South Africa, Rest of Africa], Latin America (Brazil, Argentina, Colombia, Rest of Latin America) |
| Company Profiles | Infineon Technologies AG, ABB Ltd., ON Semiconductor, STMicroelectronics, Mitsubishi Electric Corp., Toshiba Corporation, Fuji Electric Co., Ltd., Littelfuse, Inc., Renesas Electronics, Vishay Intertechnology, Semikron International, Hitachi Energy, Dynex Semiconductor Ltd., NXP Semiconductors, Eaton Corporation, Diodes Incorporated, CRRC Corporation, IXYS Corporation, Microsemi Corporation, and WeEn Semiconductors. |
| Key Drivers | • Industrial automation drives Thyristor Market growth by requiring precise power control in motor drives and industrial equipment. |
| Restraints | • Efficiency Challenges and Restraints in the Thyristor Market Amid Rising Competition. |
Frequently Asked Questions
Ans: The North America dominating the Thyristor Market in 2023.
Ans: Beyond power transmission, thyristors find themselves embedded within the backbone of various industrial processes.
Ans: Thyristor Market size was USD 1.55 billion in 2023 and is expected to Reach USD 2.21 billion by 2032.
Ans: The Thyristor Market is expected to grow at a CAGR of 4.04%.
Get in Touch
