image

IoT Connected Machines Market Report Scope & Overview:

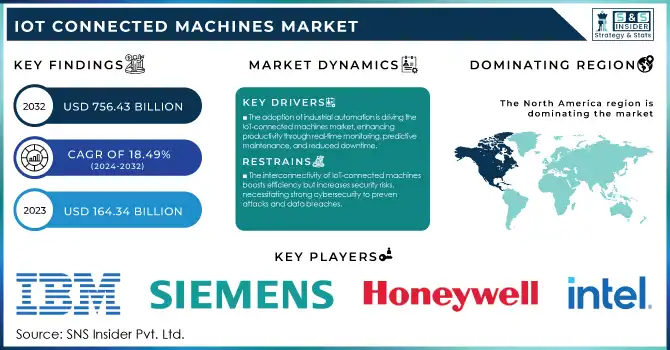
The IoT Connected Machines Market size was valued at USD 179.8 billion in 2023 and is expected to grow to USD 725.28 billion by 2031. The market is projected to experience a remarkable Compound Annual Growth Rate (CAGR) of 19.05% from 2024 to 2031.

The world of technology has witnessed a remarkable advancement with the advent of IoT-connected machines. These machines, equipped with sensors and internet connectivity, have revolutionized various industries by enabling seamless communication and data exchange between devices. The impact of IoT-connected machines spans multiple sectors, including manufacturing, healthcare, transportation, and agriculture. In the manufacturing industry, for instance, these machines have streamlined production processes by enabling real-time monitoring of equipment performance, predictive maintenance, and inventory management. This not only enhances operational efficiency but also reduces downtime and costs.

IoT Connected Machines Market Revenue Analysis

Get More Information on IoT Connected Machines Market - Request Sample Report

In recent years, the IoT Connected Machines Market has witnessed exponential growth, driven by the increasing demand for smart and interconnected devices across various sectors like Industry 4.0, advancement in manufacturing sector. One of the key drivers behind the growth of the IoT Connected Machines Market is the ability to collect and analyze vast amounts of data generated by these interconnected devices. This data provides valuable insights into machine performance, maintenance requirements, and overall operational efficiency. By leveraging this information, businesses can make informed decisions, optimize their processes, and reduce downtime, ultimately leading to cost savings and improved customer satisfaction.

Moreover, the IoT Connected Machines Market offers numerous benefits, including predictive maintenance, remote monitoring, and real-time analytics. These capabilities enable businesses to proactively identify and address potential issues before they escalate, minimizing disruptions and maximizing uptime. Additionally, remote monitoring allows for efficient management of machines and devices, regardless of their physical location, resulting in improved operational efficiency and reduced travel costs. Furthermore, the IoT Connected Machines Market has paved the way for innovative business models and revenue streams. With the ability to remotely monitor and control machines, companies can offer value-added services such as equipment leasing, pay-per-use models, and performance-based contracts. This shift from traditional product-centric approaches to service-oriented solutions opens up new opportunities for revenue generation and customer engagement.

Market Dynamics

Drivers

  • Cost Efficiency associated with IoT-connected machines

  • Enhanced Productivity of IoT-connected machines

The ability of IoT-connected machines to collect and analyze vast amounts of data in real-time has revolutionized the way businesses operate. By leveraging this data, organizations can make informed decisions, improve operational efficiency, and enhance productivity.

Restrain

With the proliferation of connected devices, the risk of cyber threats and data breaches has become a major concern. Ensuring the security and privacy of data transmitted between connected machines is crucial to maintain trust and prevent potential vulnerabilities.

Opportunities

  • The fourth industrial revolution with the integration of digital technologies into manufacturing processes

  • Increasing adoption of IoT-connected machines in the healthcare industry

The healthcare sector has witnessed a significant surge in the utilization of Internet of Things (IoT) technology. This has led to the integration of IoT-connected machines, which are revolutionizing the way healthcare services are delivered.

One of the key advantages of IoT-connected machines in the healthcare industry is their ability to monitor and track patient health remotely. Through the utilization of wearable devices and smart sensors, healthcare providers can continuously monitor vital signs, such as heart rate, blood pressure, and glucose levels, without the need for patients to be physically present at medical facilities. This not only improves patient comfort but also allows for early detection of any abnormalities or potential health risks, enabling timely intervention and treatment. Furthermore, IoT-connected machines facilitate the automation of various healthcare processes, leading to increased accuracy and reduced human error. For instance, smart medication dispensers can be programmed to dispense the correct dosage of medication at the right time, minimizing the risk of medication errors. Similarly, IoT-enabled medical equipment, such as imaging devices and surgical robots, can enhance precision and improve surgical outcomes.

Challenges

  • Lack of skilled professionals in the field of IoT

Impact of Russia-Ukraine War:

The conflict between Russia and Ukraine is a multifaceted and ever-changing situation, which has both positive and negative effects on the IoT market. On one side, the war's influence on the electronic chip market, technological interoperability, inflation rate, and availability of IT staff could potentially hinder the sector's progress. However, on the other side, there is a possibility for the conflict to stimulate growth in certain areas of the IoT market, such as electric vehicles, renewable energy, and cybersecurity. This could open up new avenues for market players and lead to a robust recovery post-war. As per our research, the year 2022 witnessed a remarkable surge in IoT connections, with an impressive 19% increase in global numbers. This surge propelled the total count of active IoT endpoints to a staggering 14.7 billion. Looking ahead to 2023, we predicted a further 17% growth, resulting in a staggering 17.19 billion active endpoints worldwide. As the demand for IoT-connected machines continues to rise, the market for these products is experiencing significant growth.

Impact of Recession:

The increasing adoption of the Internet of Things (IoT) in the retail industry is creating new opportunities for business resilience, especially during the economic downturn. With the current macroeconomic challenges causing significant market volatility, retailers cannot afford any operational errors that could jeopardize customer satisfaction. A single negative experience can lead a consumer to permanently disengage from a brand. This emphasizes the crucial role of purpose-built IoT solutions in enhancing operational efficiency, quality, and ultimately, customer satisfaction. The key to achieving this lies in connectivity, as isolated solutions only yield stagnant outcomes.

In order to navigate through a recession, IoT connectivity becomes essential in preventing costly equipment repairs and operational downtime. During periods of economic downturn, it is crucial for every member of the team to contribute to the success of the overall enterprise. However, retailers are currently facing difficulties in retaining employees. According to a study conducted by McKinsey & Company, almost half of frontline retail workers and 62% of retail managers contemplate leaving their jobs within three to six months of being hired. This is where IoT connectivity emerges as the ultimate tool for empowering employees and fostering their engagement in the workplace.

Market segmentation

By Component

  • I/O Modules

  • IoT Gateways

  • IoT Sensors

  • Others

By Industry

  • Retail

  • Aerospace & Defense

  • Automotive

  • Healthcare

  • Logistics & Transportation

  • Manufacturing

  • Oil & Gas

  • Power and Utilities

  • Others

Regional Analysis

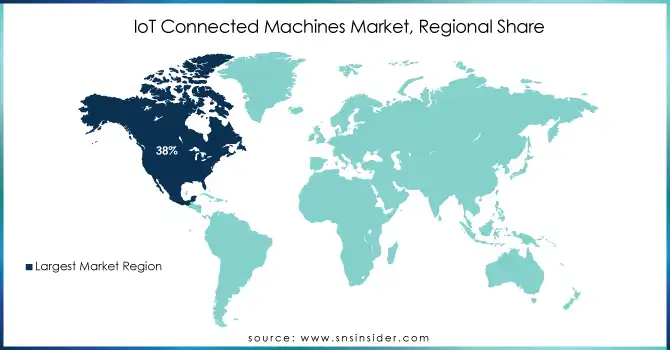
North America dominated the IoT Connected Machines Market in 2023. The US is the dominating country that contributes majorly to the growth of this market in North America. It is projected that by 2025, North America alone will witness a staggering 5.6 billion IoT connections. This exponential growth highlights the immense potential and widespread adoption of IoT technology in the region. This surge in IoT adoption can be attributed to the numerous benefits it offers, such as enhanced operational efficiency, improved decision-making capabilities, and increased productivity. By leveraging IoT technology, businesses can streamline their processes, optimize resource allocation, and gain valuable insights from the vast amount of data generated by connected devices. Moreover, the US has been at the forefront of IoT innovation, with its advanced infrastructure, robust technological ecosystem, and supportive regulatory framework. These factors have created a conducive environment for the rapid growth and widespread adoption of IoT technology within the country.

In 2023, approximately 35% of organizations in North America and Europe have already embraced IoT technology as an integral part of their business operations. Furthermore, an additional 13% of these organizations have plans to integrate IoT technology within the coming year.

Asia Pacific is projected to grow with the highest CAGR during the forecast period of 2024-2031. There are several key reasons behind the anticipated growth of the Asia Pacific region in the IoT Connected Machines Market. Firstly, the region boasts a large and rapidly expanding population, coupled with a rising middle class. This demographic shift is driving increased demand for connected devices and smart technologies, creating a fertile ground for the IoT market to flourish. Furthermore, Asia Pacific is witnessing significant advancements in infrastructure development, particularly in terms of telecommunications and internet connectivity. This infrastructure expansion is facilitating the seamless integration of IoT technologies, enabling businesses and consumers to leverage the benefits of connected machines.

Moreover, governments across the Asia Pacific region are actively promoting digital transformation and Industry 4.0 initiatives. These initiatives aim to enhance productivity, efficiency, and competitiveness across various sectors, including manufacturing, healthcare, transportation, and agriculture. As a result, there is a growing adoption of IoT solutions and connected machines to optimize operations and drive innovation.

IoT-Connected-Machines-Market-By-Region

Need any customization research on IoT Connected Machines Market - Enquiry Now


REGIONAL COVERAGE:

North America

  • US

  • Canada

  • Mexico

Europe

  • Eastern Europe

    • Poland

    • Romania

    • Hungary

    • Turkey

    • Rest of Eastern Europe

  • Western Europe

    • Germany

    • France

    • UK

    • Italy

    • Spain

    • Netherlands

    • Switzerland

    • Austria

    • Rest of Western Europe

Asia Pacific

  • China

  • India

  • Japan

  • South Korea

  • Vietnam

  • Singapore

  • Australia

  • Rest of Asia Pacific

Middle East & Africa

  • Middle East

    • UAE

    • Egypt

    • Saudi Arabia

    • Qatar

    • Rest of the Middle East

  • Africa

    • Nigeria

    • South Africa

    • Rest of Africa

Latin America

  • Brazil

  • Argentina

  • Colombia

  • Rest of Latin America

Key Players

The major key players are IBM Corporation, Siemens AG, Honeywell International Inc., Intel Corporation, General Electric Company, Hitachi Ltd., PTC Ltd., ABB Ltd., Rockwell Automation, Schneider Electric, and other key players mentioned in the final report.

Siemens AG-Company Financial Analysis

Company Landscape Analysis

Recent Development:

  • In March 2023, Siemens announced the launch of Connect Box, a smart IoT solution designed to manage smaller buildings.

  • In April 2022, Honeywell received the 2022 IoT Evolution Industrial IoT Product of the Year Award.

IoT Connected Machines Market report scope:
Report Attributes Details
Market Size in 2023  US$ 179.8 Bn
Market Size by 2031  US$ 725.28 Bn
CAGR   CAGR of 19.05% From 2024 to 2031
Base Year 2023
Forecast Period  2024-2031
Historical Data  2020-2022
Report Scope & Coverage Market Size, Segments Analysis, Competitive  Landscape, Regional Analysis, DROC & SWOT Analysis, Forecast Outlook
Key Segments • By Component (I/O Modules, IoT Gateways, IoT Sensors, and Others)
• By Industry (Retail, Aerospace & Defense, Automotive, Healthcare, Logistics & Transportation, Manufacturing, Oil & Gas, Power and Utilities, and Others)
Regional Analysis/Coverage North America (US, Canada, Mexico), Europe (Eastern Europe [Poland, Romania, Hungary, Turkey, Rest of Eastern Europe] Western Europe] Germany, France, UK, Italy, Spain, Netherlands, Switzerland, Austria, Rest of Western Europe]). Asia Pacific (China, India, Japan, South Korea, Vietnam, Singapore, Australia, Rest of Asia Pacific), Middle East & Africa (Middle East [UAE, Egypt, Saudi Arabia, Qatar, Rest of Middle East], Africa [Nigeria, South Africa, Rest of Africa], Latin America (Brazil, Argentina, Colombia Rest of Latin America)
Company Profiles IBM Corporation, Siemens AG, Honeywell International Inc., Intel Corporation, General Electric Company, Hitachi Ltd., PTC Ltd., ABB Ltd., Rockwell Automation, Schneider Electric
Key Drivers • Cost Efficiency associated with IoT-connected machines
• Enhanced Productivity of IoT-connected machines
Market Opportunities • The fourth industrial revolution with the integration of digital technologies into manufacturing processes
• Increasing adoption of IoT-connected machines in the healthcare industry


Frequently Asked Questions

Ans. The Compound Annual Growth rate for IoT Connected Machines Market over the forecast period is 19.05%.

Ans. The projected market size for the IoT Connected Machines Market is USD 725.28 billion by 2031.

Ans: Rapid advancements in technology, such as artificial intelligence, machine learning, and cloud computing, have paved the way for the widespread adoption of IoT-connected machines. These innovations have enhanced the capabilities of connected devices, enabling seamless communication and data exchange.

Ans: The IoT-connected machines market comprises a wide range of devices from different manufacturers, each with its own protocols and standards. Achieving seamless interoperability between these devices remains a challenge, hindering the full potential of IoT technology.

Ans: IoT gateways segment is expected to hold the largest revenue share during the forecast period.

TABLE OF CONTENTS

1. Introduction
1.1 Market Definition
1.2 Scope
1.3 Research Assumptions

2. Research Methodology

3. Market Dynamics
3.1 Drivers
3.2 Restraints
3.3 Opportunities
3.4 Challenges

4. Impact Analysis
4 Impact of the Russia-Ukraine War
4.2 Impact of Ongoing Recession
4.2.1 Introduction
4.2.2 Impact on major economies
4.2.2.1 US
4.2.2.2 Canada
4.2.2.3 Germany
4.2.2.4 France
4.2.2.5 United Kingdom
4.2.2.6 China
4.2.2.7 Japan
4.2.2.8 South Korea
4.2.2.9 Rest of the World

5. Value Chain Analysis

6. Porter’s 5 forces model

7. PEST Analysis

8. IoT Connected Machines Market Segmentation, by Component
8.1 I/O Modules
8.2 IoT Gateways
8.3 IoT Sensors
8.4 Others

9. IoT Connected Machines Market Segmentation, by Industry
9.1 Aerospace & Defense
9.2 Automotive
9.3 Healthcare
9.4 Logistics & Transportation
9.5 Manufacturing
9.6 Oil & Gas
9.7 Power and Utilities
9.8 Others

10. Regional Analysis
10.1 Introduction
10.2 North America
10.2.1 North America IoT Connected Machines Market by Country
10.2.2North America IoT Connected Machines Market by Component
10.2.3 North America IoT Connected Machines Market by Industry
10.2.4 USA
10.2.4.1 USA IoT Connected Machines Market by Component
10.2.4.2 USA IoT Connected Machines Market by Industry
10.2.5 Canada
10.2.5.1 Canada IoT Connected Machines Market by Component
10.2.5.2 Canada IoT Connected Machines Market by Industry
10.2.6 Mexico
10.2.6.1 Mexico IoT Connected Machines Market by Component
10.2.6.2 Mexico IoT Connected Machines Market by Industry
10.3 Europe
10.3.1 Eastern Europe
10.3.1.1 Eastern Europe IoT Connected Machines Market by Country
10.3.1.2 Eastern Europe IoT Connected Machines Market by Component
10.3.1.3 Eastern Europe IoT Connected Machines Market by Industry
10.3.1.4 Poland
10.3.1.4.1 Poland IoT Connected Machines Market by Component
10.3.1.4.2 Poland IoT Connected Machines Market by Industry
10.3.1.5 Romania
10.3.1.5.1 Romania IoT Connected Machines Market by Component
10.3.1.5.2 Romania IoT Connected Machines Market by Industry
10.3.1.6 Hungary
10.3.1.6.1 Hungary IoT Connected Machines Market by Component
10.3.1.6.2 Hungary IoT Connected Machines Market by Industry
10.3.1.7 Turkey
10.3.1.7.1 Turkey IoT Connected Machines Market by Component
10.3.1.7.2 Turkey IoT Connected Machines Market by Industry
10.3.1.8 Rest of Eastern Europe
10.3.1.8.1 Rest of Eastern Europe IoT Connected Machines Market by Component
10.3.1.8.2 Rest of Eastern Europe IoT Connected Machines Market by Industry
10.3.2 Western Europe
10.3.2.1 Western Europe IoT Connected Machines Market by Country
10.3.2.2 Western Europe IoT Connected Machines Market by Component
10.3.2.3 Western Europe IoT Connected Machines Market by Industry
10.3.2.4 Germany
10.3.2.4.1 Germany IoT Connected Machines Market by Component
10.3.2.4.2 Germany IoT Connected Machines Market by Industry
10.3.2.5 France
10.3.2.5.1 France IoT Connected Machines Market by Component
10.3.2.5.2 France IoT Connected Machines Market by Industry
10.3.2.6 UK
10.3.2.6.1 UK IoT Connected Machines Market by Component
10.3.2.6.2 UK IoT Connected Machines Market by Industry
10.3.2.7 Italy
10.3.2.7.1 Italy IoT Connected Machines Market by Component
10.3.2.7.2 Italy IoT Connected Machines Market by Industry
10.3.2.8 Spain
10.3.2.8.1 Spain IoT Connected Machines Market by Component
10.3.2.8.2 Spain IoT Connected Machines Market by Industry
10.3.2.9 Netherlands
10.3.2.9.1 Netherlands IoT Connected Machines Market by Component
10.3.2.9.2 Netherlands IoT Connected Machines Market by Industry
10.3.2.10 Switzerland
10.3.2.10.1 Switzerland IoT Connected Machines Market by Component
10.3.2.10.2 Switzerland IoT Connected Machines Market by Industry
10.3.2.11 Austria
10.3.2.11.1 Austria IoT Connected Machines Market by Component
10.3.2.11.2 Austria IoT Connected Machines Market by Industry
10.3.2.12 Rest of Western Europe
10.3.2.12.1 Rest of Western Europe IoT Connected Machines Market by Component
10.3.2.12.2 Rest of Western Europe IoT Connected Machines Market by Industry
10.4 Asia-Pacific
10.4.1 Asia Pacific IoT Connected Machines Market by Country
10.4.2 Asia Pacific IoT Connected Machines Market by Component
10.4.3 Asia Pacific IoT Connected Machines Market by Industry
10.4.4 China
10.4.4.1 China IoT Connected Machines Market by Component
10.4.4.2 China IoT Connected Machines Market by Industry
10.4.5 India
10.4.5.1 India IoT Connected Machines Market by Component
10.4.5.2 India IoT Connected Machines Market by Industry
10.4.6 Japan
10.4.6.1 Japan IoT Connected Machines Market by Component
10.4.6.2 Japan IoT Connected Machines Market by Industry
10.4.7 South Korea
10.4.7.1 South Korea IoT Connected Machines Market by Component
10.4.7.2 South Korea IoT Connected Machines Market by Industry
10.4.8 Vietnam
10.4.8.1 Vietnam IoT Connected Machines Market by Component
10.4.8.2 Vietnam IoT Connected Machines Market by Industry
10.4.9 Singapore
10.4.9.1 Singapore IoT Connected Machines Market by Component
10.4.9.2 Singapore IoT Connected Machines Market by Industry
10.4.10 Australia
10.4.10.1 Australia IoT Connected Machines Market by Component
10.4.10.2 Australia IoT Connected Machines Market by Industry
10.4.11 Rest of Asia-Pacific
10.4.11.1 Rest of Asia-Pacific IoT Connected Machines Market by Component
10.4.11.2 Rest of Asia-Pacific IoT Connected Machines Market by Industry
10.5 Middle East & Africa
10.5.1 Middle East
10.5.1.1 Middle East IoT Connected Machines Market by Country
10.5.1.2 Middle East IoT Connected Machines Market by Component
10.5.1.3 Middle East IoT Connected Machines Market by Industry
10.5.1.4 UAE
10.5.1.4.1 UAE IoT Connected Machines Market by Component
10.5.1.4.2 UAE IoT Connected Machines Market by Industry
10.5.1.5 Egypt
10.5.1.5.1 Egypt IoT Connected Machines Market by Component
10.5.1.5.2 Egypt IoT Connected Machines Market by Industry
10.5.1.6 Saudi Arabia
10.5.1.6.1 Saudi Arabia IoT Connected Machines Market by Component
10.5.1.6.2 Saudi Arabia IoT Connected Machines Market by Industry
10.5.1.7 Qatar
10.5.1.7.1 Qatar IoT Connected Machines Market by Component
10.5.1.7.2 Qatar IoT Connected Machines Market by Industry
10.5.1.8 Rest of Middle East
10.5.1.8.1 Rest of Middle East IoT Connected Machines Market by Component
10.5.1.8.2 Rest of Middle East IoT Connected Machines Market by Industry
10.5.2 Africa
10.5.2.1 Africa IoT Connected Machines Market by Country
10.5.2.2 Africa IoT Connected Machines Market by Component
10.5.2.3 Africa IoT Connected Machines Market by Industry
10.5.2.4 Nigeria
10.5.2.4.1 Nigeria IoT Connected Machines Market by Component
10.5.2.4.2 Nigeria IoT Connected Machines Market by Industry
10.5.2.5 South Africa
10.5.2.5.1 South Africa IoT Connected Machines Market by Component
10.5.2.5.2 South Africa IoT Connected Machines Market by Industry
10.5.2.6 Rest of Africa
10.5.2.6.1 Rest of Africa IoT Connected Machines Market by Component
10.5.2.6.2 Rest of Africa IoT Connected Machines Market by Industry
10.6 Latin America
10.6.1 Latin America IoT Connected Machines Market by Country
10.6.2 Latin America IoT Connected Machines Market by Component
10.6.3 Latin America IoT Connected Machines Market by Industry
10.6.4 Brazil
10.6.4.1 Brazil IoT Connected Machines Market by Component
10.6.4.2 Brazil Africa IoT Connected Machines Market by Industry
10.6.5 Argentina
10.6.5.1 Argentina IoT Connected Machines Market by Component
10.6.5.2 Argentina IoT Connected Machines Market by Industry
10.6.6 Colombia
10.6.6.1 Colombia IoT Connected Machines Market by Component
10.6.6.2 Colombia IoT Connected Machines Market by Industry
10.6.7 Rest of Latin America
10.6.7.1 Rest of Latin America IoT Connected Machines Market by Component
10.6.7.2 Rest of Latin America IoT Connected Machines Market by Industry

11 Company Profile
11.1 IBM Corporation
11.1.1 Company Overview
11.1.2 Financials
11.1.3 Product/ Services Offered
11.1.4 SWOT Analysis
11.1.5 The SNS View
11.2 Siemens AG
11.2.1 Company Overview
11.2.2 Financials
11.2.3 Product/ Services Offered
11.2.4 SWOT Analysis
11.2.5 The SNS View
11.3 Honeywell International Inc.
11.3.1 Company Overview
11.3.2 Financials
11.3.3 Product/ Services Offered
11.3.4 SWOT Analysis
11.3.5 The SNS View
11.4 Intel Corporation
11.4 Company Overview
11.4.2 Financials
11.4.3 Product/ Services Offered
11.4.4 SWOT Analysis
11.4.5 The SNS View
11.5 General Electric Company
11.5.1 Company Overview
11.5.2 Financials
11.5.3 Product/ Services Offered
11.5.4 SWOT Analysis
11.5.5 The SNS View
11.6 Hitachi Ltd.
11.6.1 Company Overview
11.6.2 Financials
11.6.3 Product/ Services Offered
11.6.4 SWOT Analysis
11.6.5 The SNS View
11.7 PTC Ltd.
11.7.1 Company Overview
11.7.2 Financials
11.7.3 Product/ Services Offered
11.7.4 SWOT Analysis
11.7.5 The SNS View
11.8 ABB Ltd.
11.8.1 Company Overview
11.8.2 Financials
11.8.3 Product/ Services Offered
11.8.4 SWOT Analysis
11.8.5 The SNS View
11.9 Rockwell Automation
11.9.1 Company Overview
11.9.2 Financials
11.9.3 Product/ Services Offered
11.9.4 SWOT Analysis
11.9.5 The SNS View
11.10 Schneider Electric
11.10.1 Company Overview
11.10.2 Financials
11.10.3 Product/ Services Offered
11.10.4 SWOT Analysis
11.10.5 The SNS View

12. Competitive Landscape
12.1 Competitive Benchmarking
12.2 Market Share Analysis
12.3 Recent Developments
12.3.1 Industry News
12.3.2 Company News
12.3.3 Mergers & Acquisitions

13. USE Cases and Best Practices

14. Conclusion

An accurate research report requires proper strategizing as well as implementation. There are multiple factors involved in the completion of good and accurate research report and selecting the best methodology to compete the research is the toughest part. Since the research reports we provide play a crucial role in any company’s decision-making process, therefore we at SNS Insider always believe that we should choose the best method which gives us results closer to reality. This allows us to reach at a stage wherein we can provide our clients best and accurate investment to output ratio.

Each report that we prepare takes a timeframe of 350-400 business hours for production. Starting from the selection of titles through a couple of in-depth brain storming session to the final QC process before uploading our titles on our website we dedicate around 350 working hours. The titles are selected based on their current market cap and the foreseen CAGR and growth.


The 5 steps process:

Step 1: Secondary Research:

Secondary Research or Desk Research is as the name suggests is a research process wherein, we collect data through the readily available information. In this process we use various paid and unpaid databases which our team has access to and gather data through the same. This includes examining of listed companies’ annual reports, Journals, SEC filling etc. Apart from this our team has access to various associations across the globe across different industries. Lastly, we have exchange relationships with various university as well as individual libraries.

Secondary Research

Step 2: Primary Research

When we talk about primary research, it is a type of study in which the researchers collect relevant data samples directly, rather than relying on previously collected data.  This type of research is focused on gaining content specific facts that can be sued to solve specific problems. Since the collected data is fresh and first hand therefore it makes the study more accurate and genuine.

We at SNS Insider have divided Primary Research into 2 parts.

Part 1 wherein we interview the KOLs of major players as well as the upcoming ones across various geographic regions. This allows us to have their view over the market scenario and acts as an important tool to come closer to the accurate market numbers. As many as 45 paid and unpaid primary interviews are taken from both the demand and supply side of the industry to make sure we land at an accurate judgement and analysis of the market.

This step involves the triangulation of data wherein our team analyses the interview transcripts, online survey responses and observation of on filed participants. The below mentioned chart should give a better understanding of the part 1 of the primary interview.

Primary Research

Part 2: In this part of primary research the data collected via secondary research and the part 1 of the primary research is validated with the interviews from individual consultants and subject matter experts.

Consultants are those set of people who have at least 12 years of experience and expertise within the industry whereas Subject Matter Experts are those with at least 15 years of experience behind their back within the same space. The data with the help of two main processes i.e., FGDs (Focused Group Discussions) and IDs (Individual Discussions). This gives us a 3rd party nonbiased primary view of the market scenario making it a more dependable one while collation of the data pointers.

Step 3: Data Bank Validation

Once all the information is collected via primary and secondary sources, we run that information for data validation. At our intelligence centre our research heads track a lot of information related to the market which includes the quarterly reports, the daily stock prices, and other relevant information. Our data bank server gets updated every fortnight and that is how the information which we collected using our primary and secondary information is revalidated in real time.

Data Bank Validation

Step 4: QA/QC Process

After all the data collection and validation our team does a final level of quality check and quality assurance to get rid of any unwanted or undesired mistakes. This might include but not limited to getting rid of the any typos, duplication of numbers or missing of any important information. The people involved in this process include technical content writers, research heads and graphics people. Once this process is completed the title gets uploader on our platform for our clients to read it.

Step 5: Final QC/QA Process:

This is the last process and comes when the client has ordered the study. In this process a final QA/QC is done before the study is emailed to the client. Since we believe in giving our clients a good experience of our research studies, therefore, to make sure that we do not lack at our end in any way humanly possible we do a final round of quality check and then dispatch the study to the client.


  •            5000 (33% Discount)


  •            8950 (40% Discount)


  •            3050 (23% Discount)

Start a Conversation

Hi! Click one of our member below to chat on Phone